Apple's Financial Report: Cash Management, Risk Factors, and Strategy
VerifiedAdded on 2023/01/13
|18
|3444
|36
Report
AI Summary
This report analyzes Apple's financial statements from 1995 to 2012, focusing on cash management, profitability, and liquidity. It examines Apple's declining liquidity ratios, increasing profitability ratios, and efficient use of capital. The report investigates Apple's reasons for issuing new common stock despite a large cash position, and discusses traditional financial ratios that might be distorted. It assesses Apple's return on equity and compares it to other companies. Major risk factors, including market fluctuations, currency exchange rates, competition, financing, and technological changes, are identified. The report also analyzes Apple's dividend policy, share repurchase program, and capital structure, providing calculations and interpretations of key financial metrics such as EV/EBIT, EV/Sales, and discounted cash flow. The analysis concludes with an evaluation of Apple's overall financial performance and future outlook.
Apple - Time to Think Different
about cash
about cash
Paraphrase This Document
Need a fresh take? Get an instant paraphrase of this document with our AI Paraphraser
TABLE OF CONTENTS
1. Analysis of the financial statement..............................................................................................4
a. Providing brief analysis of the Apple's current final reports and key evolutions over a period
of 1995-2012................................................................................................................................4
b. Stating the reason of issuing new common stock every year by Apple, despite the abundant
cash position and the shortage of requirement in raising an additional capital...........................8
c. With respect to Apple's peculiarities, stating the traditional ratio that might be hugely
distorted.......................................................................................................................................8
d. Assessing return on Equity of Apple on the basis of the book and market value...................8
e. reason for decreasing operating cash flow of Apple than Exon..............................................9
2.......................................................................................................................................................9
Detecting the major risk factors that adversely affects future business of an enterprise.............9
3.....................................................................................................................................................10
(a)...............................................................................................................................................10
(b)...............................................................................................................................................11
©................................................................................................................................................11
(4)...............................................................................................................................................14
4.....................................................................................................................................................15
a. representing that Apple's cash pile comes at an expense of the shareholders.......................15
5.....................................................................................................................................................15
a. Analysing past and the new dividend policy of Apple..........................................................15
b. Explaining the foremost objective of the share repurchase program and the way in which it
is financed..................................................................................................................................15
c. Describing and evaluating the capital structure of Apple......................................................15
REFERENCES..............................................................................................................................17
Table 1EV/EBIT calculation.........................................................................................................10
Table 2EV/sales ratio.....................................................................................................................11
Table 3Cash flow...........................................................................................................................11
Table 4Discounted cash flow.........................................................................................................12
Table 5CAPM model.....................................................................................................................12
Table 6Enterprise value.................................................................................................................12
Table 7SDebt equity weight and WACC calculation....................................................................13
Table 8Terminal value...................................................................................................................13
Table 9Equity value.......................................................................................................................14
Table 10Intrinsic value of equity...................................................................................................14
⊘ This is a preview!⊘
Do you want full access?
Subscribe today to unlock all pages.
Trusted by 1+ million students worldwide
1. Analysis of the financial statement
a. Providing brief analysis of the Apple's current final reports and key evolutions over a period of
1995-2012
Particulars Formula 2011 2012
Liquidity ratio
Current assets 44988 57653
Current liabilities 27970 38542
Current ratio
Current
assets/Current
liabilities 1.61 1.50
Current assets 44988 57653
Inventory 776 791
Quick assets 44212 56862
Current liabilities 27970 38542
Quick ratio
Quick assets/Current
liabilities 1.58 1.48
Profitability ratio
Net profit 25922 41733
Net sales 108249 156508
Net profit margin
Net profit/Net
sales*100 23.95% 26.67%
Gross Profit 43818 68662
Net sales 108249 156508
Gross profit ratio
Gross profit/Net
sales*100 40.48% 43.87%
Paraphrase This Document
Need a fresh take? Get an instant paraphrase of this document with our AI Paraphraser
Operating profit 33790 55241
Total assets 116371 176064
Current liabilities 27970 38542
Capital employed 88401 137522
Return on capital
employed
Operating
profit/Capital
employed*100 38.22% 40.17%
Leverage ratios
Long term borrowings 10100 16664
Owners funds 76615 118210
Debt-equity ratio
Long term
debts/Equity funds 0.13 0.14
Earning before interest
and taxes 33790 55241
Interest expense 415 522
Interest coverage ratio
EBIT/interest
expense 81.4 105.8
Efficiency ratio
Cost of goods sold 64431 87846
Average inventories 776 791
Inventory turnover
ratio
COGS/Avg.
Inventory 83.03 111.06
Net sales 108249 156508
Average total assets 116371 176064
Asset turnover ratio
Net sales/Avg total
assets 0.93 0.89
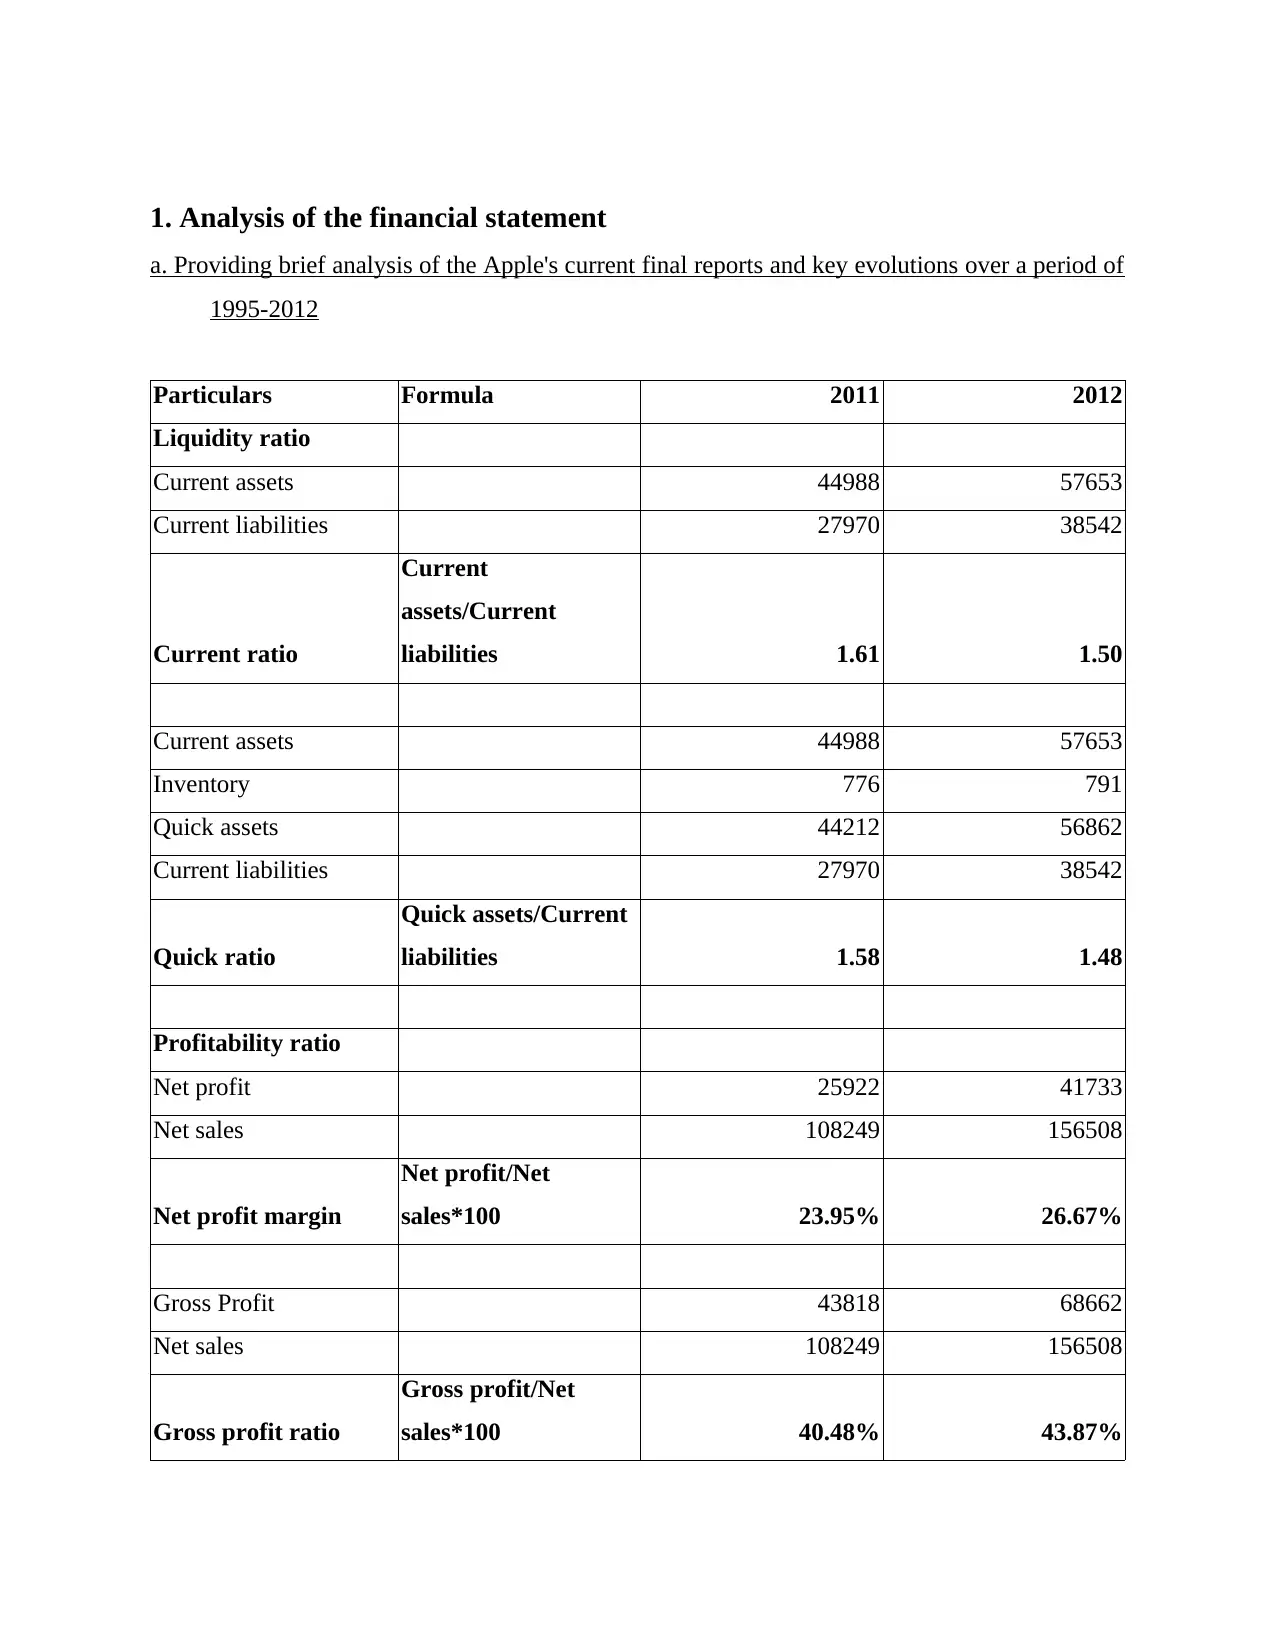
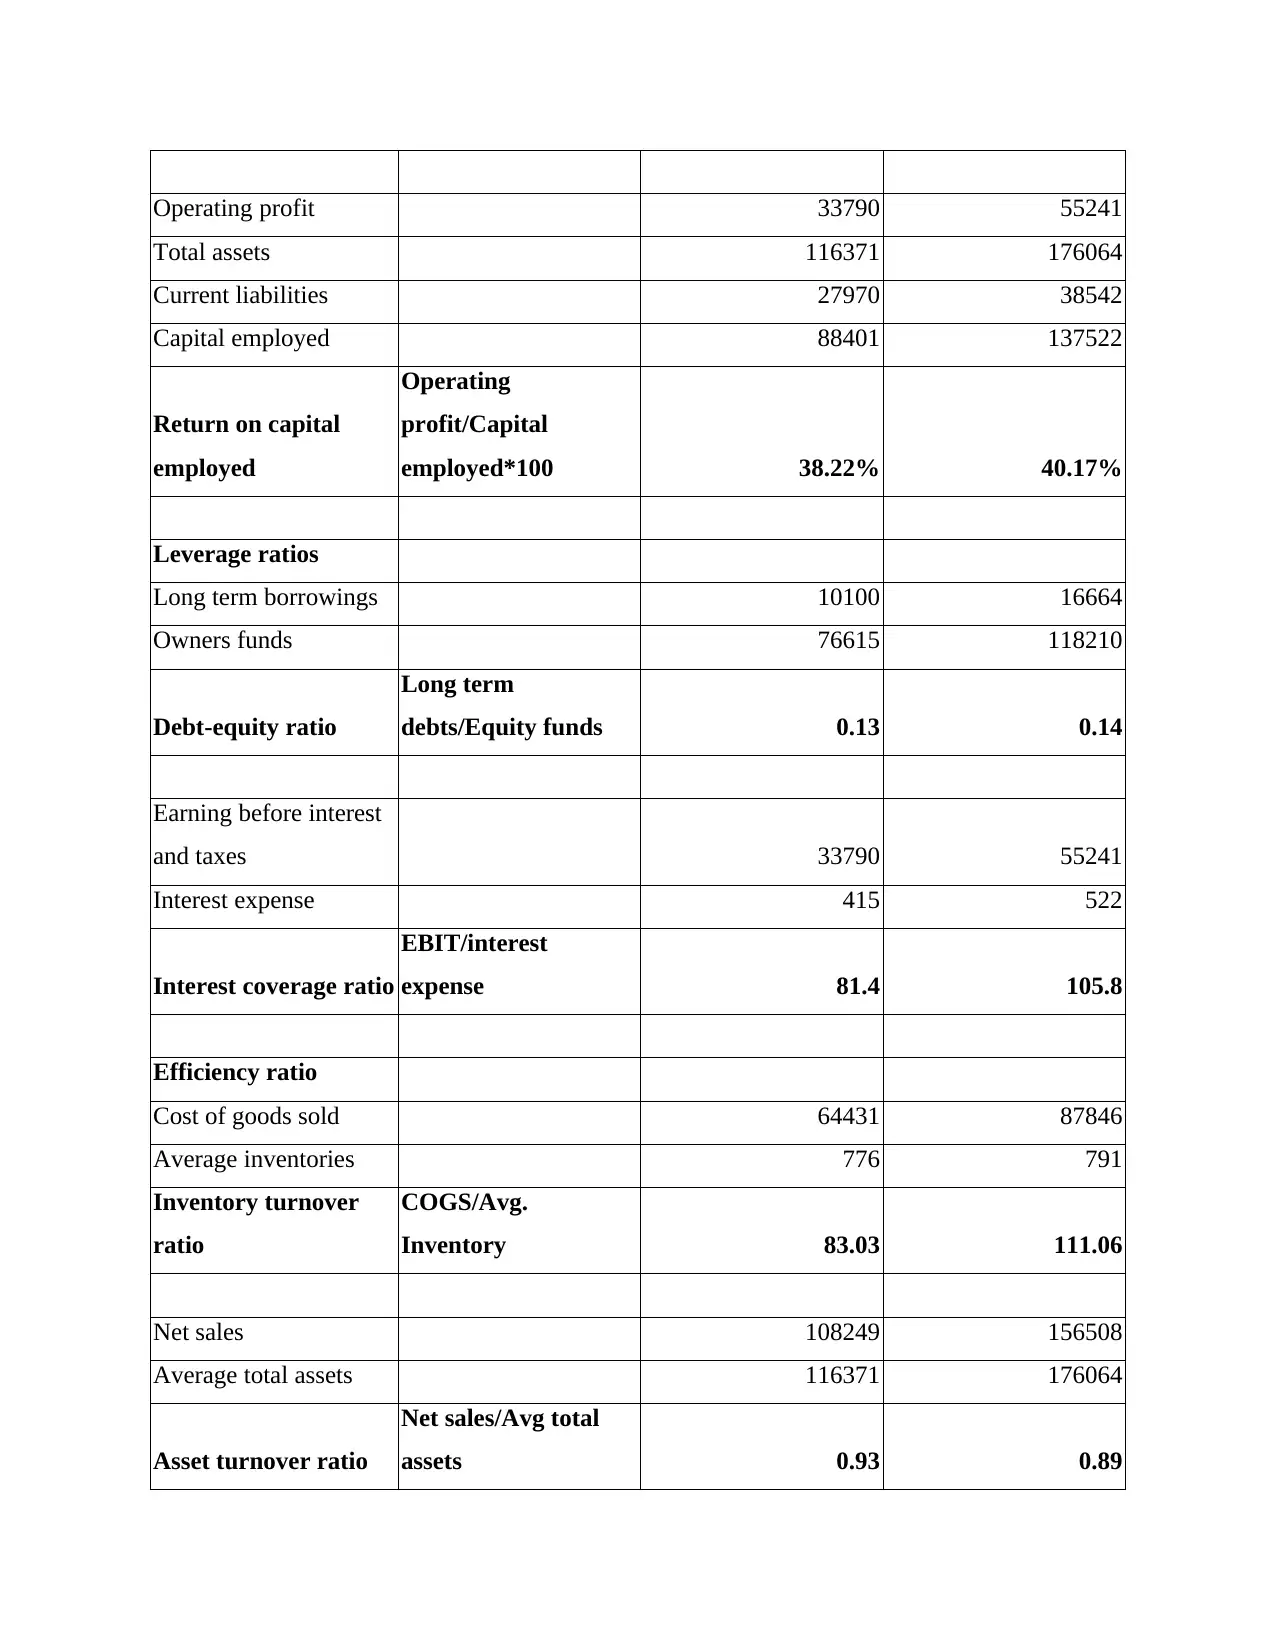
Interpretation- from the above analysis it has been depicted that liquidity ratio of Apple
in the recent years is declining which clearly shows that liquidity position of the company is not
good. The current ratio of an entity is showing a declining trend that is from 1.61 in the year
2011 to 1.50 in 2012. This reflects that Apple has to focus on managing its current assets
effectively in order to meet its short term obligations. Similarly, the quick ratio of the firm is also
decreasing from 1.58 to 1.48 in recent years. On the other side, the profitability ratios of Apple
shows an increasing trend which indicates that an enterprise is earning higher profits from one
period to another after paying off all its cost, expenses and the tax liability (Monahan, 2018).
The leverage position of Apple is seen as better because it has maintained adequate proportion of
the debt against its equities and its interest ratio is rising which clearly reflects that it has the
capability in meeting its interest expenses adequately because profits are increasing with greater
value. Moreover, it has been analysed from the evaluation that Apple is not efficient in turning
out its inventory into cash on a quack basis as its cost of sales is increasing which results to
increase in the ratio. Also it is not making effective use of its assets for increasing its sales.
Overall, the performance and position of Apple is becoming better as per the recent final reports.
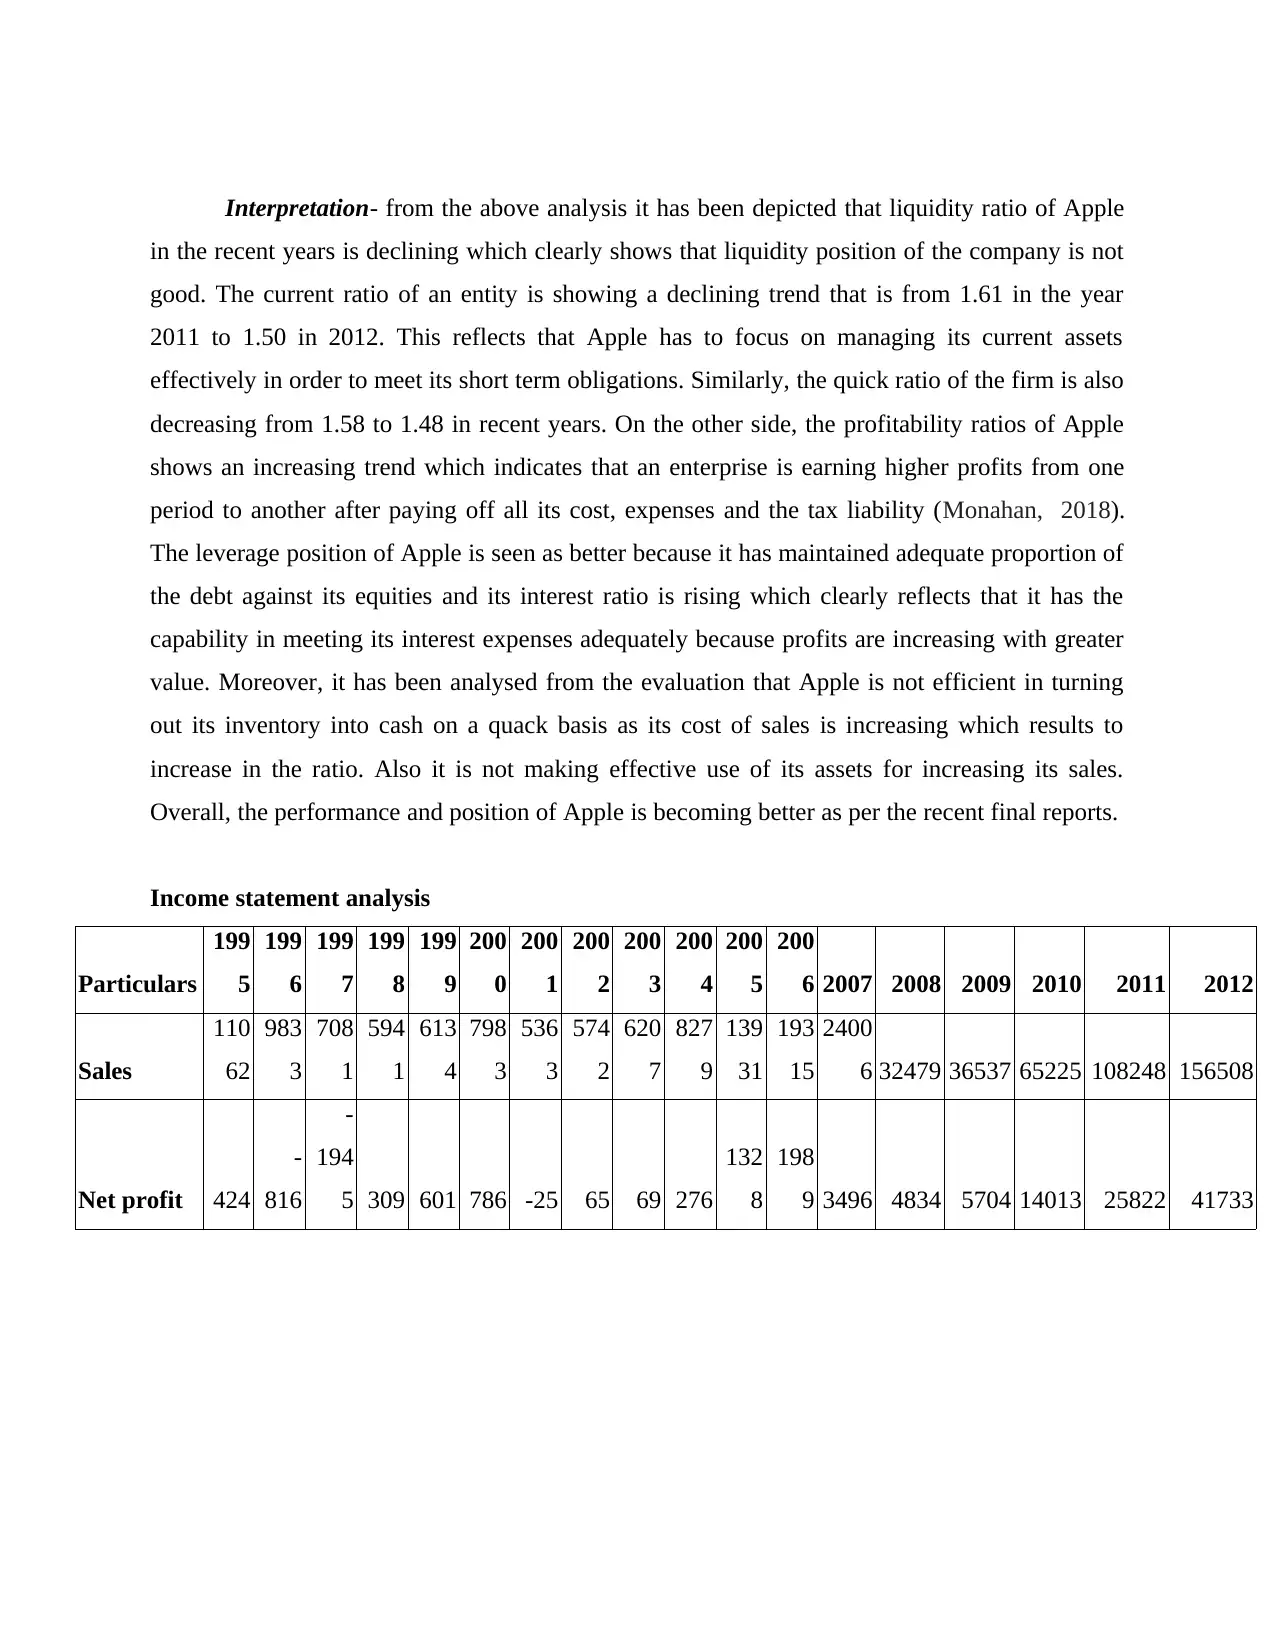
Income statement analysis
Particulars
199
5
199
6
199
7
199
8
199
9
200
0
200
1
200
2
200
3
200
4
200
5
200
6 2007 2008 2009 2010 2011 2012
Sales
110
62
983
3
708
1
594
1
613
4
798
3
536
3
574
2
620
7
827
9
139
31
193
15
2400
6 32479 36537 65225 108248 156508
Net profit 424
-
816
-
194
5 309 601 786 -25 65 69 276
132
8
198
9 3496 4834 5704 14013 25822 41733
in the recent years is declining which clearly shows that liquidity position of the company is not
good. The current ratio of an entity is showing a declining trend that is from 1.61 in the year
2011 to 1.50 in 2012. This reflects that Apple has to focus on managing its current assets
effectively in order to meet its short term obligations. Similarly, the quick ratio of the firm is also
decreasing from 1.58 to 1.48 in recent years. On the other side, the profitability ratios of Apple
shows an increasing trend which indicates that an enterprise is earning higher profits from one
period to another after paying off all its cost, expenses and the tax liability (Monahan, 2018).
The leverage position of Apple is seen as better because it has maintained adequate proportion of
the debt against its equities and its interest ratio is rising which clearly reflects that it has the
capability in meeting its interest expenses adequately because profits are increasing with greater
value. Moreover, it has been analysed from the evaluation that Apple is not efficient in turning
out its inventory into cash on a quack basis as its cost of sales is increasing which results to
increase in the ratio. Also it is not making effective use of its assets for increasing its sales.
Overall, the performance and position of Apple is becoming better as per the recent final reports.
Income statement analysis
Particulars
199
5
199
6
199
7
199
8
199
9
200
0
200
1
200
2
200
3
200
4
200
5
200
6 2007 2008 2009 2010 2011 2012
Sales
110
62
983
3
708
1
594
1
613
4
798
3
536
3
574
2
620
7
827
9
139
31
193
15
2400
6 32479 36537 65225 108248 156508
Net profit 424
-
816
-
194
5 309 601 786 -25 65 69 276
132
8
198
9 3496 4834 5704 14013 25822 41733
⊘ This is a preview!⊘
Do you want full access?
Subscribe today to unlock all pages.
Trusted by 1+ million students worldwide
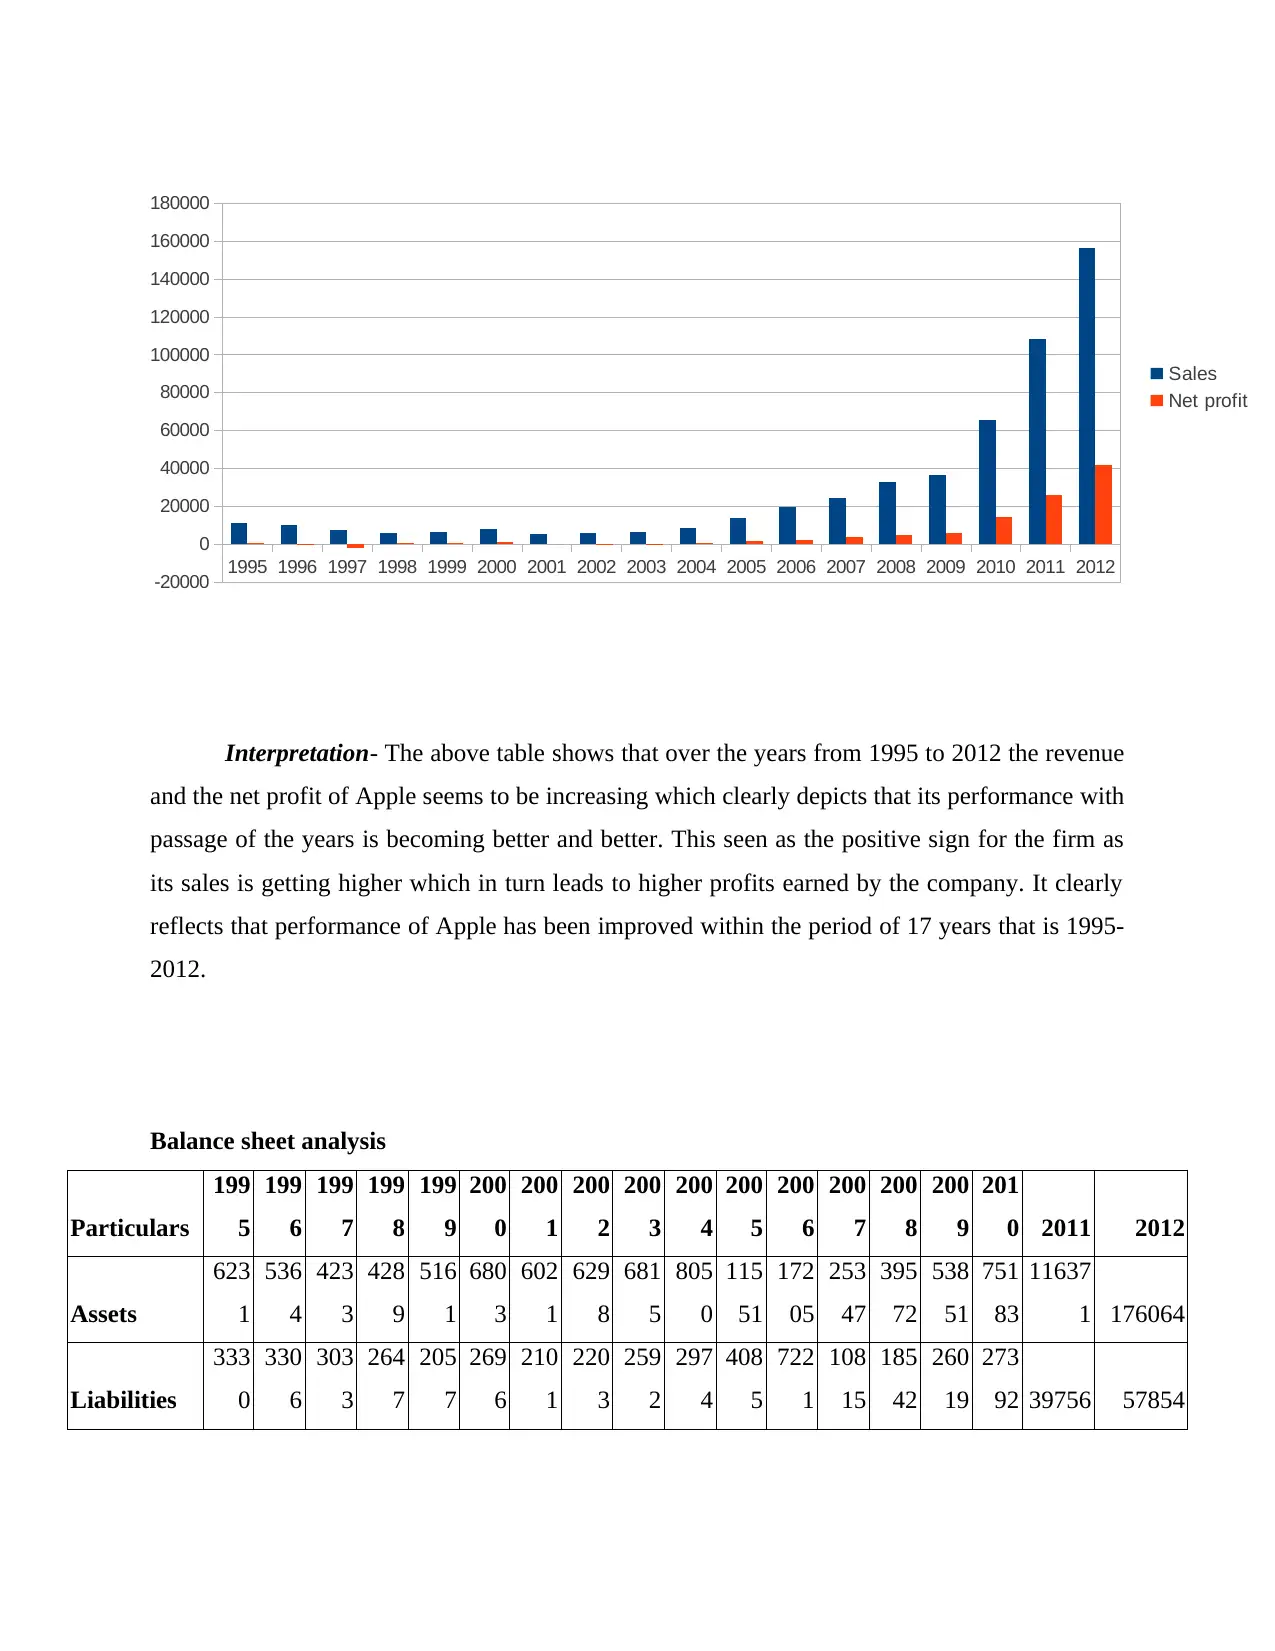
Interpretation- The above table shows that over the years from 1995 to 2012 the revenue
and the net profit of Apple seems to be increasing which clearly depicts that its performance with
passage of the years is becoming better and better. This seen as the positive sign for the firm as
its sales is getting higher which in turn leads to higher profits earned by the company. It clearly
reflects that performance of Apple has been improved within the period of 17 years that is 1995-
2012.
Balance sheet analysis
Particulars
199
5
199
6
199
7
199
8
199
9
200
0
200
1
200
2
200
3
200
4
200
5
200
6
200
7
200
8
200
9
201
0 2011 2012
Assets
623
1
536
4
423
3
428
9
516
1
680
3
602
1
629
8
681
5
805
0
115
51
172
05
253
47
395
72
538
51
751
83
11637
1 176064
Liabilities
333
0
330
6
303
3
264
7
205
7
269
6
210
1
220
3
259
2
297
4
408
5
722
1
108
15
185
42
260
19
273
92 39756 57854
1995 1996 1997 1998 1999 2000 2001 2002 2003 2004 2005 2006 2007 2008 2009 2010 2011 2012
-20000
0
20000
40000
60000
80000
100000
120000
140000
160000
180000
Sales
Net profit
Paraphrase This Document
Need a fresh take? Get an instant paraphrase of this document with our AI Paraphraser
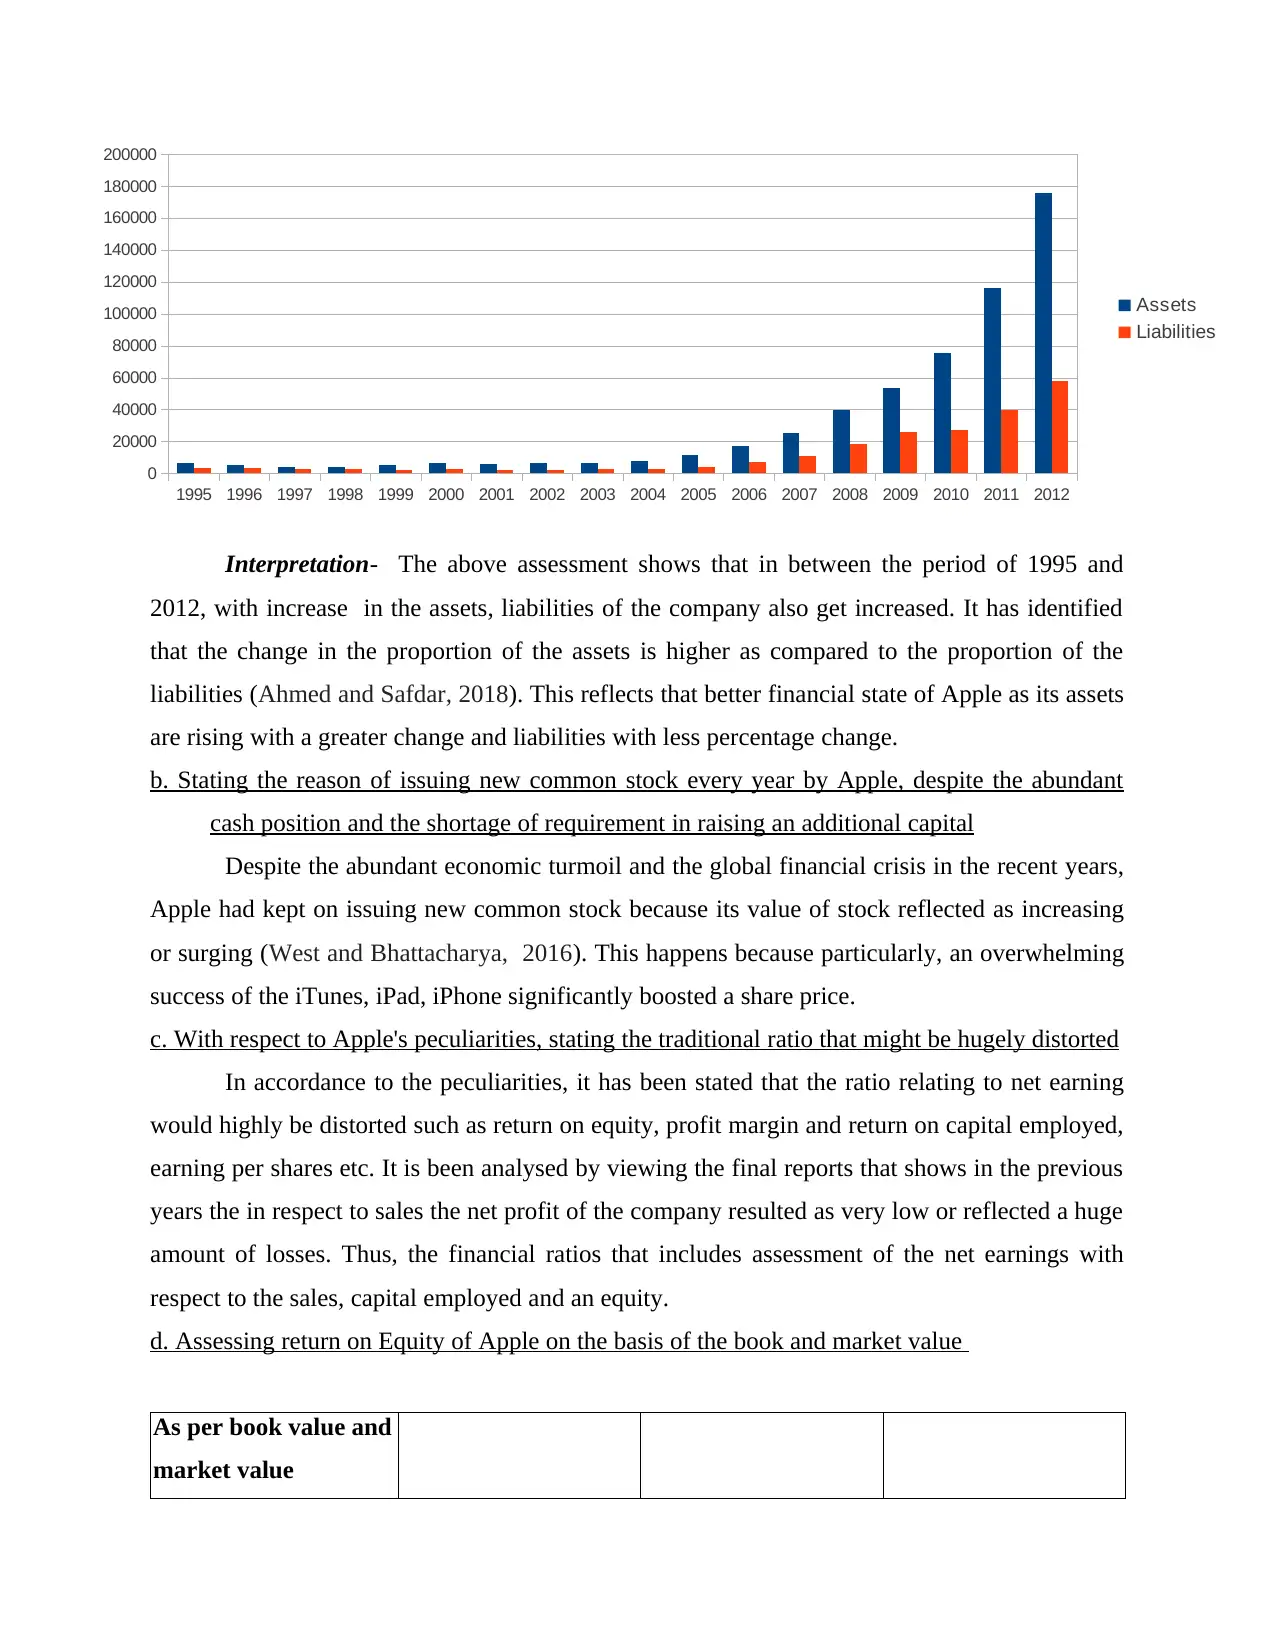
Interpretation- The above assessment shows that in between the period of 1995 and
2012, with increase in the assets, liabilities of the company also get increased. It has identified
that the change in the proportion of the assets is higher as compared to the proportion of the
liabilities (Ahmed and Safdar, 2018). This reflects that better financial state of Apple as its assets
are rising with a greater change and liabilities with less percentage change.
b. Stating the reason of issuing new common stock every year by Apple, despite the abundant
cash position and the shortage of requirement in raising an additional capital
Despite the abundant economic turmoil and the global financial crisis in the recent years,
Apple had kept on issuing new common stock because its value of stock reflected as increasing
or surging (West and Bhattacharya, 2016). This happens because particularly, an overwhelming
success of the iTunes, iPad, iPhone significantly boosted a share price.
c. With respect to Apple's peculiarities, stating the traditional ratio that might be hugely distorted
In accordance to the peculiarities, it has been stated that the ratio relating to net earning
would highly be distorted such as return on equity, profit margin and return on capital employed,
earning per shares etc. It is been analysed by viewing the final reports that shows in the previous
years the in respect to sales the net profit of the company resulted as very low or reflected a huge
amount of losses. Thus, the financial ratios that includes assessment of the net earnings with
respect to the sales, capital employed and an equity.
d. Assessing return on Equity of Apple on the basis of the book and market value
As per book value and
market value
1995 1996 1997 1998 1999 2000 2001 2002 2003 2004 2005 2006 2007 2008 2009 2010 2011 2012
0
20000
40000
60000
80000
100000
120000
140000
160000
180000
200000
Assets
Liabilities
Particulars Formula 2011 2012
Net income 25922 41733
Shareholders funds 76615 118210
Return on equity
Net
income/Shareholders
funds 33.83% 35.30%
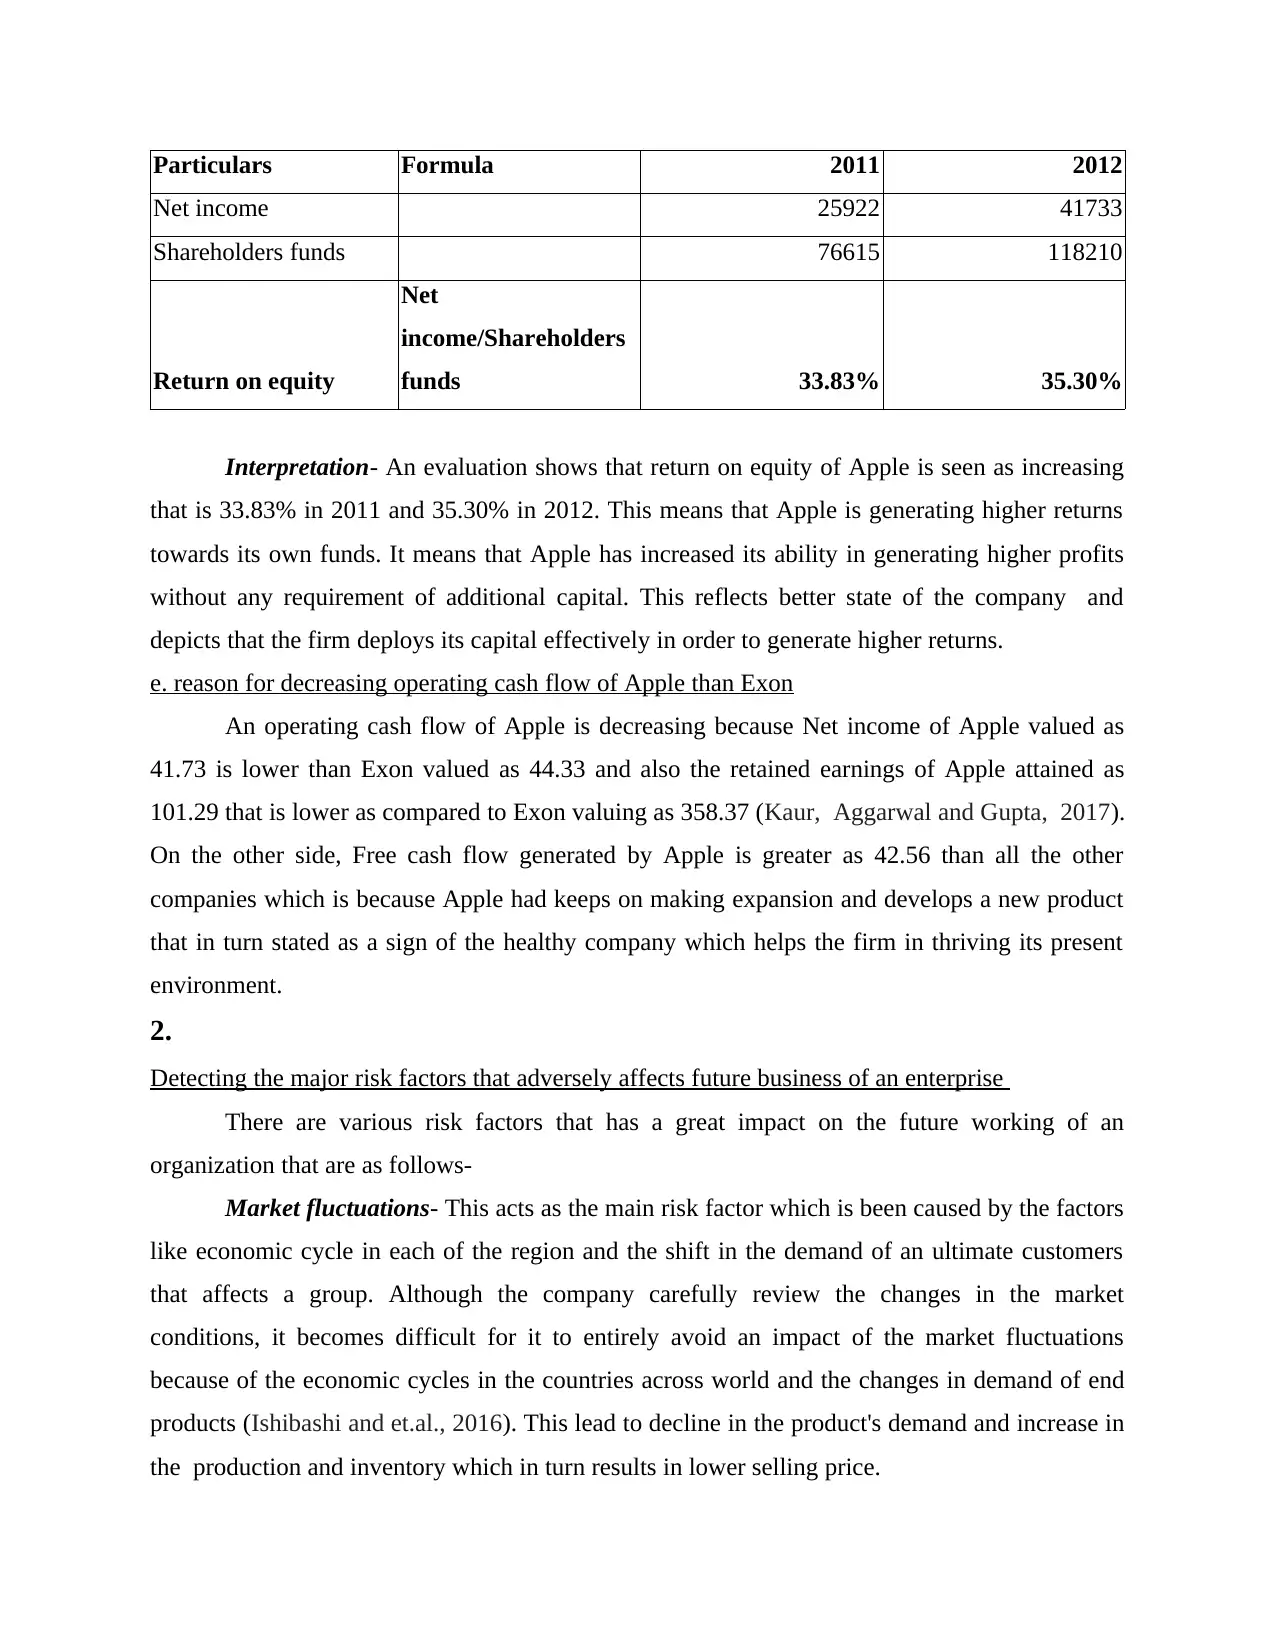
Interpretation- An evaluation shows that return on equity of Apple is seen as increasing
that is 33.83% in 2011 and 35.30% in 2012. This means that Apple is generating higher returns
towards its own funds. It means that Apple has increased its ability in generating higher profits
without any requirement of additional capital. This reflects better state of the company and
depicts that the firm deploys its capital effectively in order to generate higher returns.
e. reason for decreasing operating cash flow of Apple than Exon
An operating cash flow of Apple is decreasing because Net income of Apple valued as
41.73 is lower than Exon valued as 44.33 and also the retained earnings of Apple attained as
101.29 that is lower as compared to Exon valuing as 358.37 (Kaur, Aggarwal and Gupta, 2017).
On the other side, Free cash flow generated by Apple is greater as 42.56 than all the other
companies which is because Apple had keeps on making expansion and develops a new product
that in turn stated as a sign of the healthy company which helps the firm in thriving its present
environment.
2.
Detecting the major risk factors that adversely affects future business of an enterprise
There are various risk factors that has a great impact on the future working of an
organization that are as follows-
Market fluctuations- This acts as the main risk factor which is been caused by the factors
like economic cycle in each of the region and the shift in the demand of an ultimate customers
that affects a group. Although the company carefully review the changes in the market
conditions, it becomes difficult for it to entirely avoid an impact of the market fluctuations
because of the economic cycles in the countries across world and the changes in demand of end
products (Ishibashi and et.al., 2016). This lead to decline in the product's demand and increase in
the production and inventory which in turn results in lower selling price.
Net income 25922 41733
Shareholders funds 76615 118210
Return on equity
Net
income/Shareholders
funds 33.83% 35.30%
Interpretation- An evaluation shows that return on equity of Apple is seen as increasing
that is 33.83% in 2011 and 35.30% in 2012. This means that Apple is generating higher returns
towards its own funds. It means that Apple has increased its ability in generating higher profits
without any requirement of additional capital. This reflects better state of the company and
depicts that the firm deploys its capital effectively in order to generate higher returns.
e. reason for decreasing operating cash flow of Apple than Exon
An operating cash flow of Apple is decreasing because Net income of Apple valued as
41.73 is lower than Exon valued as 44.33 and also the retained earnings of Apple attained as
101.29 that is lower as compared to Exon valuing as 358.37 (Kaur, Aggarwal and Gupta, 2017).
On the other side, Free cash flow generated by Apple is greater as 42.56 than all the other
companies which is because Apple had keeps on making expansion and develops a new product
that in turn stated as a sign of the healthy company which helps the firm in thriving its present
environment.
2.
Detecting the major risk factors that adversely affects future business of an enterprise
There are various risk factors that has a great impact on the future working of an
organization that are as follows-
Market fluctuations- This acts as the main risk factor which is been caused by the factors
like economic cycle in each of the region and the shift in the demand of an ultimate customers
that affects a group. Although the company carefully review the changes in the market
conditions, it becomes difficult for it to entirely avoid an impact of the market fluctuations
because of the economic cycles in the countries across world and the changes in demand of end
products (Ishibashi and et.al., 2016). This lead to decline in the product's demand and increase in
the production and inventory which in turn results in lower selling price.
⊘ This is a preview!⊘
Do you want full access?
Subscribe today to unlock all pages.
Trusted by 1+ million students worldwide
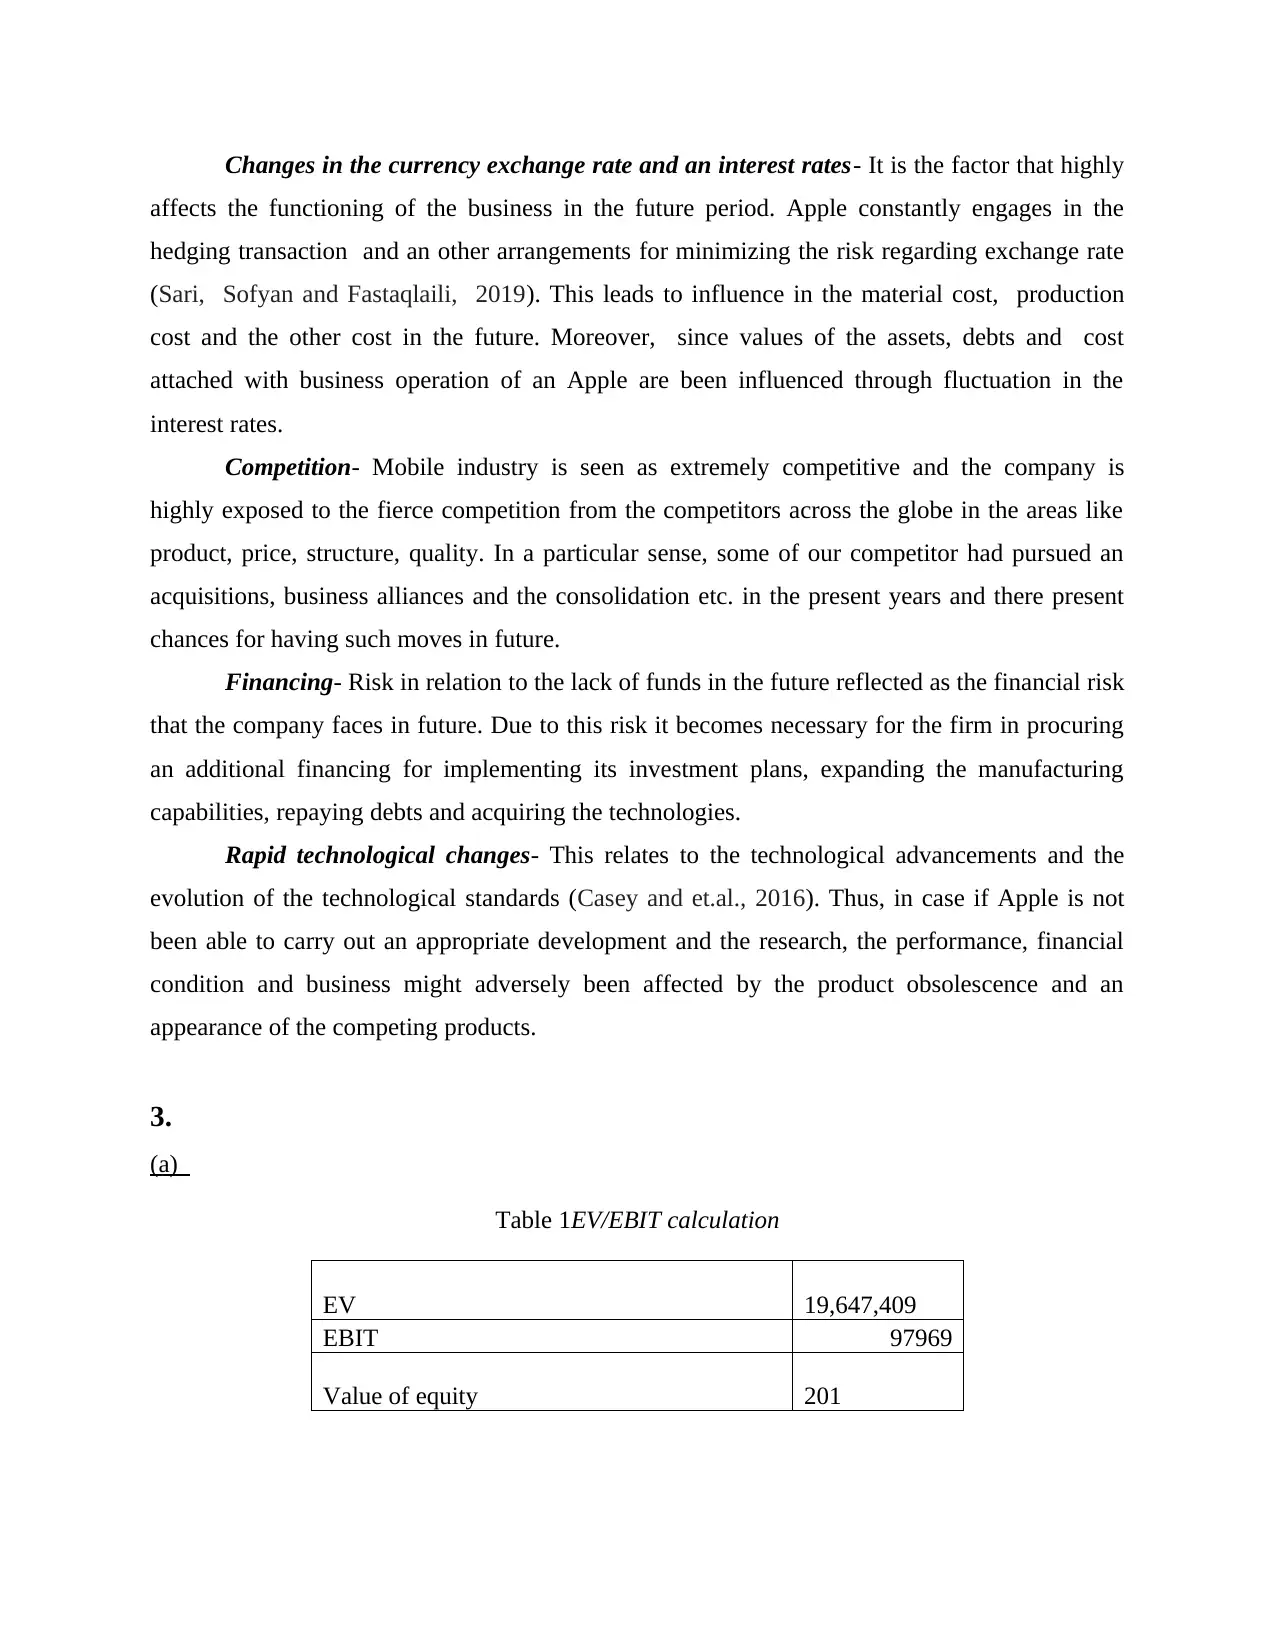
Changes in the currency exchange rate and an interest rates- It is the factor that highly
affects the functioning of the business in the future period. Apple constantly engages in the
hedging transaction and an other arrangements for minimizing the risk regarding exchange rate
(Sari, Sofyan and Fastaqlaili, 2019). This leads to influence in the material cost, production
cost and the other cost in the future. Moreover, since values of the assets, debts and cost
attached with business operation of an Apple are been influenced through fluctuation in the
interest rates.
Competition- Mobile industry is seen as extremely competitive and the company is
highly exposed to the fierce competition from the competitors across the globe in the areas like
product, price, structure, quality. In a particular sense, some of our competitor had pursued an
acquisitions, business alliances and the consolidation etc. in the present years and there present
chances for having such moves in future.
Financing- Risk in relation to the lack of funds in the future reflected as the financial risk
that the company faces in future. Due to this risk it becomes necessary for the firm in procuring
an additional financing for implementing its investment plans, expanding the manufacturing
capabilities, repaying debts and acquiring the technologies.
Rapid technological changes- This relates to the technological advancements and the
evolution of the technological standards (Casey and et.al., 2016). Thus, in case if Apple is not
been able to carry out an appropriate development and the research, the performance, financial
condition and business might adversely been affected by the product obsolescence and an
appearance of the competing products.
3.
(a)
Table 1EV/EBIT calculation
EV 19,647,409
EBIT 97969
Value of equity 201
Paraphrase This Document
Need a fresh take? Get an instant paraphrase of this document with our AI Paraphraser
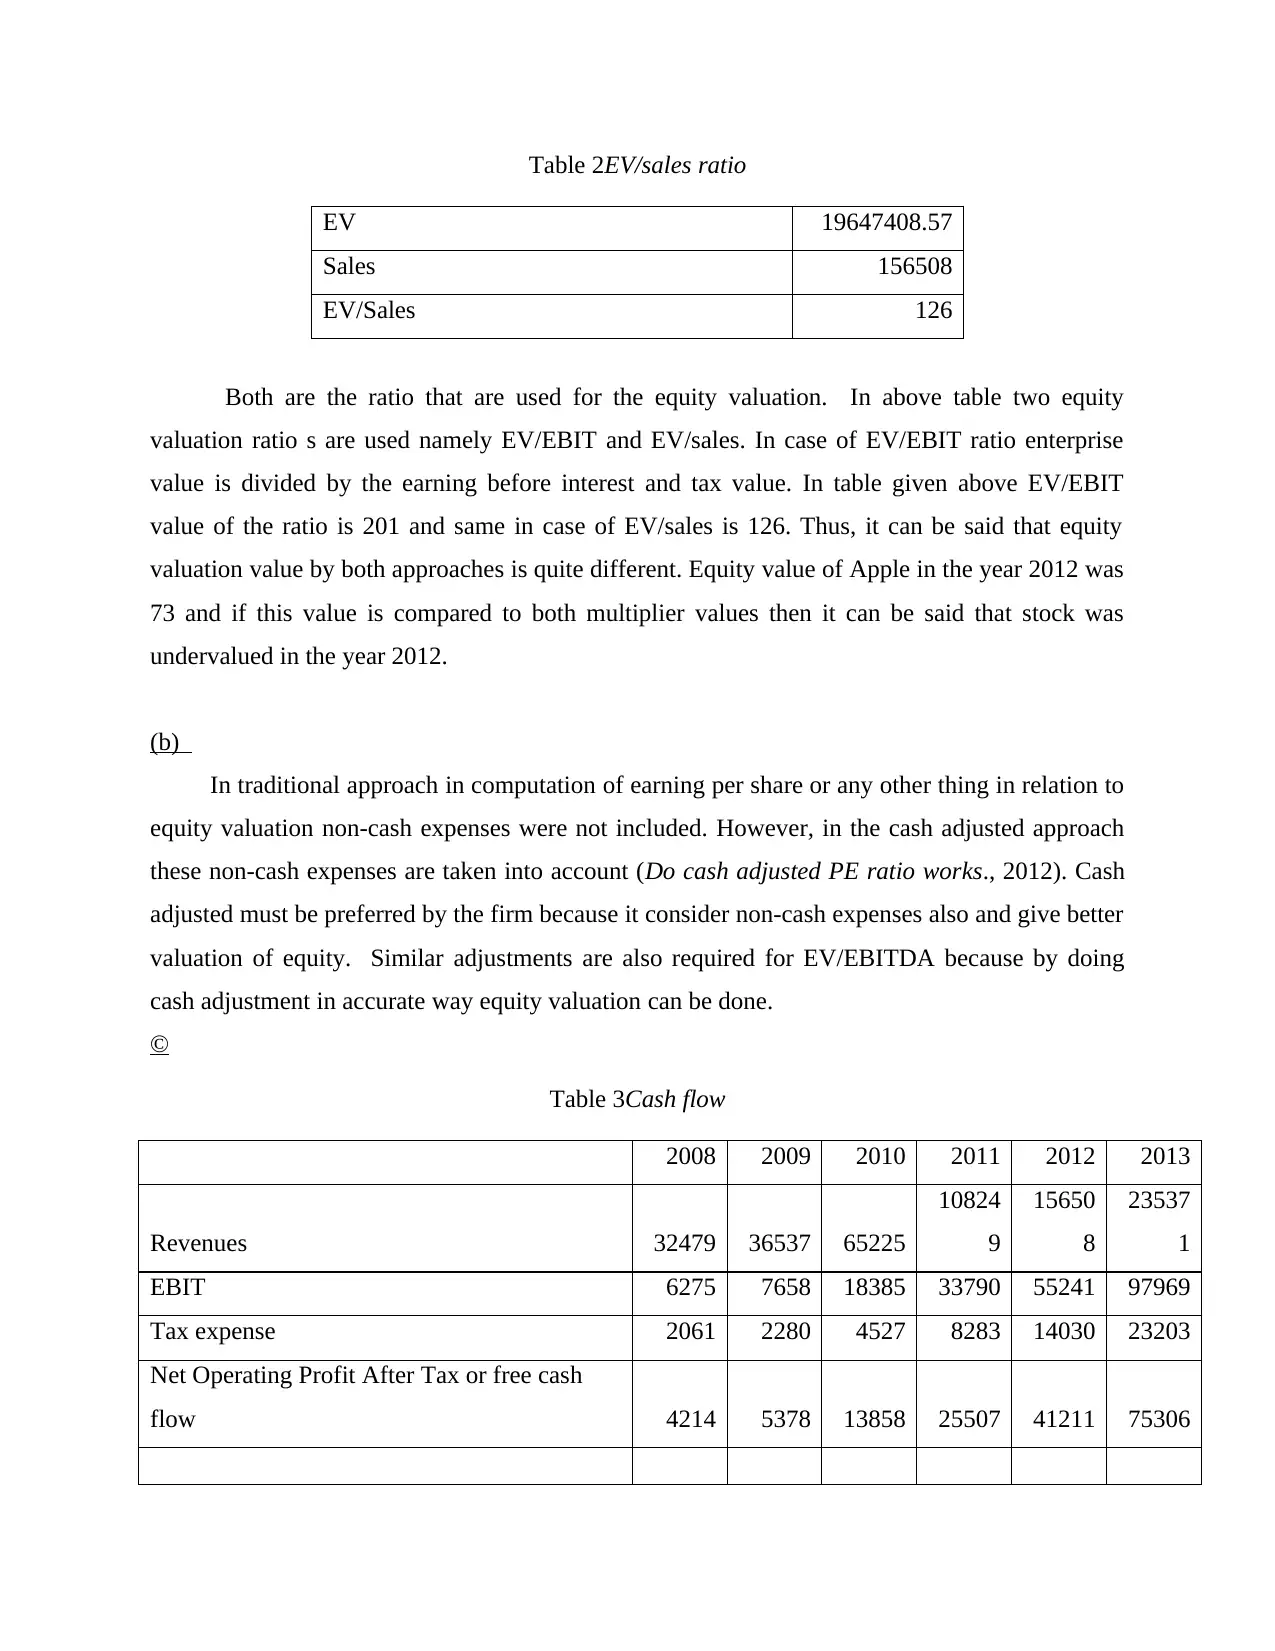
Table 2EV/sales ratio
EV 19647408.57
Sales 156508
EV/Sales 126
Both are the ratio that are used for the equity valuation. In above table two equity
valuation ratio s are used namely EV/EBIT and EV/sales. In case of EV/EBIT ratio enterprise
value is divided by the earning before interest and tax value. In table given above EV/EBIT
value of the ratio is 201 and same in case of EV/sales is 126. Thus, it can be said that equity
valuation value by both approaches is quite different. Equity value of Apple in the year 2012 was
73 and if this value is compared to both multiplier values then it can be said that stock was
undervalued in the year 2012.
(b)
In traditional approach in computation of earning per share or any other thing in relation to
equity valuation non-cash expenses were not included. However, in the cash adjusted approach
these non-cash expenses are taken into account (Do cash adjusted PE ratio works., 2012). Cash
adjusted must be preferred by the firm because it consider non-cash expenses also and give better
valuation of equity. Similar adjustments are also required for EV/EBITDA because by doing
cash adjustment in accurate way equity valuation can be done.
©
Table 3Cash flow
2008 2009 2010 2011 2012 2013
Revenues 32479 36537 65225
10824
9
15650
8
23537
1
EBIT 6275 7658 18385 33790 55241 97969
Tax expense 2061 2280 4527 8283 14030 23203
Net Operating Profit After Tax or free cash
flow 4214 5378 13858 25507 41211 75306
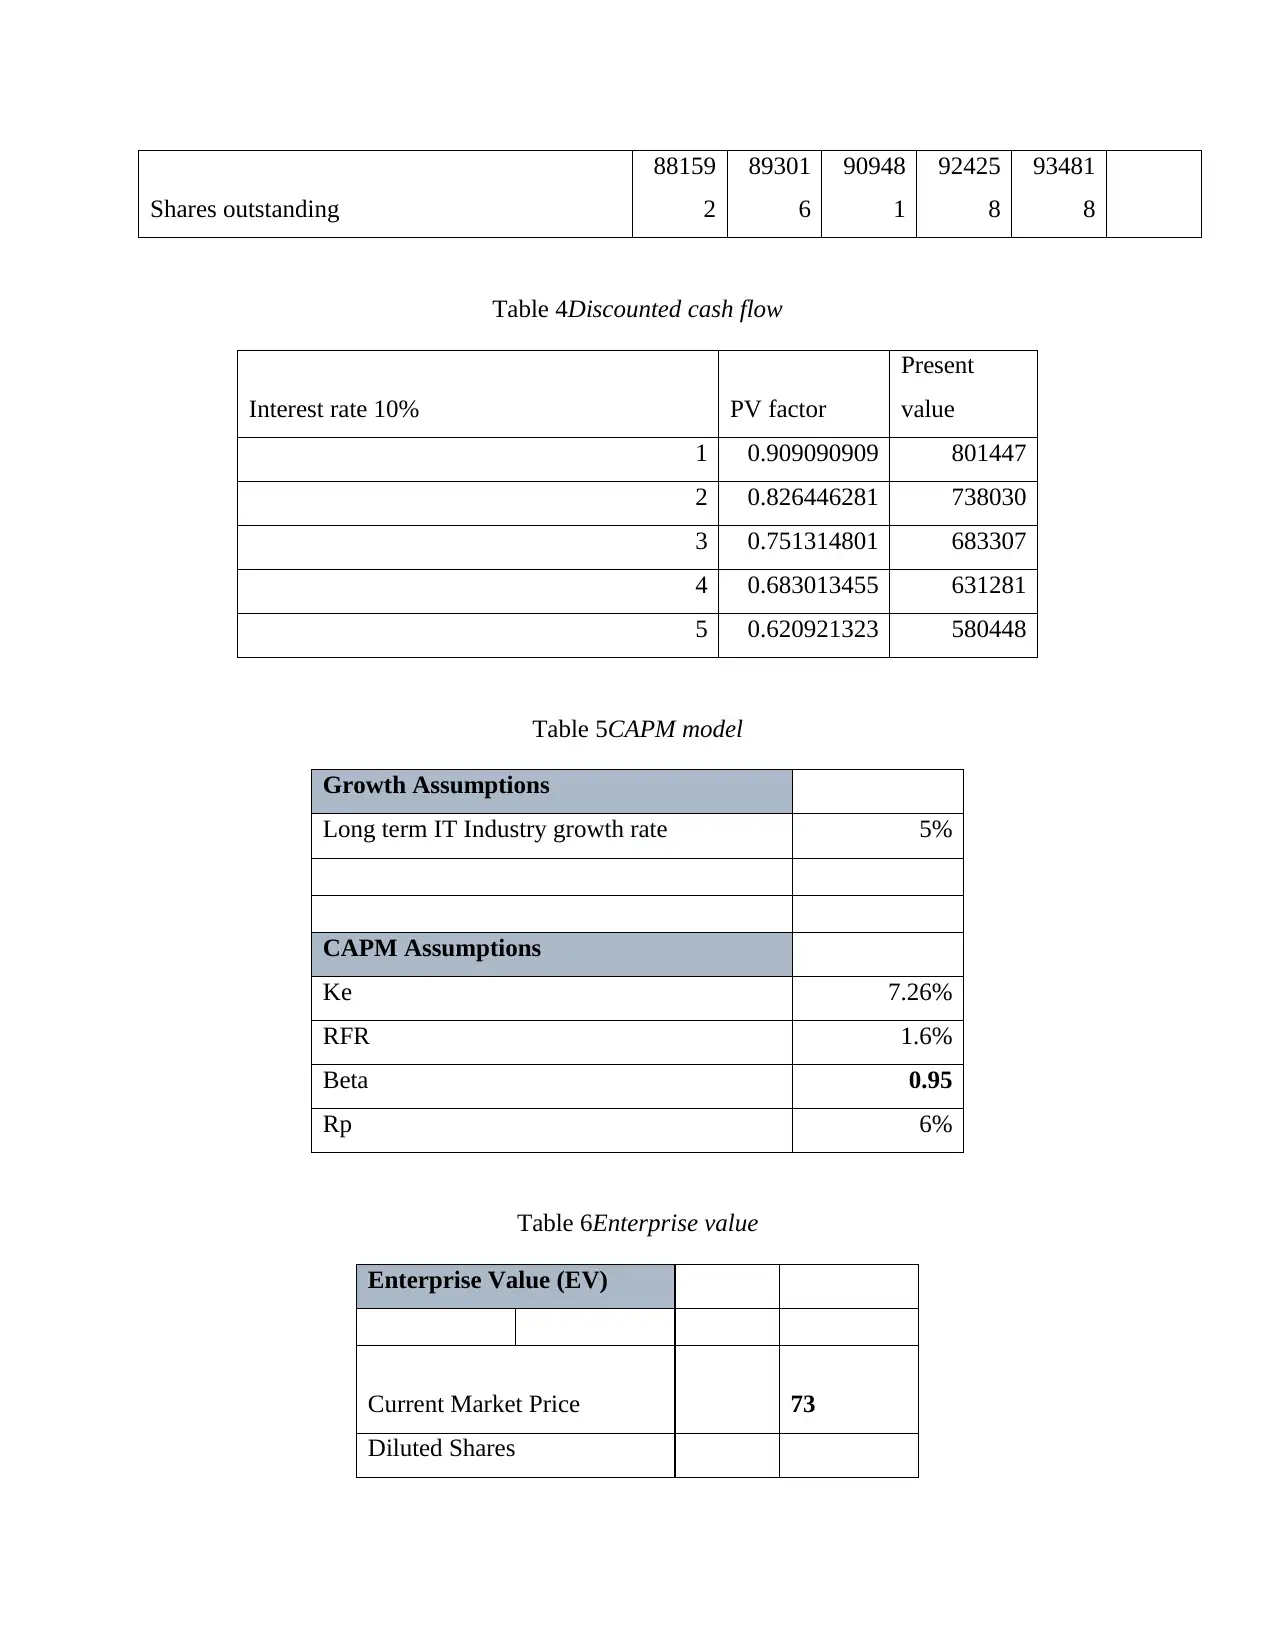
Shares outstanding
88159
2
89301
6
90948
1
92425
8
93481
8
Table 4Discounted cash flow
Interest rate 10% PV factor
Present
value
1 0.909090909 801447
2 0.826446281 738030
3 0.751314801 683307
4 0.683013455 631281
5 0.620921323 580448
Table 5CAPM model
Growth Assumptions
Long term IT Industry growth rate 5%
CAPM Assumptions
Ke 7.26%
RFR 1.6%
Beta 0.95
Rp 6%
Table 6Enterprise value
Enterprise Value (EV)
Current Market Price 73
Diluted Shares
⊘ This is a preview!⊘
Do you want full access?
Subscribe today to unlock all pages.
Trusted by 1+ million students worldwide
1 out of 18
Related Documents


Your All-in-One AI-Powered Toolkit for Academic Success.
+13062052269
info@desklib.com
Available 24*7 on WhatsApp / Email
![[object Object]](/_next/static/media/star-bottom.7253800d.svg)
Unlock your academic potential
Copyright © 2020–2026 A2Z Services. All Rights Reserved. Developed and managed by ZUCOL.