Financial Performance Comparison: Apple Inc. vs Google (Alphabet)
VerifiedAdded on 2020/06/04
|25
|5695
|270
Report
AI Summary
This report provides a comprehensive financial analysis comparing the performance of Apple and Google. It examines key aspects of financial management, including profitability, liquidity, and solvency, through the use of ratio analysis. The study covers the period from 2013 to 2017, utilizing financial statements to evaluate trends in net profit margin, return on capital employed, current ratio, quick ratio, and debt-equity ratio. The report also investigates the stock market performance of both companies and assesses elements contributing to the long-term viability of manufacturing. The analysis includes graphical representations of financial ratios and interpretations of the data, offering insights into the strengths and weaknesses of each company's financial strategies. The conclusion summarizes the findings, and recommendations are provided to improve Apple's financial management practices. The report highlights the importance of both internal and external factors influencing share prices, such as economic conditions and investor sentiment, to provide a holistic view of financial performance.

Comparison Apple vs Google from
financial management
financial management
Paraphrase This Document
Need a fresh take? Get an instant paraphrase of this document with our AI Paraphraser
TABLE OF CONTENTS
Overview of the study..................................................................................................................1
Aim and objectives of the study..................................................................................................1
Literature review..........................................................................................................................1
Research methodology.................................................................................................................3
1. Comparing financial performance and position of Apple in against to rival firm Google......4
2. Stock market performance.....................................................................................................13
3. Assessing elements that help in assessing long-term viability of manufacturing.................15
CONCLUSION..............................................................................................................................17
RECOMMENDATIONS...............................................................................................................17
REFERENCES..............................................................................................................................19
APPENDIX....................................................................................................................................21
1. Share price evaluation of Apple v/s Google..........................................................................21
Figure 1: NP ratio............................................................................................................................5
Figure 2: Retrurn of Capital Employed Apple V/s Google.............................................................5
Figure 3: Current ratio.....................................................................................................................7
Figure 4: Quick ratio........................................................................................................................7
Figure 5: Debt-equity ratio..............................................................................................................9
Figure 6: Fixed assets turnover ratio.............................................................................................10
Figure 7: Total assets turnover ratio..............................................................................................10
Figure 8: Inventory turnover ratio.................................................................................................11
Figure 9: EPS Apple v/s Google....................................................................................................12
Figure 10: DPS of Apple...............................................................................................................13
Figure 11: Stock performance Apple v/s Google..........................................................................14
Overview of the study
Financial analysis is the process that assists company in analyzing whether its monetary
position and performance is good or not. In the recent times, firms lay high level of emphasis on
measuring or evaluating their performance over the years and in comparison to the rival firm.
This in turn gives clear indication to the firm about the areas that require improvement and gives
input for the development of competent as well as strategic framework. The present report is
based on Apple, a leading American multinational technology company, which is involved in
designing and selling electronic and computer related products or services. In this, report will
highlight the extent to which financial aspects or management of Apple is sound as compared to
Google. With the motive to present fair view of study and evaluation Google, another leading
firm of America which is engaged in offering internet related services, has been selected. Along
with this, report also depicts the manner in which returns associated with the stock of Apple and
Google were fluctuated over the time frame. Further, it also entails the aspects that assist in
evaluating long-term viability of manufacturing.
Aim and objectives of the study
Aim of the present study is to analyze or evaluate financial management practices of
Apple over its rival firm Google. On the basis of such aim following objectives have drafted
such as:
To analyze financial position of Apple over the years and in against to competitor
namely Google.
To evaluate stock returns of Apple over its competitor Google.
To ascertain elements that helps in assessing long term viability of manufacturing.
To recommend suitable ways that aid in effective financial management of Apple.
Literature review
Theme 1: Ratio analysis and evaluation of firm’s financial performance
According to the views of Sujan and et.al., (2017), ratio analysis may be served tool that
helps in summarizing financial statements and gives quick as well clear indication in several key
areas. Hence, by undertaking the tool of ratio analysis firm can assess profit margin generated
over the years and in against to competitors. Hence, by analyzing profitability through the means
⊘ This is a preview!⊘
Do you want full access?
Subscribe today to unlock all pages.
Trusted by 1+ million students worldwide
of ratio analysis firm can develop effective strategic framework. However, on the critical note,
Maynard (2017) said that ratio analysis technique presents financial performance on the basis of
past data set, whereas management is concerned about future aspects. Thus, such technique does
not reflect current condition or position and thereby impacts future planning’s. Further, Rehman
and et.al., (2015) mentioned in their study that ratio analysis tool furnishes information about the
level to which liquidity and solvency position of the concerned firm is sound. Thus, outcome and
evaluation of ratio analysis aid in decision making aspects to a great extent. This in turn gives
clear indication to the firm about the sources of finance that it needs to undertake for building
and maintaining suitable financial structure. On the contradictory note, Kou, Peng and Wang
(2014) mentioned that lack of standard pertaining to making comparison of performance is
recognized as one of the major limitations.
Further, Jordan (2014) identified that through performing ratio analysis business unit can
assess its position over the rival firm. Besides this, it also assists firm in identifying strategic
action or measure that it needs to undertake for gaining competitive edge over others. However,
it is to be critically evaluated by Ibn-Homaid and Tijani (2015), who said that, irrespective of
having IASB and IFRS different business units undertake varied accounting policies. In such
case, it is not possible for the firm to evaluate or compare its position over rivals in the best
possible way. Vogel (2014) depicted in their study that by comparing cost, sales, profit margin
and other numeric figures via ratio analysis technique firm can measure its operational efficiency
aspect. Thus, by using tool firm can make appropriate forecast regarding future business
activities in numeric terms. Considering such assessment it can be said that ratio analysis is the
most effectual tools that help in evaluating performance and aid in appropriate decision making.
Theme 2: Factors that have an influence on share price
Mantzari and et.al., (2015) stated that attainment of high margin from fund invested is
one of the main motives of investors. Thus, before investing money concerned or potential
shareholders make evaluation of firm’s performance to analyze return. There are several internal
and external factors that influences share prices of firm. As per Wahlen, Baginski and Bradshaw
(2014) internal factors such as company’s new and performance has significant impact on share
price. In the study, they mentioned that news release on earnings and profit has greater impact on
share price. Along with this, announcements related to dividends, anticipated takeover and
Paraphrase This Document
Need a fresh take? Get an instant paraphrase of this document with our AI Paraphraser
merger, employee layoffs, anticipated errors etc have significant influence on stock price. On the
other side, Jenter and Kanaan (2015) argued that along with internal there are some external
factors which in turn affects share price. In this regard, external factors include investors
sentiment also has influence on stock value. In other words, sentiments or confidence of
investors in relation to increasing or decreasing price level has high level of impact on stock
performance. Zhang and Pan (2015) claimed that movement take place in exchange rates, gold
prices & bond having an impact on the prices of stock. Along with this, economic conditions and
stock prices are significantly associated with each other. On the basis of such aspect, when
economic conditions are good then investors feel high level of confidence. The rationale behind
this, at the time of good economic outlook, companies perform well, earn high margin and offers
dividend to shareholders with increasing rate (North and Stevens, 2015). Thus, both internal and
external factors have high level of impact on share prices of the firm traded on stock exchange.
Research methodology
Research type: Specifically, there are mainly two research types that can be undertaken
for evaluating issue. In this, quantitative research type has been selected for analyzing
financial position of Apple over Google. Besides this, stock performance evaluation of
both the concerned companies is based on quantitative data set. Considering all such
aspects, quantitative research technique has been selected.
Data collection: In order to assess financial position and performance of Apple in against
to Google monetary data has been gathered from the financial statements of the
concerned firms for five years period. Hence, by evaluating final accounts of Apple and
Google pertaining to period 2013 to 2017 data regarding profitability, liquidity and
solvency aspect has been gathered. Along with this, books, journals and scholarly articles
related to ratio as well as stock return analysis has also been evaluated to gain
understanding about the issue investigated.
Data analysis: For analyzing gathered data set in the best possible way and meeting
research objectives ratio analysis tool has been applied by scholar. Hence, through the
means of ratios, extent to which profitability, liquidity and solvency position of Apple in
against to Google has evaluated.
1. Comparing financial performance and position of Apple in against to rival firm Google
Ratio analysis is the most effectual financial tool that assists in evaluating performance of
firm under different categories such as profitability, liquidity, solvency, efficiency and
investment.
Ratio analysis of Apple v/s Google from 2013 to 2017 is as follows:
Profitability ratio analysis
Apple Google
Form
ula 2013 2014 2015 2016 2017
201
3 2014 2015 2016 2017
Profitability
ratios
Gross profit
64,3
04
70,5
37
93,6
26
84,2
63
88,1
86
33,9
67
40,3
10
46,8
25
55,1
34
Net profit
37,0
37
39,5
10
53,3
94
45,6
87
48,3
51
12,9
20
14,4
44
16,3
48
19,4
78
1568
2
Sales
revenue
170,
910
182,
795
233,
715
215,
639
229,
234
59,8
25
66,0
01
74,9
89
90,2
72
7853
2
Shareholder'
s equity
123,
549
111,
547
119,
355
128,
249
134,
047
87,3
09
104,
500
120,
331
139,
036
1571
00
NP ratio
21.7
%
21.6
%
22.8
%
21.2
%
21.1
%
21.6
%
21.9
%
21.8
%
21.6
% 20%
ROCE
29.9
8%
35.4
2%
44.7
4%
35.6
2%
36.0
7%
14.8
0%
13.8
2%
13.5
9%
14.0
1%
9.98
%
⊘ This is a preview!⊘
Do you want full access?
Subscribe today to unlock all pages.
Trusted by 1+ million students worldwide
2013 2014 2015 2016 2017 2013 2014 2015 2016 2017
Apple Google
18.50%
19.00%
19.50%
20.00%
20.50%
21.00%
21.50%
22.00%
22.50%
23.00%
NP ratio
NP ratio
Figure 1: NP ratio
2013 2014 2015 2016 2017 2013 2014 2015 2016 2017
Apple Google
0.00%
5.00%
10.00%
15.00%
20.00%
25.00%
30.00%
35.00%
40.00%
45.00%
ROCE
ROCE
Figure 2: Retrurn of Capital Employed Apple V/s Google
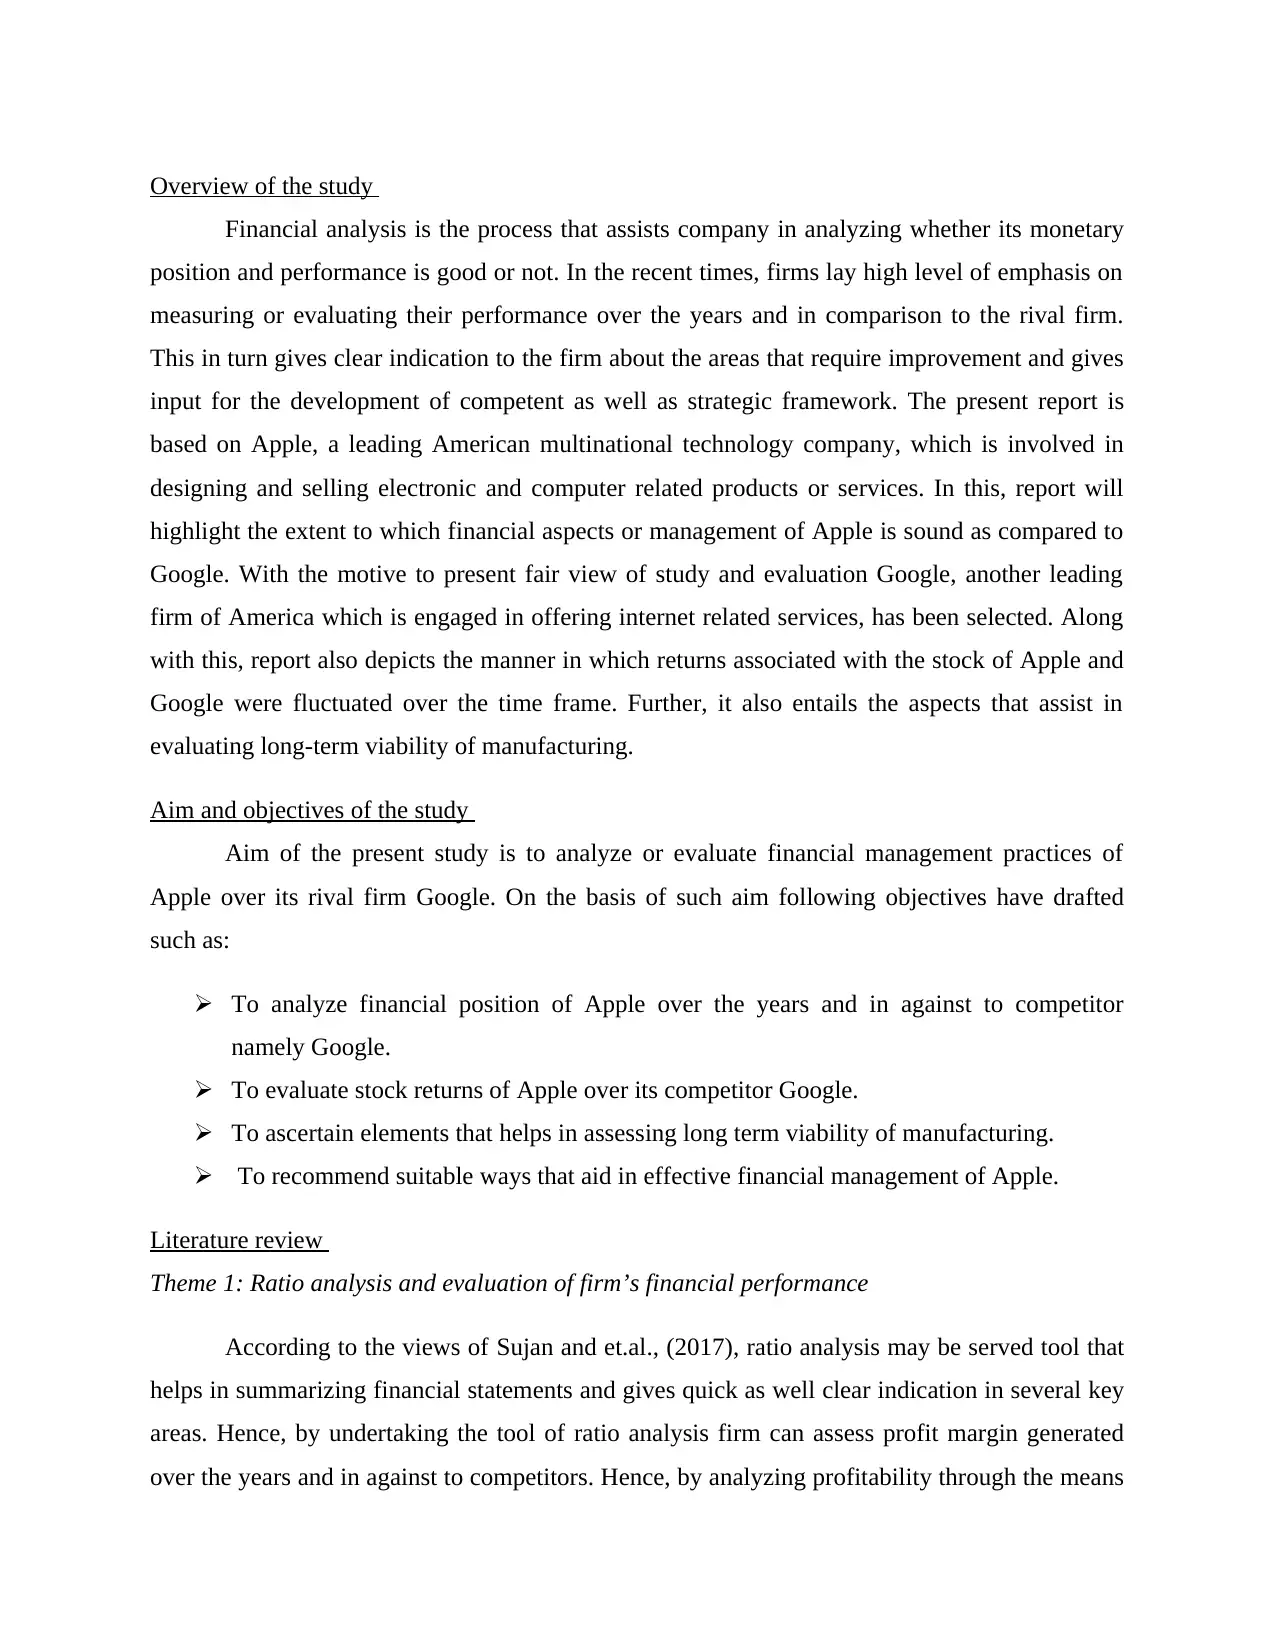
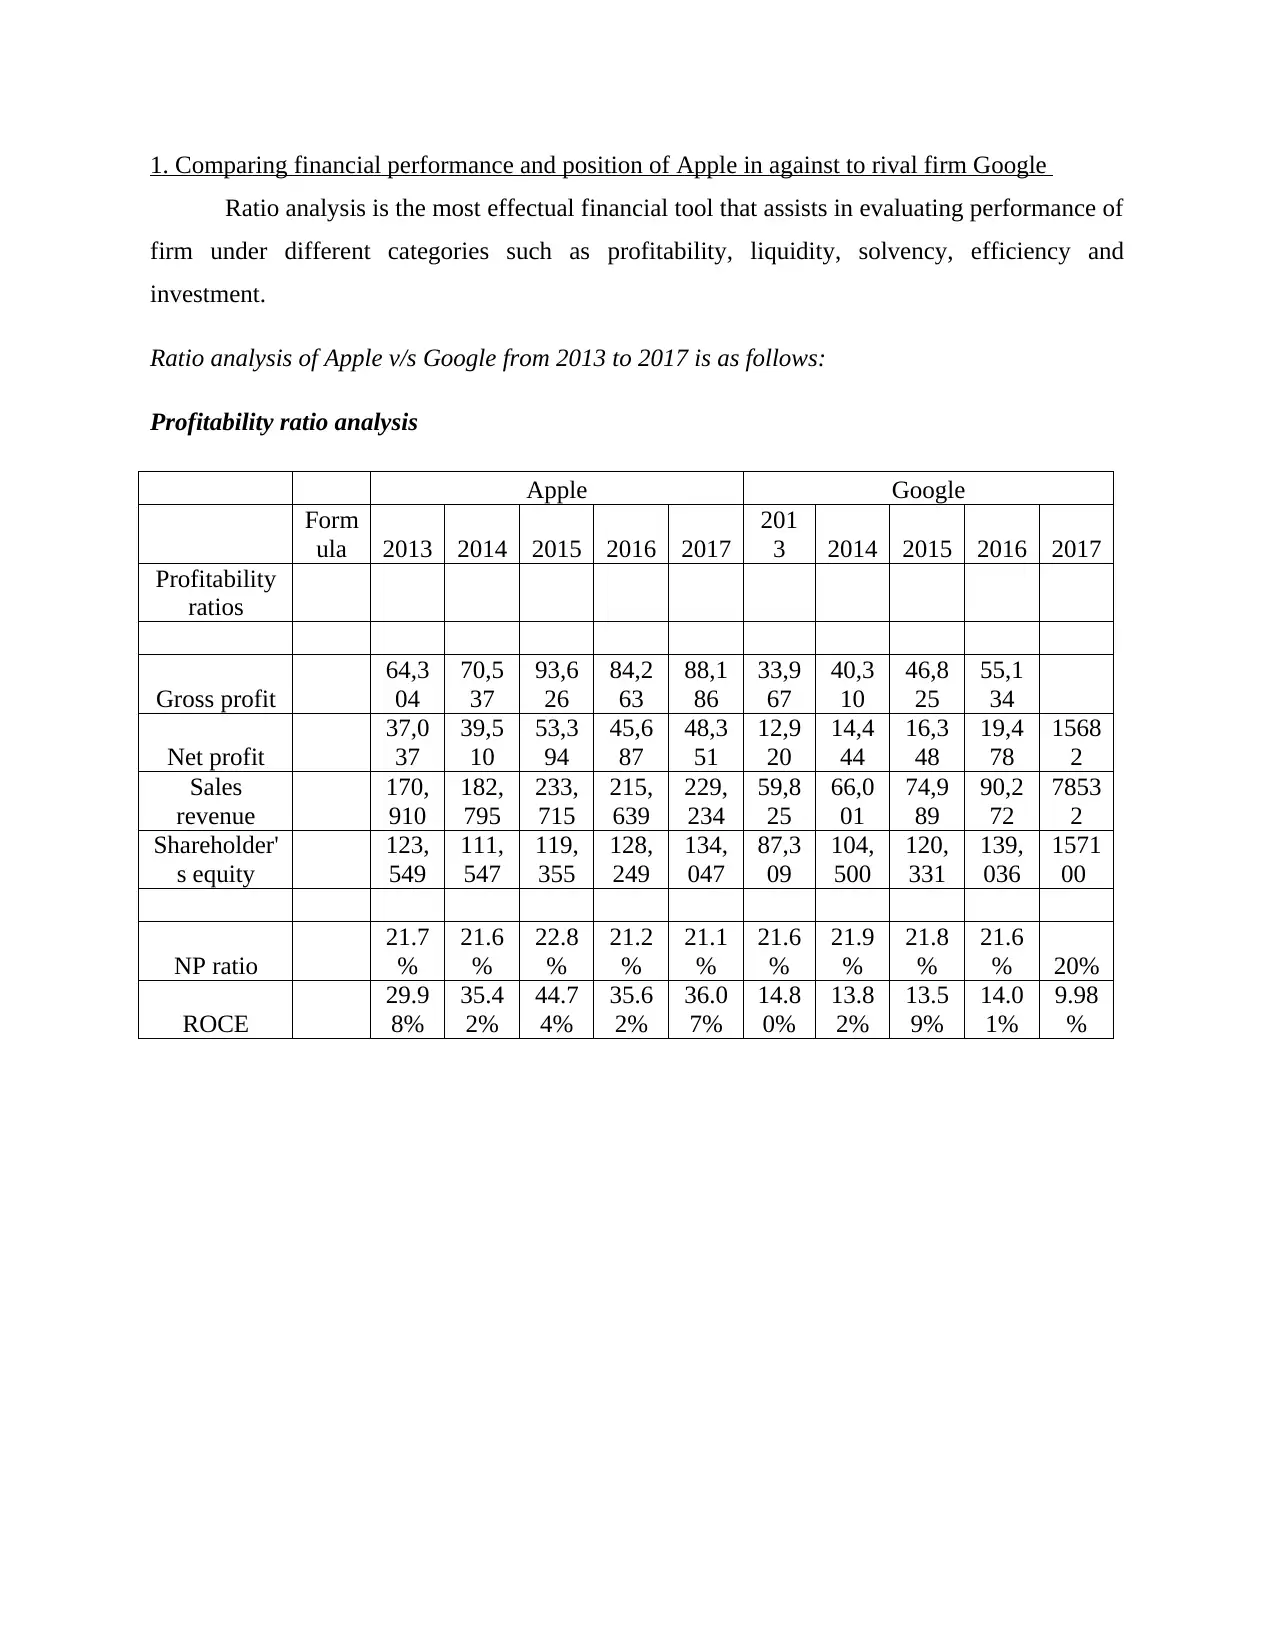
Interpretation: Tabular presentation shows that NP margin of Apple was not improved
over the time frame. In the context of five years period, such ratio of Apple was 21%
respectively. In 2017, irrespective of increased sales revenue from 215639 to 229234 net margin
of the firm was declined. In this regard, high level of indirect expenses recognized as main cause
due to which margin decreased. On the other side, net profit margin of Google was decreased
from 21% to 20% in the year of 2017. In the accounting year, due to the decline in revenue
Apple Google
18.50%
19.00%
19.50%
20.00%
20.50%
21.00%
21.50%
22.00%
22.50%
23.00%
NP ratio
NP ratio
Figure 1: NP ratio
2013 2014 2015 2016 2017 2013 2014 2015 2016 2017
Apple Google
0.00%
5.00%
10.00%
15.00%
20.00%
25.00%
30.00%
35.00%
40.00%
45.00%
ROCE
ROCE
Figure 2: Retrurn of Capital Employed Apple V/s Google
Interpretation: Tabular presentation shows that NP margin of Apple was not improved
over the time frame. In the context of five years period, such ratio of Apple was 21%
respectively. In 2017, irrespective of increased sales revenue from 215639 to 229234 net margin
of the firm was declined. In this regard, high level of indirect expenses recognized as main cause
due to which margin decreased. On the other side, net profit margin of Google was decreased
from 21% to 20% in the year of 2017. In the accounting year, due to the decline in revenue
Paraphrase This Document
Need a fresh take? Get an instant paraphrase of this document with our AI Paraphraser
business unit failed to generate enough margin. Hence, considering overall evaluation it can be
presented that profitability position or aspects of Apple is good over Google.
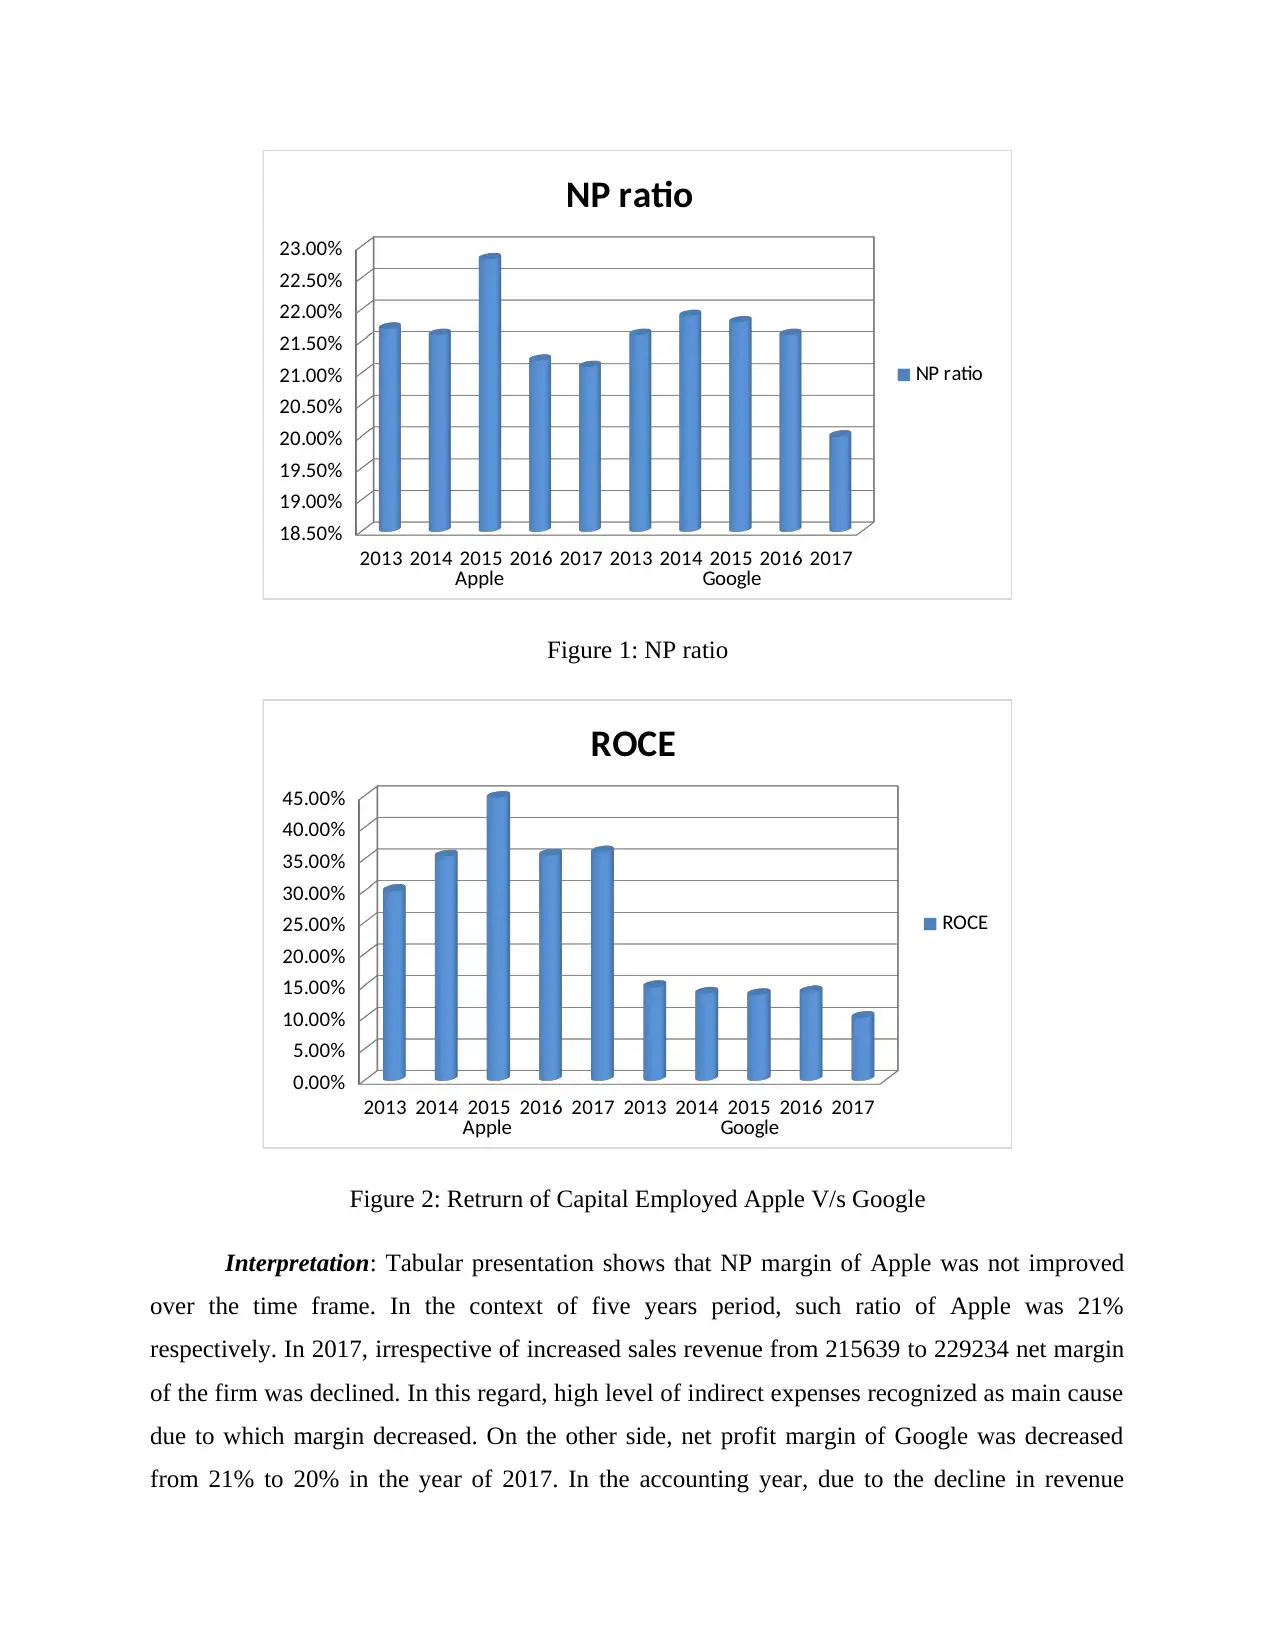
From ratio analysis, it has found that ROCE of Apple was increased from 29.98% to
36.07% during concerned financial years. Increasing trend of ROCE presents that company has
made effectual use of shareholder’s equity. It also indicates that strategic and policy framework
undertaken by Apple is prominent. In contrast to this, declining trend has assessed in the ROCE
of Google. In 2017, ROCE of Google declined from 14.80% to 9.98% significantly that is not
good. Moreover, decreasing return implies for company’s inefficiency in relation to making use
of funds invested by shareholders while carry out business activities and functions.
Liquidity ratio analysis
Apple Google
Formula
201
3
201
4
201
5
201
6
201
7
201
3
201
4
201
5
201
6
201
7
Current
assets
73,
286
68,
531
89,
378
106,
869
128,
645
72,
886
80,
685
90,
114
105,
408
119
345
Inventory
1,7
64
2,1
11
2,3
49
2,13
2
4,85
5 426 268 765
Prepaid
expenses
2,8
27
3,4
12
3,1
39
4,57
5
Current
liabilities
43,
658
63,
448
80,
610
79,0
06
100,
814
15,
908
16,
805
19,
310
16,7
56
206
93
Current
ratio
Current assets /
current liabilities
1.6
8
1.0
8
1.1
1 1.35 1.28
4.5
8
4.8
0
4.6
7 6.29
5.7
7
Quick
ratio
Quick assets /
current liabilities
1.6
4
1.0
5
1.0
8 1.33 1.23
4.3
8
4.8
0
4.5
0 6.00
5.7
3
presented that profitability position or aspects of Apple is good over Google.
From ratio analysis, it has found that ROCE of Apple was increased from 29.98% to
36.07% during concerned financial years. Increasing trend of ROCE presents that company has
made effectual use of shareholder’s equity. It also indicates that strategic and policy framework
undertaken by Apple is prominent. In contrast to this, declining trend has assessed in the ROCE
of Google. In 2017, ROCE of Google declined from 14.80% to 9.98% significantly that is not
good. Moreover, decreasing return implies for company’s inefficiency in relation to making use
of funds invested by shareholders while carry out business activities and functions.
Liquidity ratio analysis
Apple Google
Formula
201
3
201
4
201
5
201
6
201
7
201
3
201
4
201
5
201
6
201
7
Current
assets
73,
286
68,
531
89,
378
106,
869
128,
645
72,
886
80,
685
90,
114
105,
408
119
345
Inventory
1,7
64
2,1
11
2,3
49
2,13
2
4,85
5 426 268 765
Prepaid
expenses
2,8
27
3,4
12
3,1
39
4,57
5
Current
liabilities
43,
658
63,
448
80,
610
79,0
06
100,
814
15,
908
16,
805
19,
310
16,7
56
206
93
Current
ratio
Current assets /
current liabilities
1.6
8
1.0
8
1.1
1 1.35 1.28
4.5
8
4.8
0
4.6
7 6.29
5.7
7
Quick
ratio
Quick assets /
current liabilities
1.6
4
1.0
5
1.0
8 1.33 1.23
4.3
8
4.8
0
4.5
0 6.00
5.7
3
2013 2014 2015 2016 2017 2013 2014 2015 2016 2017
Apple Google
0
1
2
3
4
5
6
7
Current ratio
Current ratio
Figure 3: Current ratio
2013 2014 2015 2016 2017 2013 2014 2015 2016 2017
Apple Google
0
1
2
3
4
5
6
Quick ratio
Quick ratio
Figure 4: Quick ratio
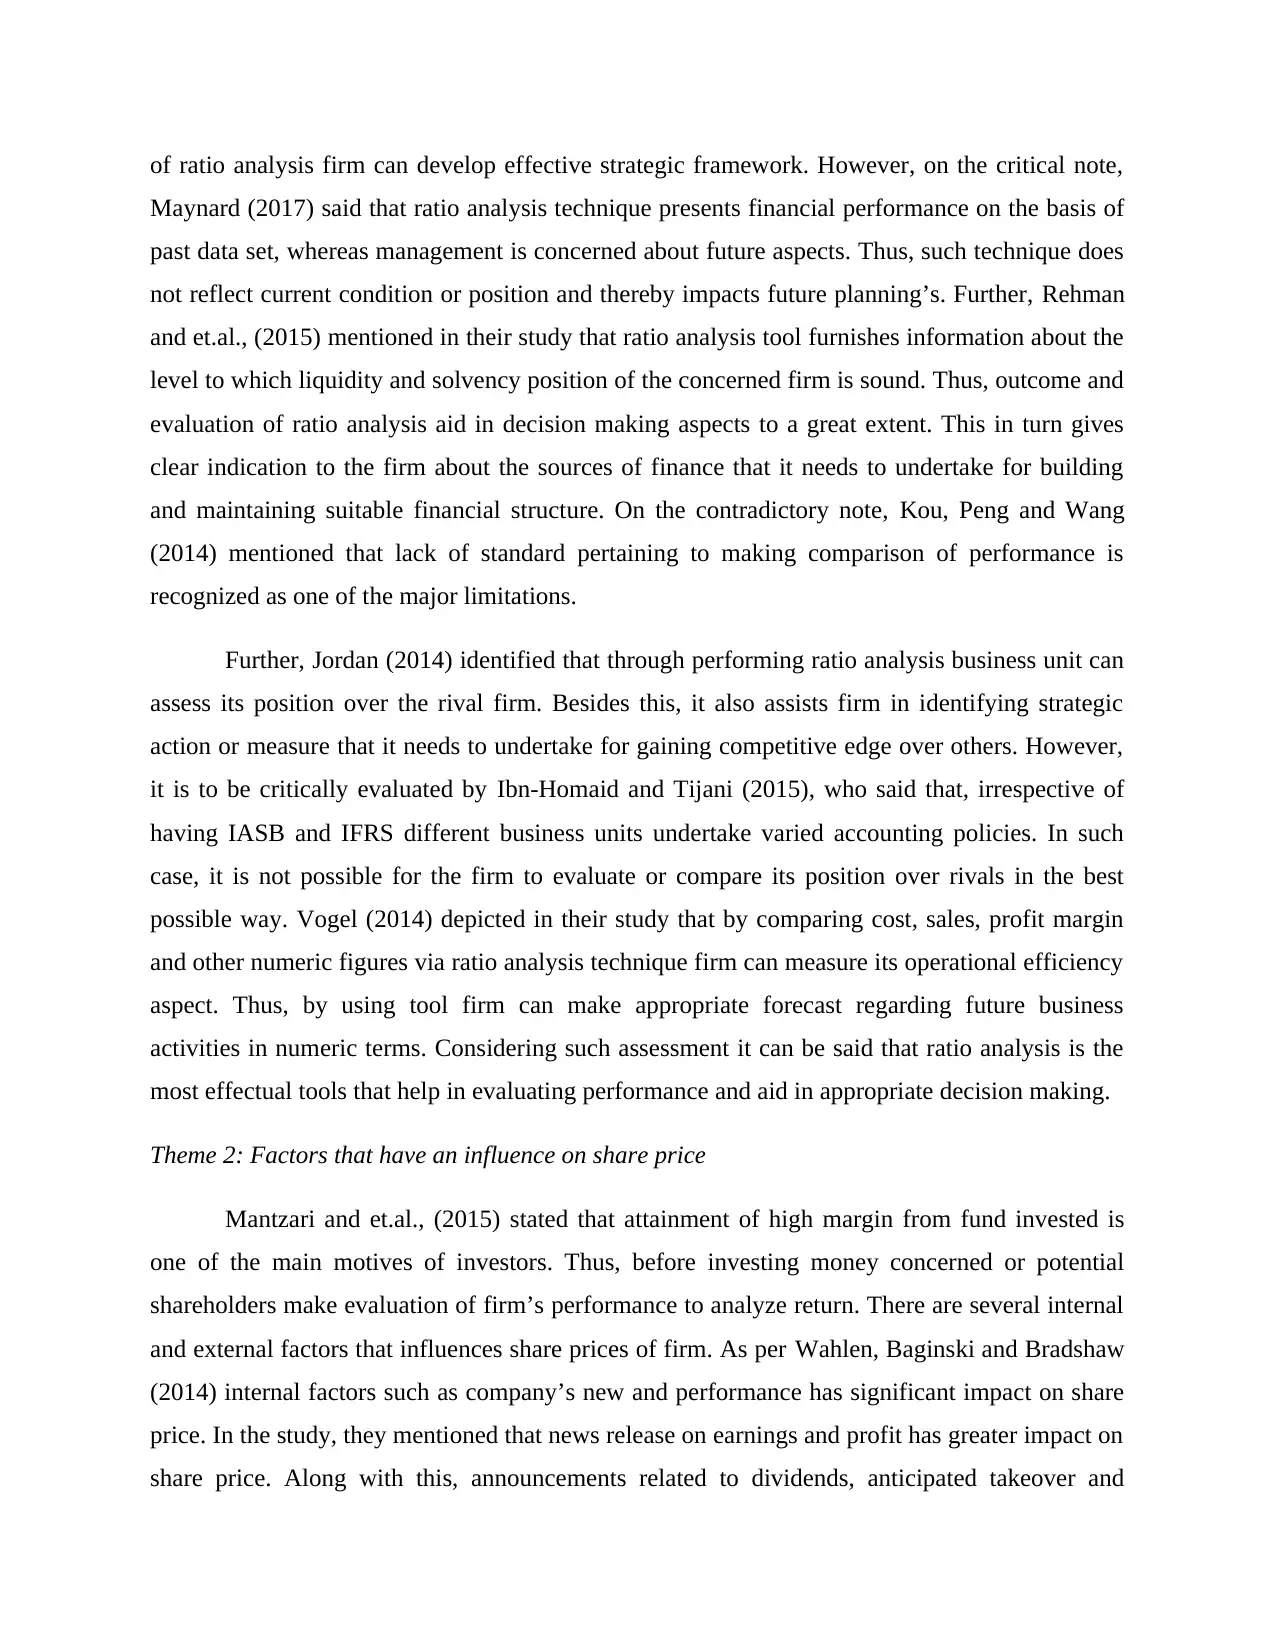
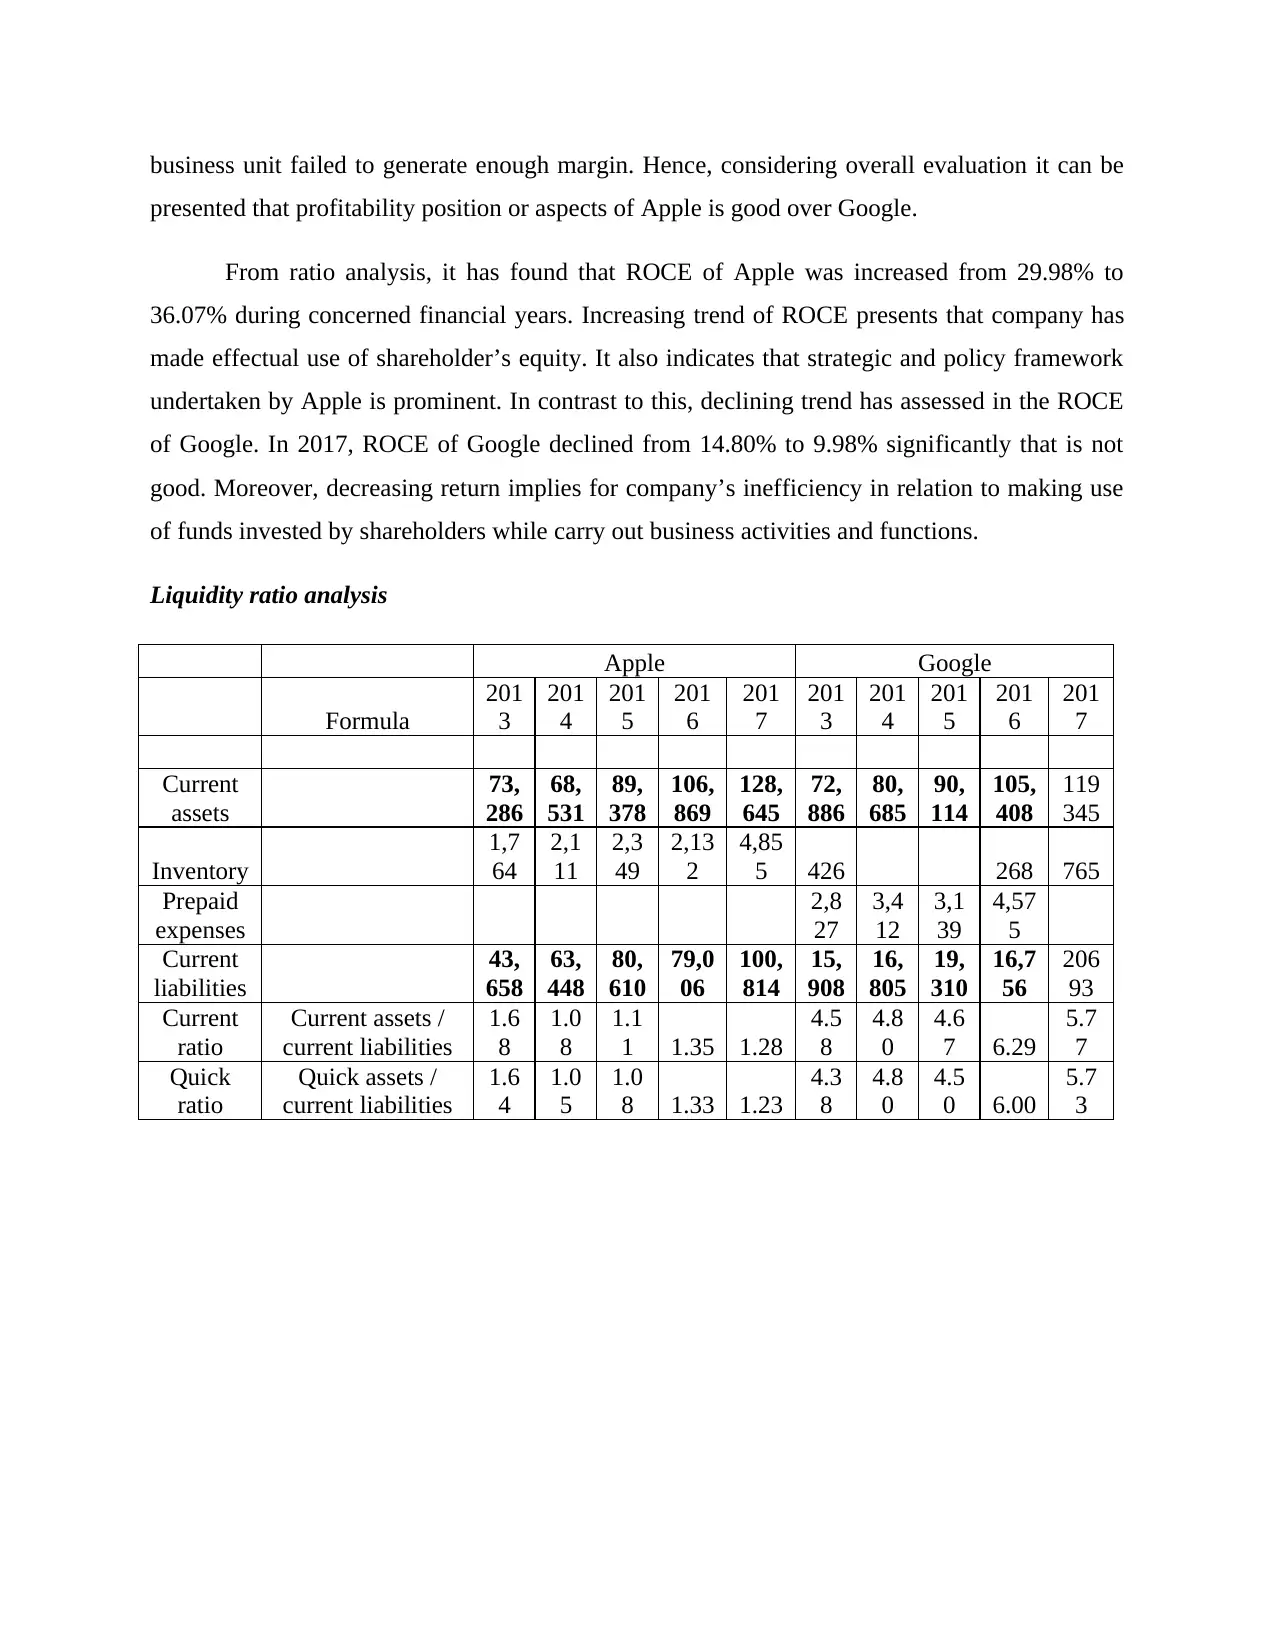
Interpretation: Graphical presentation exhibits fluctuating trend in the current ratio of
Apple. From 2014 to 2016, current ratio of Apple was increased but not with the higher rate or
significantly. Further, in 2017, current ratio of fallen down from 1.35 to 1.28 who is not
considered as good over ideal such as 2:1. Along with this, current ratio of Google was also
fluctuated from 2013 to 2017. At the end of 2017, current ratio accounted for 5.77:1 that was
greater than ideal measure. From assessment, it has found neither higher nor lower liquidity is
Apple Google
0
1
2
3
4
5
6
7
Current ratio
Current ratio
Figure 3: Current ratio
2013 2014 2015 2016 2017 2013 2014 2015 2016 2017
Apple Google
0
1
2
3
4
5
6
Quick ratio
Quick ratio
Figure 4: Quick ratio
Interpretation: Graphical presentation exhibits fluctuating trend in the current ratio of
Apple. From 2014 to 2016, current ratio of Apple was increased but not with the higher rate or
significantly. Further, in 2017, current ratio of fallen down from 1.35 to 1.28 who is not
considered as good over ideal such as 2:1. Along with this, current ratio of Google was also
fluctuated from 2013 to 2017. At the end of 2017, current ratio accounted for 5.77:1 that was
greater than ideal measure. From assessment, it has found neither higher nor lower liquidity is
⊘ This is a preview!⊘
Do you want full access?
Subscribe today to unlock all pages.
Trusted by 1+ million students worldwide
good for the business unit. Moreover, maintenance of higher liquidity closely impacts
profitability and monetary position of the firm. However, overall Google was highly capable in
relation to meeting its obligations from current assets rather than Apple.
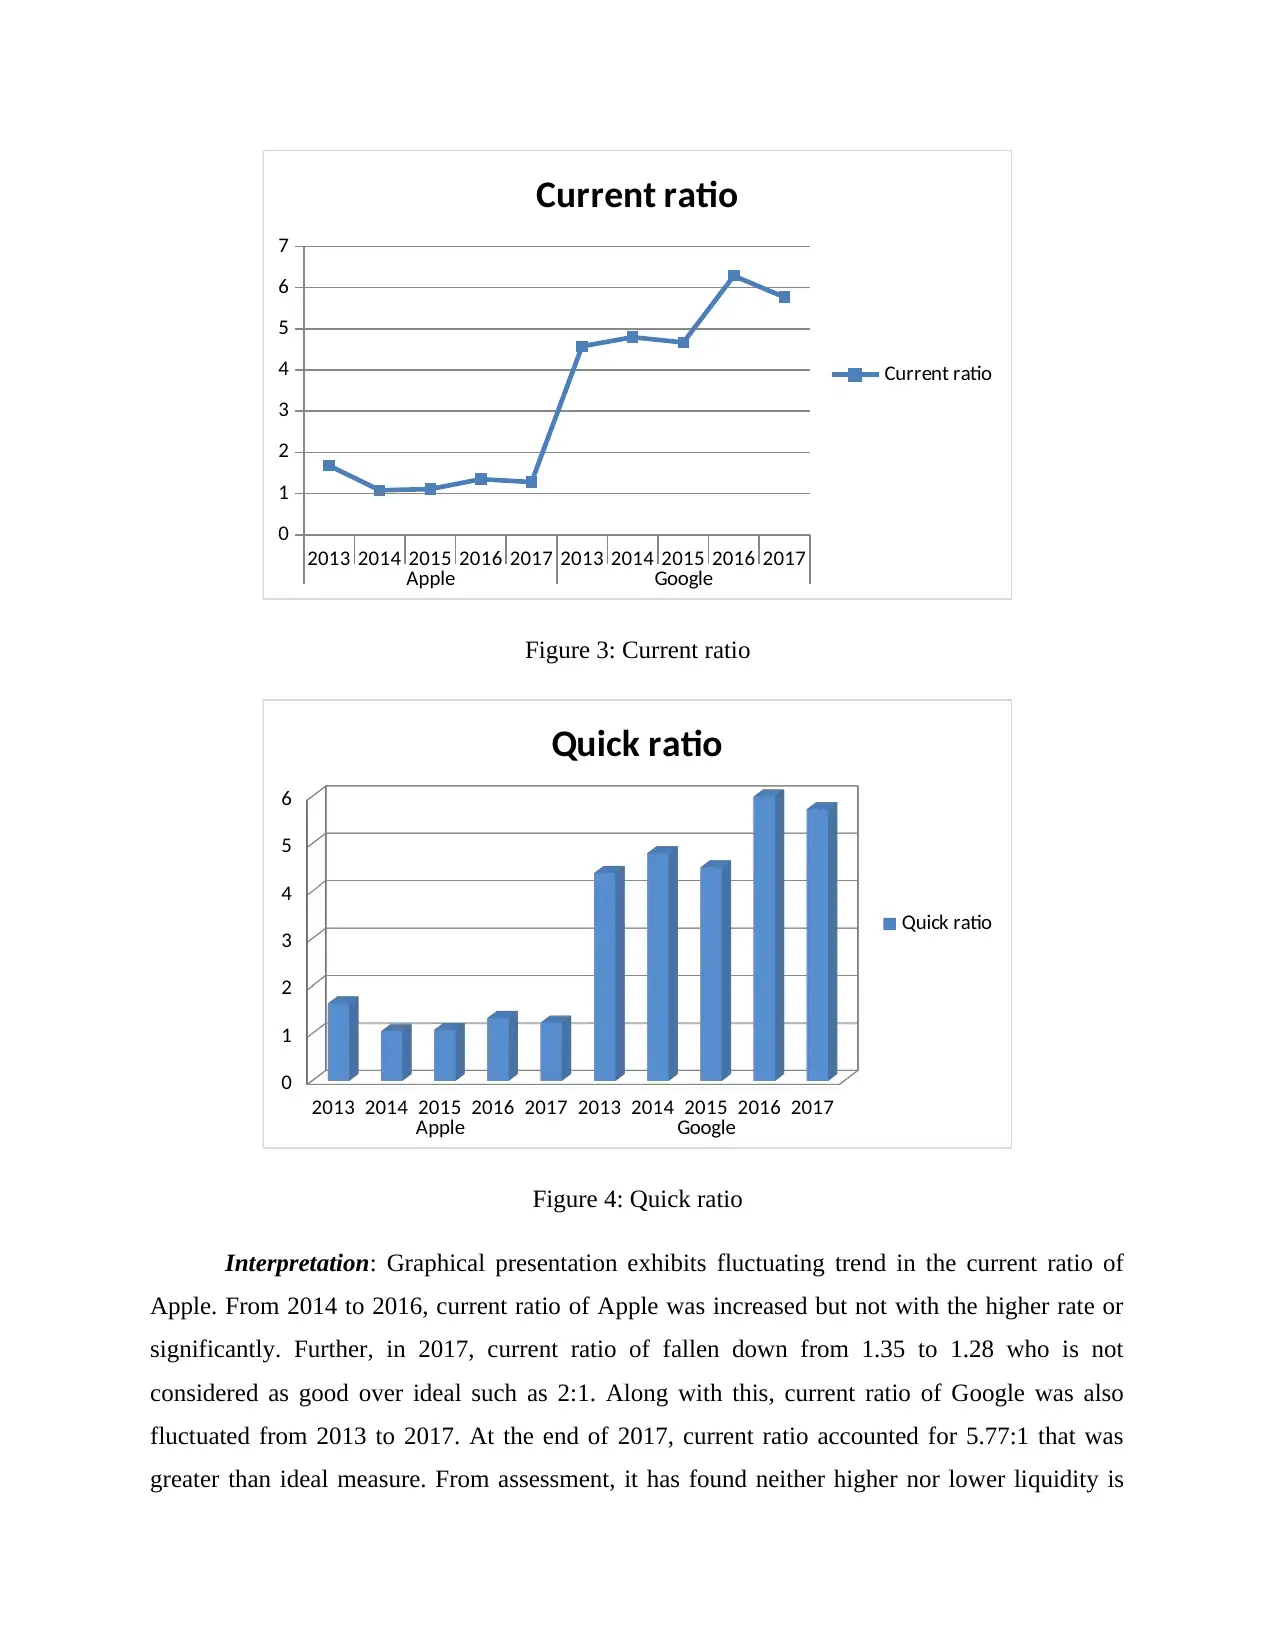
Quick ratio of Apple and Google pertaining to year 2017 implied for 1.23:1 and 5.73:1
respectively. Ideal standards or measure such as .5:1 presents that in against to 2 current debts,
business unit must have 1 quick asset that can be sold for cash generation. Ratio analysis result’s
from 2013 to 2017 period shows that both the firms have maintained enough quick assets for
fulfilling current obligations. However, as compared to standards Google has maintained enough
cash within the firm which in turn impacts overall monetary aspects. Moreover, company can
earn high margin by investing money in other profitable investment opportunities rather than
preserving with itself. Hence, it can be said that Apple’s policies pertaining to maintain liquidity
position is sound over Apple.
Solvency ratio analysis
Apple Google
Formula
201
3
201
4
201
5
201
6
201
7
20
13
201
4
201
5
201
6
201
7
Long
term
debt
16,
960
28,
987
53,
463
75,
427
97,
207
2,2
36
3,2
28
1,9
95
3,9
35
396
4
Sharehol
ders
123
,54
9
111
,54
7
119
,35
5
128
,24
9
134
,04
7
87,
30
9
104
,50
0
120
,33
1
139
,03
6
157
100
Debt-
equity
ratio
Long term debt /
shareholders equity
0.1
4
0.2
6
0.4
5
0.5
9
0.7
3
0.0
3
0.0
3
0.0
2
0.0
3
0.0
3
profitability and monetary position of the firm. However, overall Google was highly capable in
relation to meeting its obligations from current assets rather than Apple.
Quick ratio of Apple and Google pertaining to year 2017 implied for 1.23:1 and 5.73:1
respectively. Ideal standards or measure such as .5:1 presents that in against to 2 current debts,
business unit must have 1 quick asset that can be sold for cash generation. Ratio analysis result’s
from 2013 to 2017 period shows that both the firms have maintained enough quick assets for
fulfilling current obligations. However, as compared to standards Google has maintained enough
cash within the firm which in turn impacts overall monetary aspects. Moreover, company can
earn high margin by investing money in other profitable investment opportunities rather than
preserving with itself. Hence, it can be said that Apple’s policies pertaining to maintain liquidity
position is sound over Apple.
Solvency ratio analysis
Apple Google
Formula
201
3
201
4
201
5
201
6
201
7
20
13
201
4
201
5
201
6
201
7
Long
term
debt
16,
960
28,
987
53,
463
75,
427
97,
207
2,2
36
3,2
28
1,9
95
3,9
35
396
4
Sharehol
ders
123
,54
9
111
,54
7
119
,35
5
128
,24
9
134
,04
7
87,
30
9
104
,50
0
120
,33
1
139
,03
6
157
100
Debt-
equity
ratio
Long term debt /
shareholders equity
0.1
4
0.2
6
0.4
5
0.5
9
0.7
3
0.0
3
0.0
3
0.0
2
0.0
3
0.0
3
Paraphrase This Document
Need a fresh take? Get an instant paraphrase of this document with our AI Paraphraser
2013
2014
2015
2016
2017
2013
2014
2015
2016
2017
Apple Google
0
0.1
0.2
0.3
0.4
0.5
0.6
0.7
0.8
Debt-equity ratio
Debt-equity ratio
Figure 5: Debt-equity ratio
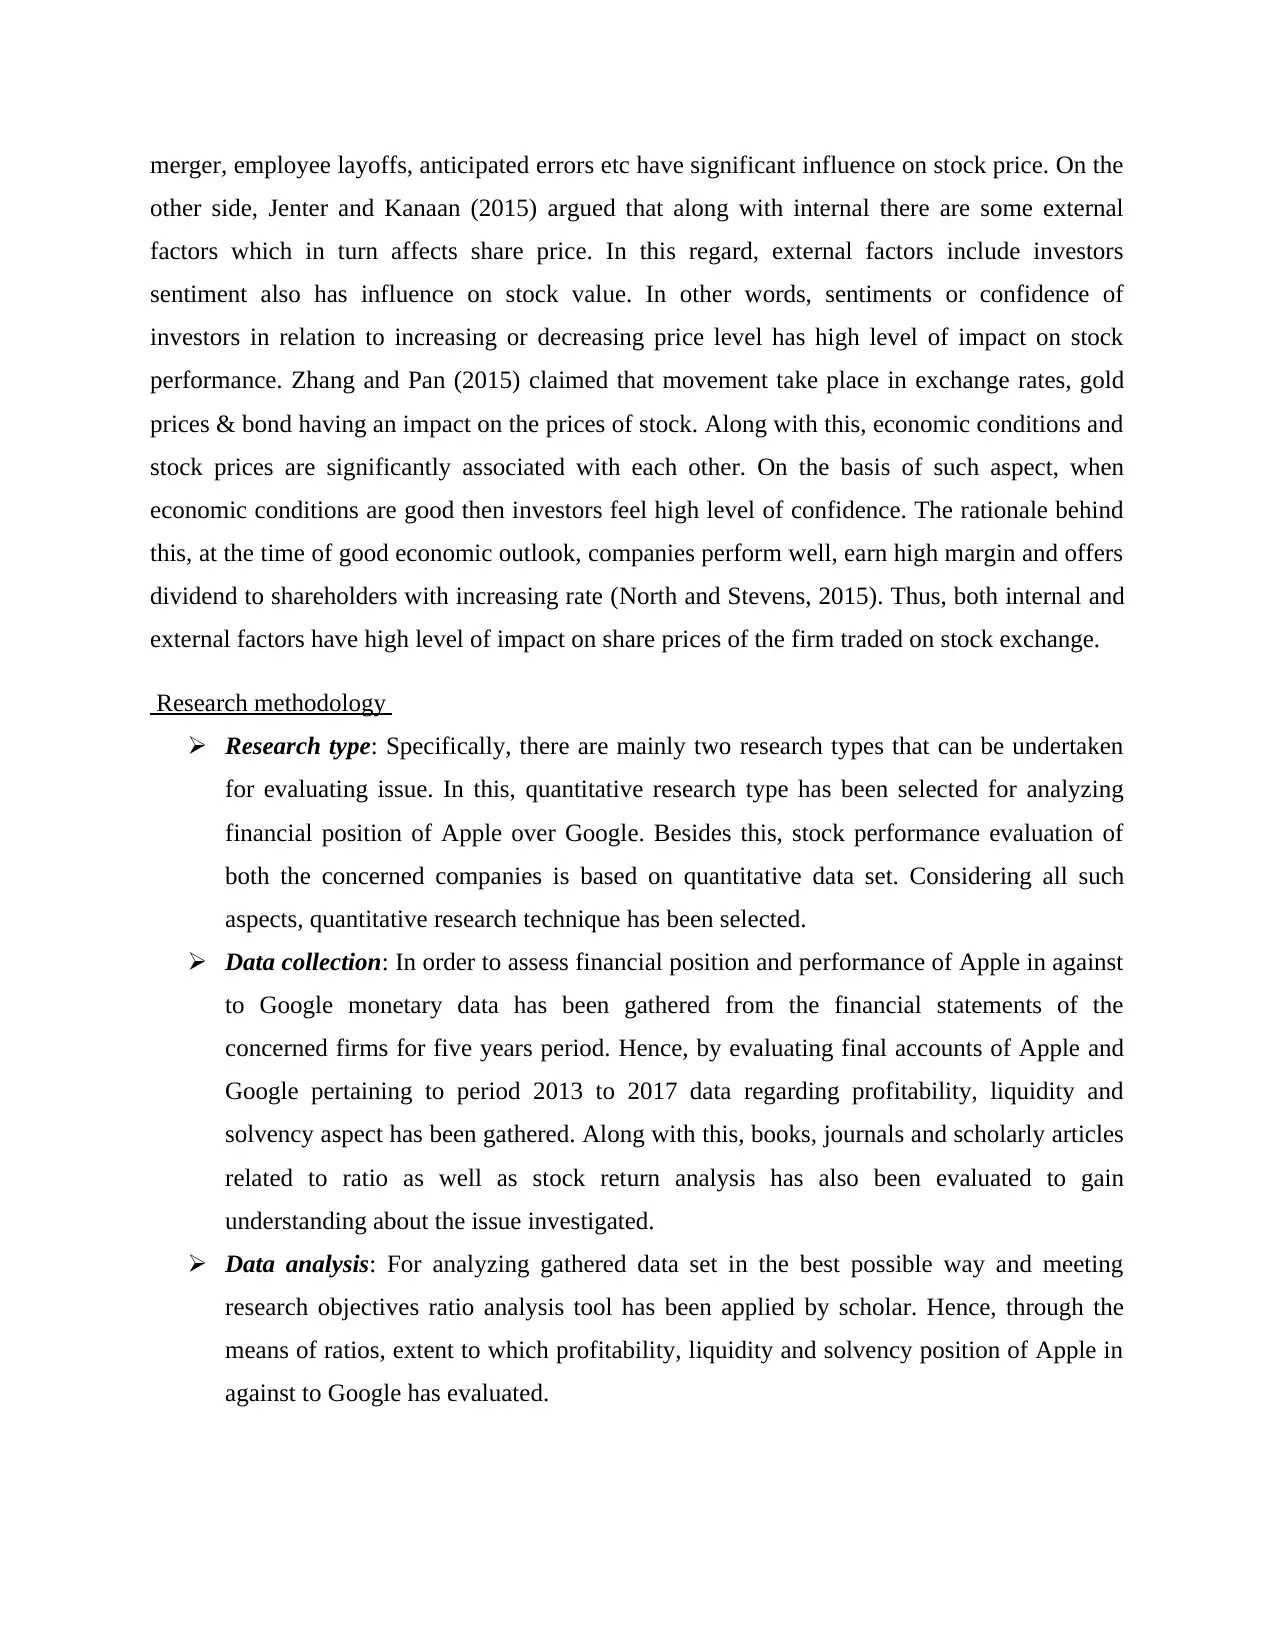
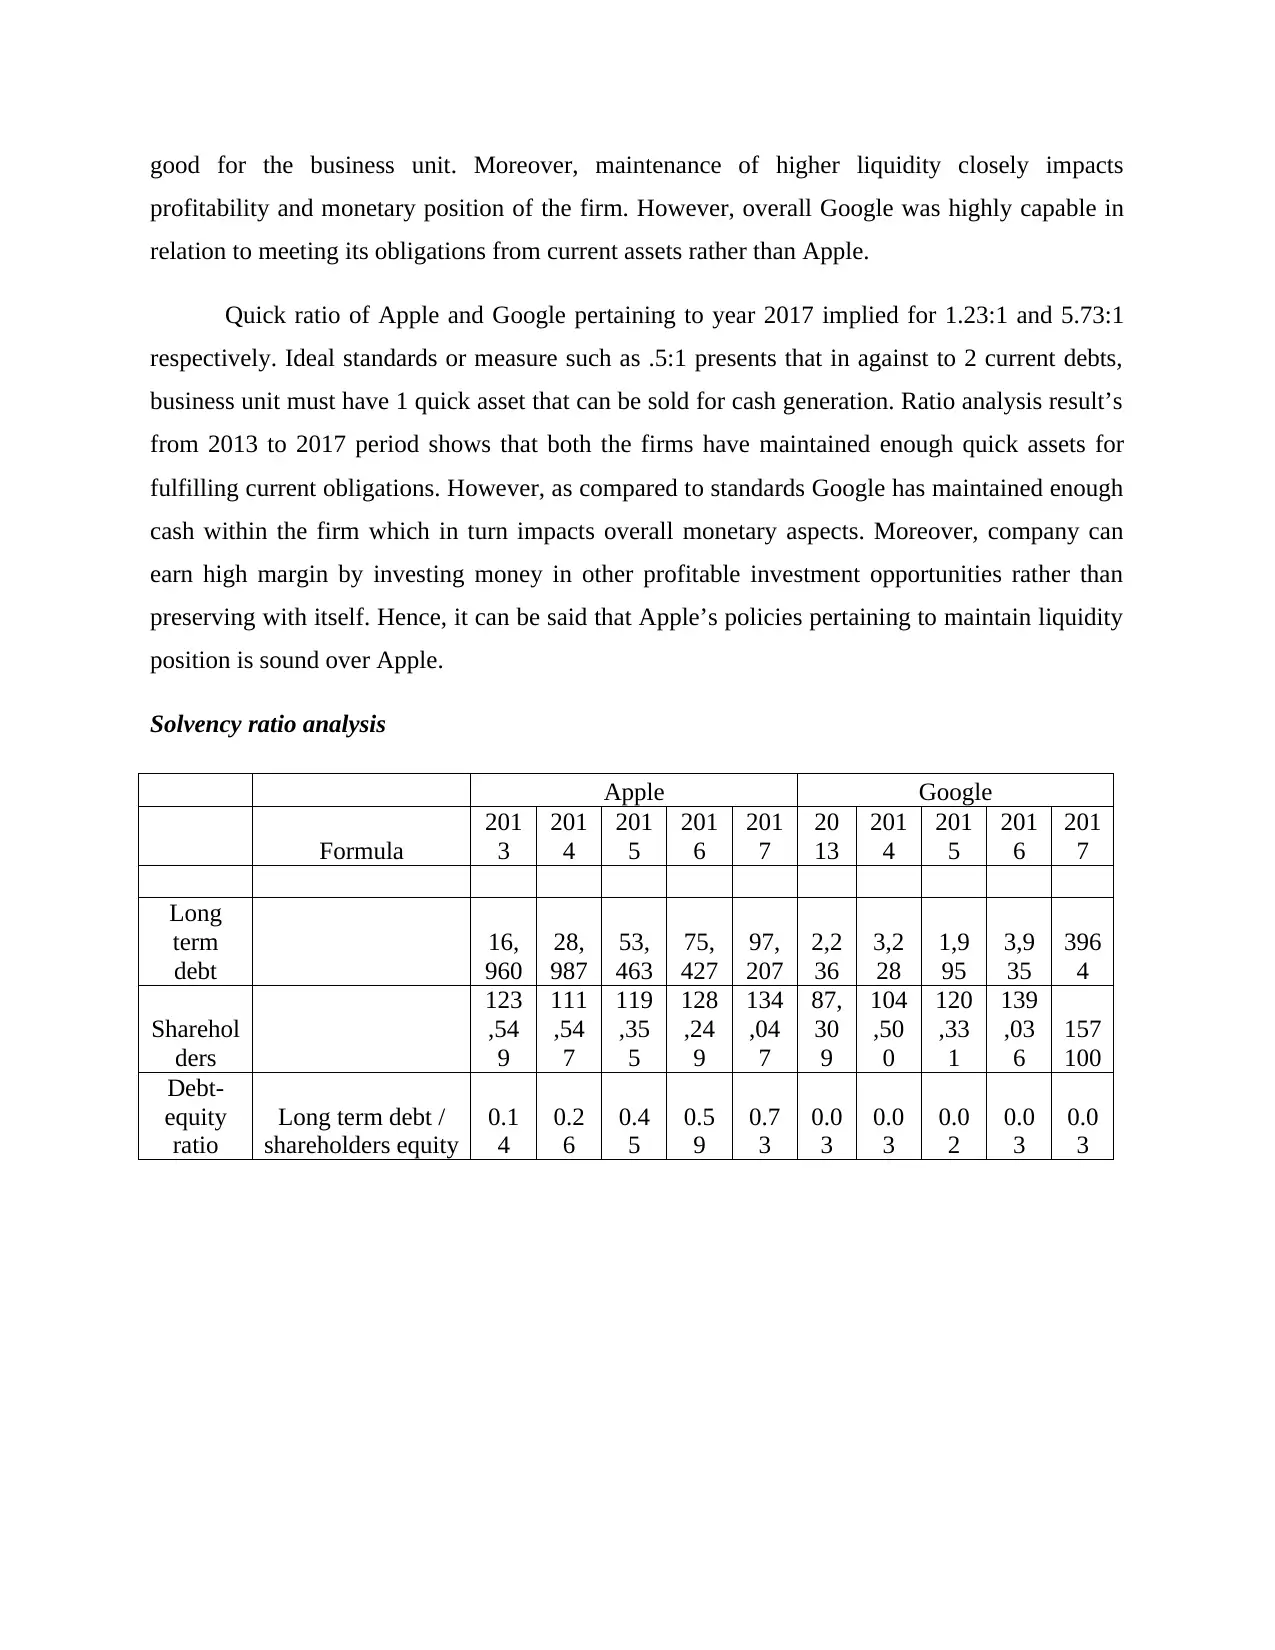
Interpretation: Outcome of ratio analysis shows that debt-equity ratio of Apple was
increase significantly over the time frame. In the year of 2013 debt-equity ratio of Apple
accounted for .14:1, whereas at the end of 2017 it reached on .73:1 which is a good indicator. On
the other side, within the period of five years from 2013 to 2017, such ratio was implied for
0.03:1. Hence, considering the results of such analysis it can be depicted that solvency position
of Apple is sound over Google. Moreover, Apple has maintained its solvency in line with the
ideal ratio such as .5:1. According to such ratio, there must be 2 equities in against to 1 which in
turn ensures optimal capital structure. This aspect clearly shows that financial structure of Apple
is good. On the other side, for reducing fixed obligations in terms of interest payment Google
laid more focus on raising funds through equity which in turn negatively influence capital
structure. Hence, at the time of raising funds firm should keep in mind ideal solvency or debt-
equity ratio.
Efficiency ratio analysis
Apple Google
Particulars Formula
20
13
20
14
20
15
20
16
20
17
20
13
20
14
20
15
201
6
20
17
Fixed assets
turnover ratio
Net sales /
Fixed assets
10.
67
9.8
2
10.
85
8.7
1
7.5
4
4.2
2
3.2
7
2.8
4 2.85
2.8
7
2014
2015
2016
2017
2013
2014
2015
2016
2017
Apple Google
0
0.1
0.2
0.3
0.4
0.5
0.6
0.7
0.8
Debt-equity ratio
Debt-equity ratio
Figure 5: Debt-equity ratio
Interpretation: Outcome of ratio analysis shows that debt-equity ratio of Apple was
increase significantly over the time frame. In the year of 2013 debt-equity ratio of Apple
accounted for .14:1, whereas at the end of 2017 it reached on .73:1 which is a good indicator. On
the other side, within the period of five years from 2013 to 2017, such ratio was implied for
0.03:1. Hence, considering the results of such analysis it can be depicted that solvency position
of Apple is sound over Google. Moreover, Apple has maintained its solvency in line with the
ideal ratio such as .5:1. According to such ratio, there must be 2 equities in against to 1 which in
turn ensures optimal capital structure. This aspect clearly shows that financial structure of Apple
is good. On the other side, for reducing fixed obligations in terms of interest payment Google
laid more focus on raising funds through equity which in turn negatively influence capital
structure. Hence, at the time of raising funds firm should keep in mind ideal solvency or debt-
equity ratio.
Efficiency ratio analysis
Apple Google
Particulars Formula
20
13
20
14
20
15
20
16
20
17
20
13
20
14
20
15
201
6
20
17
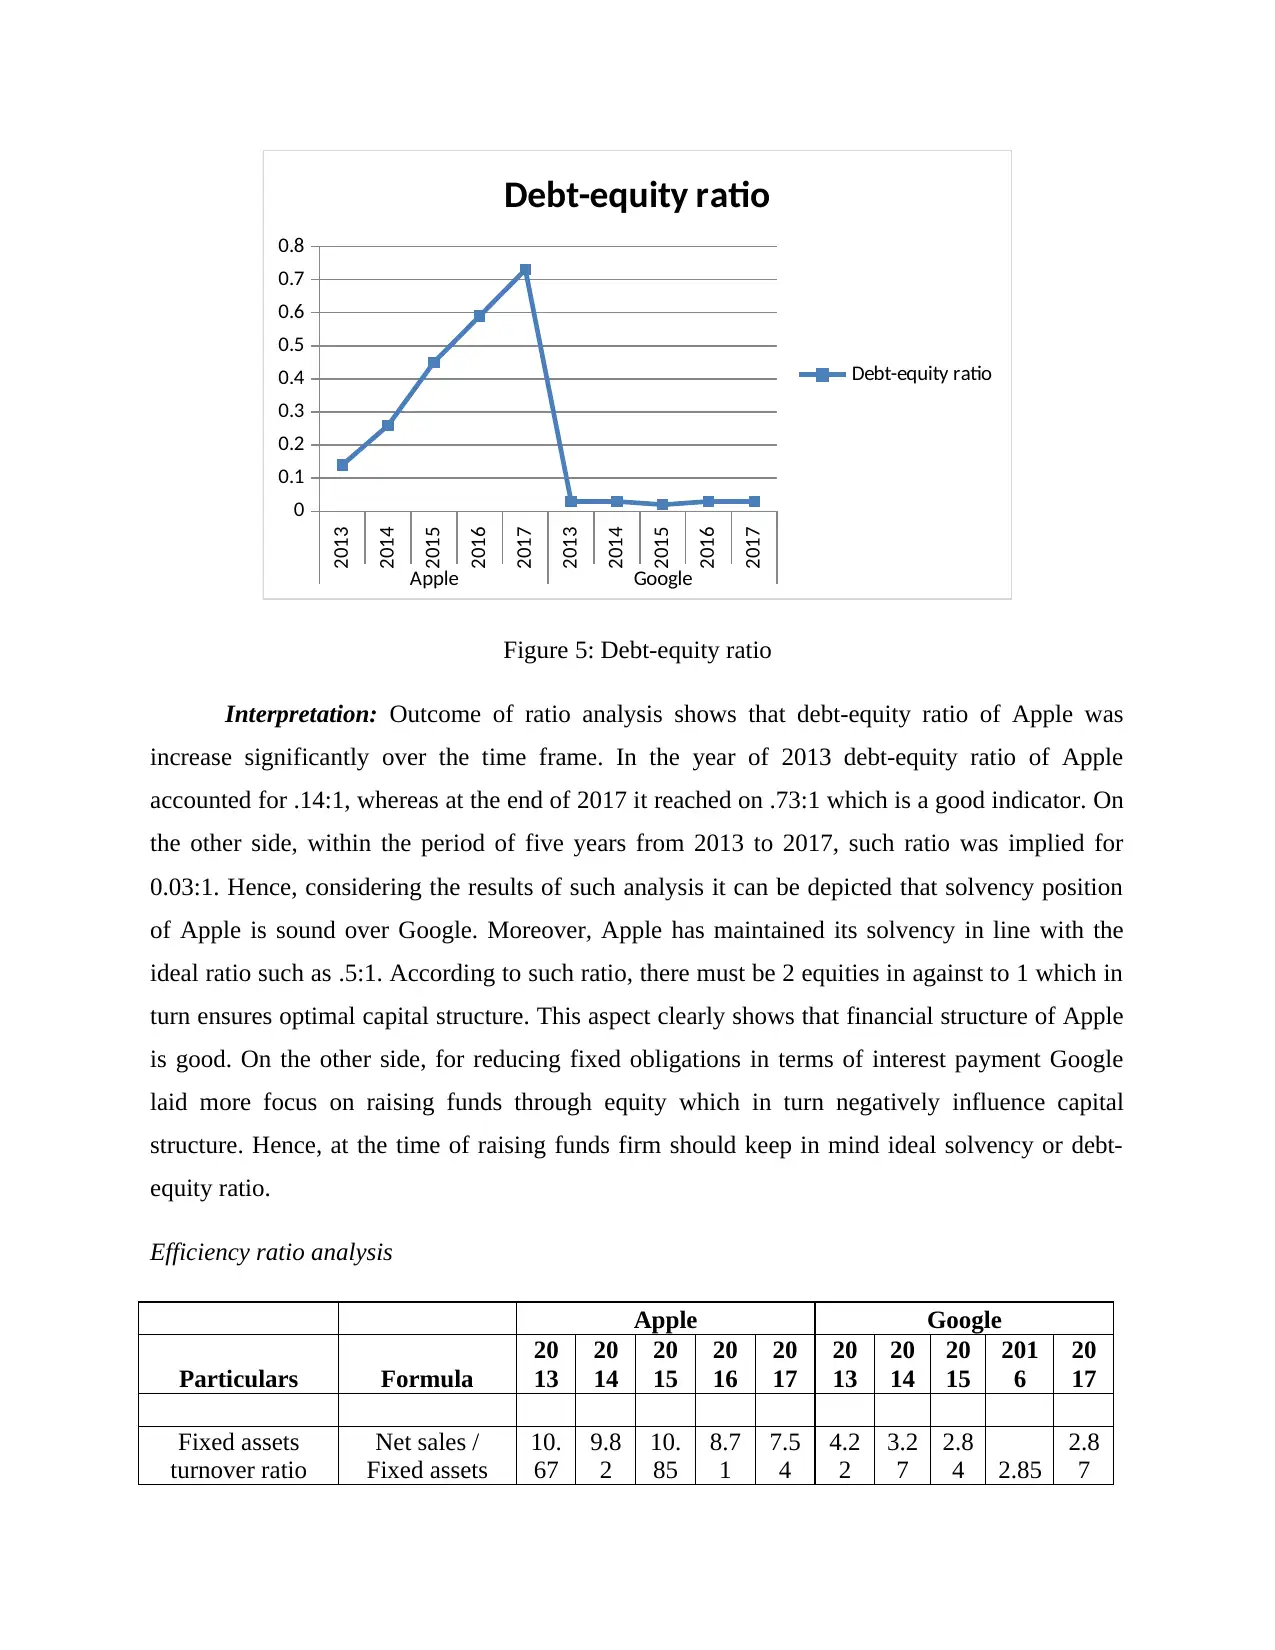
Fixed assets
turnover ratio
Net sales /
Fixed assets
10.
67
9.8
2
10.
85
8.7
1
7.5
4
4.2
2
3.2
7
2.8
4 2.85
2.8
7
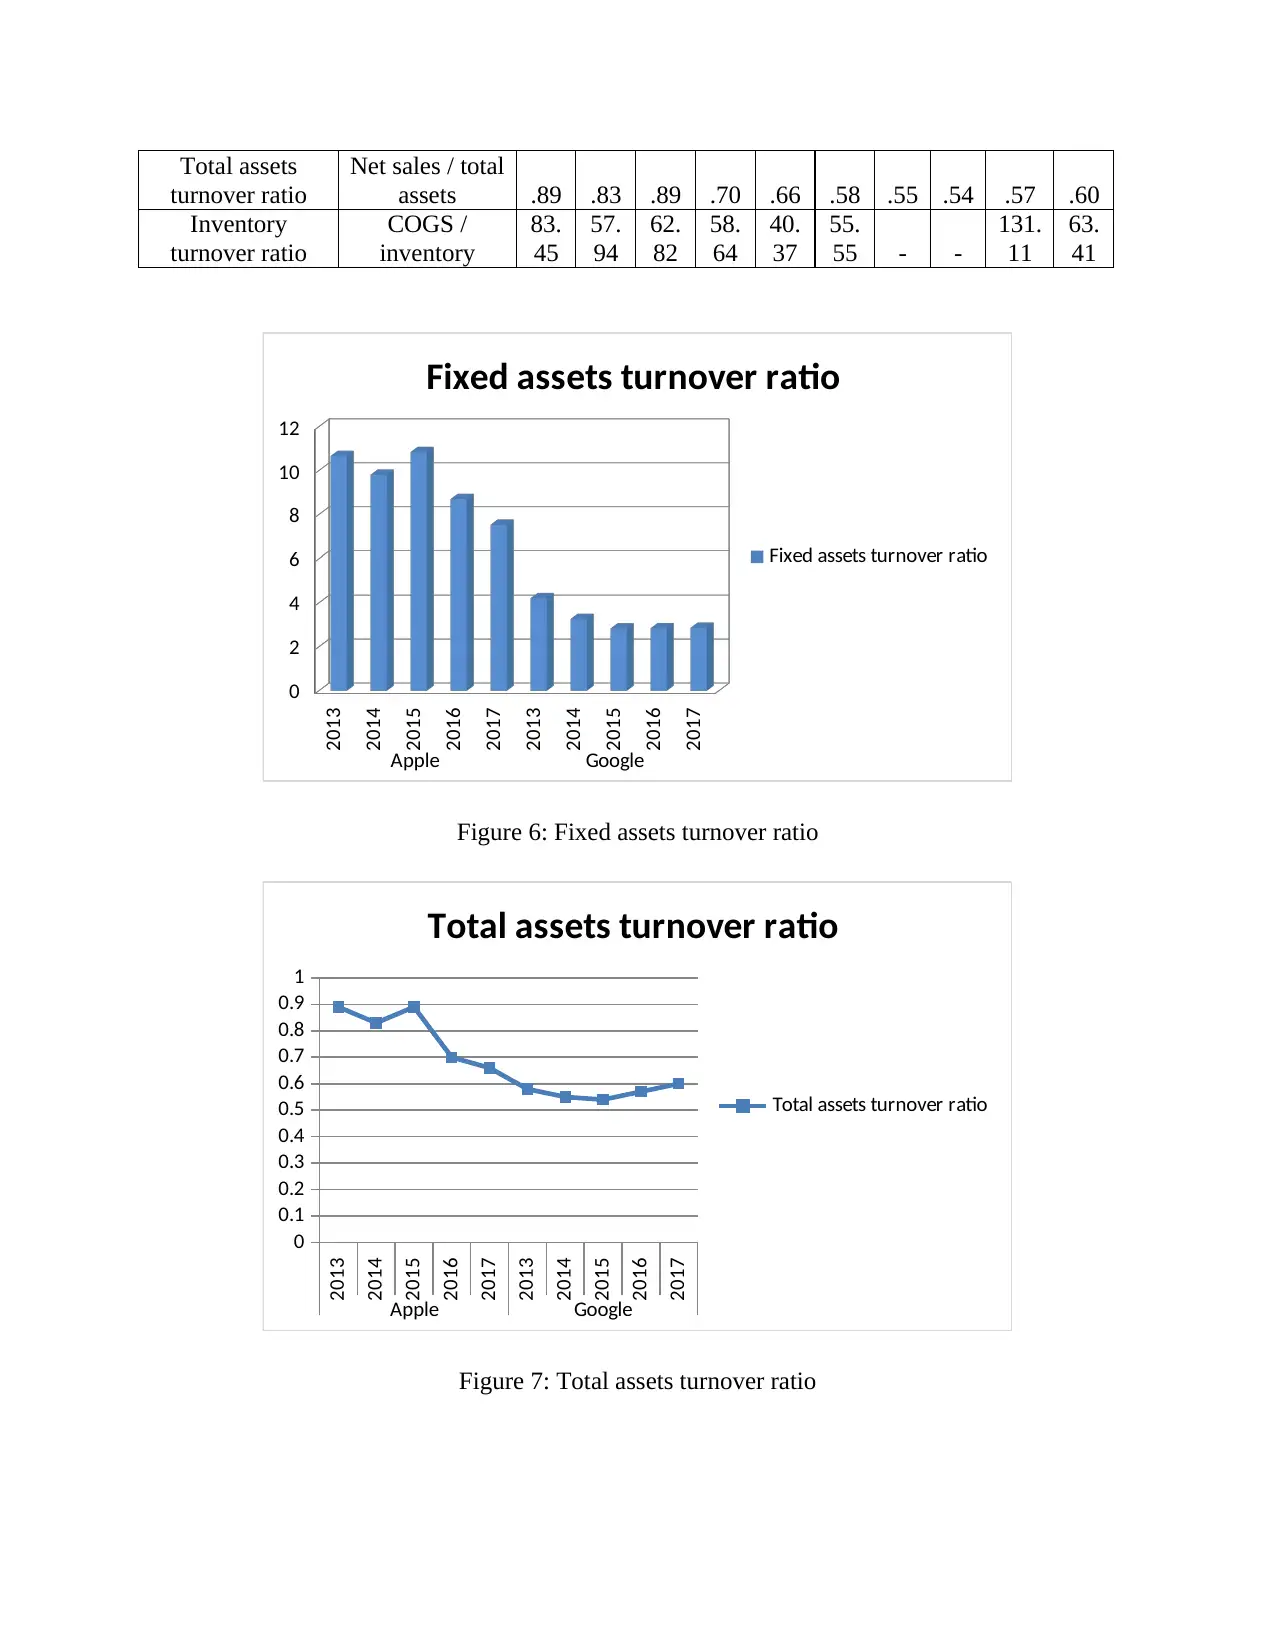
Total assets
turnover ratio
Net sales / total
assets .89 .83 .89 .70 .66 .58 .55 .54 .57 .60
Inventory
turnover ratio
COGS /
inventory
83.
45
57.
94
62.
82
58.
64
40.
37
55.
55 - -
131.
11
63.
41
2013
2014
2015
2016
2017
2013
2014
2015
2016
2017
Apple Google
0
2
4
6
8
10
12
Fixed assets turnover ratio
Fixed assets turnover ratio
Figure 6: Fixed assets turnover ratio
2013
2014
2015
2016
2017
2013
2014
2015
2016
2017
Apple Google
0
0.1
0.2
0.3
0.4
0.5
0.6
0.7
0.8
0.9
1
Total assets turnover ratio
Total assets turnover ratio
Figure 7: Total assets turnover ratio
turnover ratio
Net sales / total
assets .89 .83 .89 .70 .66 .58 .55 .54 .57 .60
Inventory
turnover ratio
COGS /
inventory
83.
45
57.
94
62.
82
58.
64
40.
37
55.
55 - -
131.
11
63.
41
2013
2014
2015
2016
2017
2013
2014
2015
2016
2017
Apple Google
0
2
4
6
8
10
12
Fixed assets turnover ratio
Fixed assets turnover ratio
Figure 6: Fixed assets turnover ratio
2013
2014
2015
2016
2017
2013
2014
2015
2016
2017
Apple Google
0
0.1
0.2
0.3
0.4
0.5
0.6
0.7
0.8
0.9
1
Total assets turnover ratio
Total assets turnover ratio
Figure 7: Total assets turnover ratio
⊘ This is a preview!⊘
Do you want full access?
Subscribe today to unlock all pages.
Trusted by 1+ million students worldwide
1 out of 25
Related Documents


Your All-in-One AI-Powered Toolkit for Academic Success.
+13062052269
info@desklib.com
Available 24*7 on WhatsApp / Email
![[object Object]](/_next/static/media/star-bottom.7253800d.svg)
Unlock your academic potential
Copyright © 2020–2026 A2Z Services. All Rights Reserved. Developed and managed by ZUCOL.