Comprehensive Financial Analysis Report: Apple Inc. (2017)

Verified

Added on  2020/05/28

|18
|3355
|64
Report
AI Summary
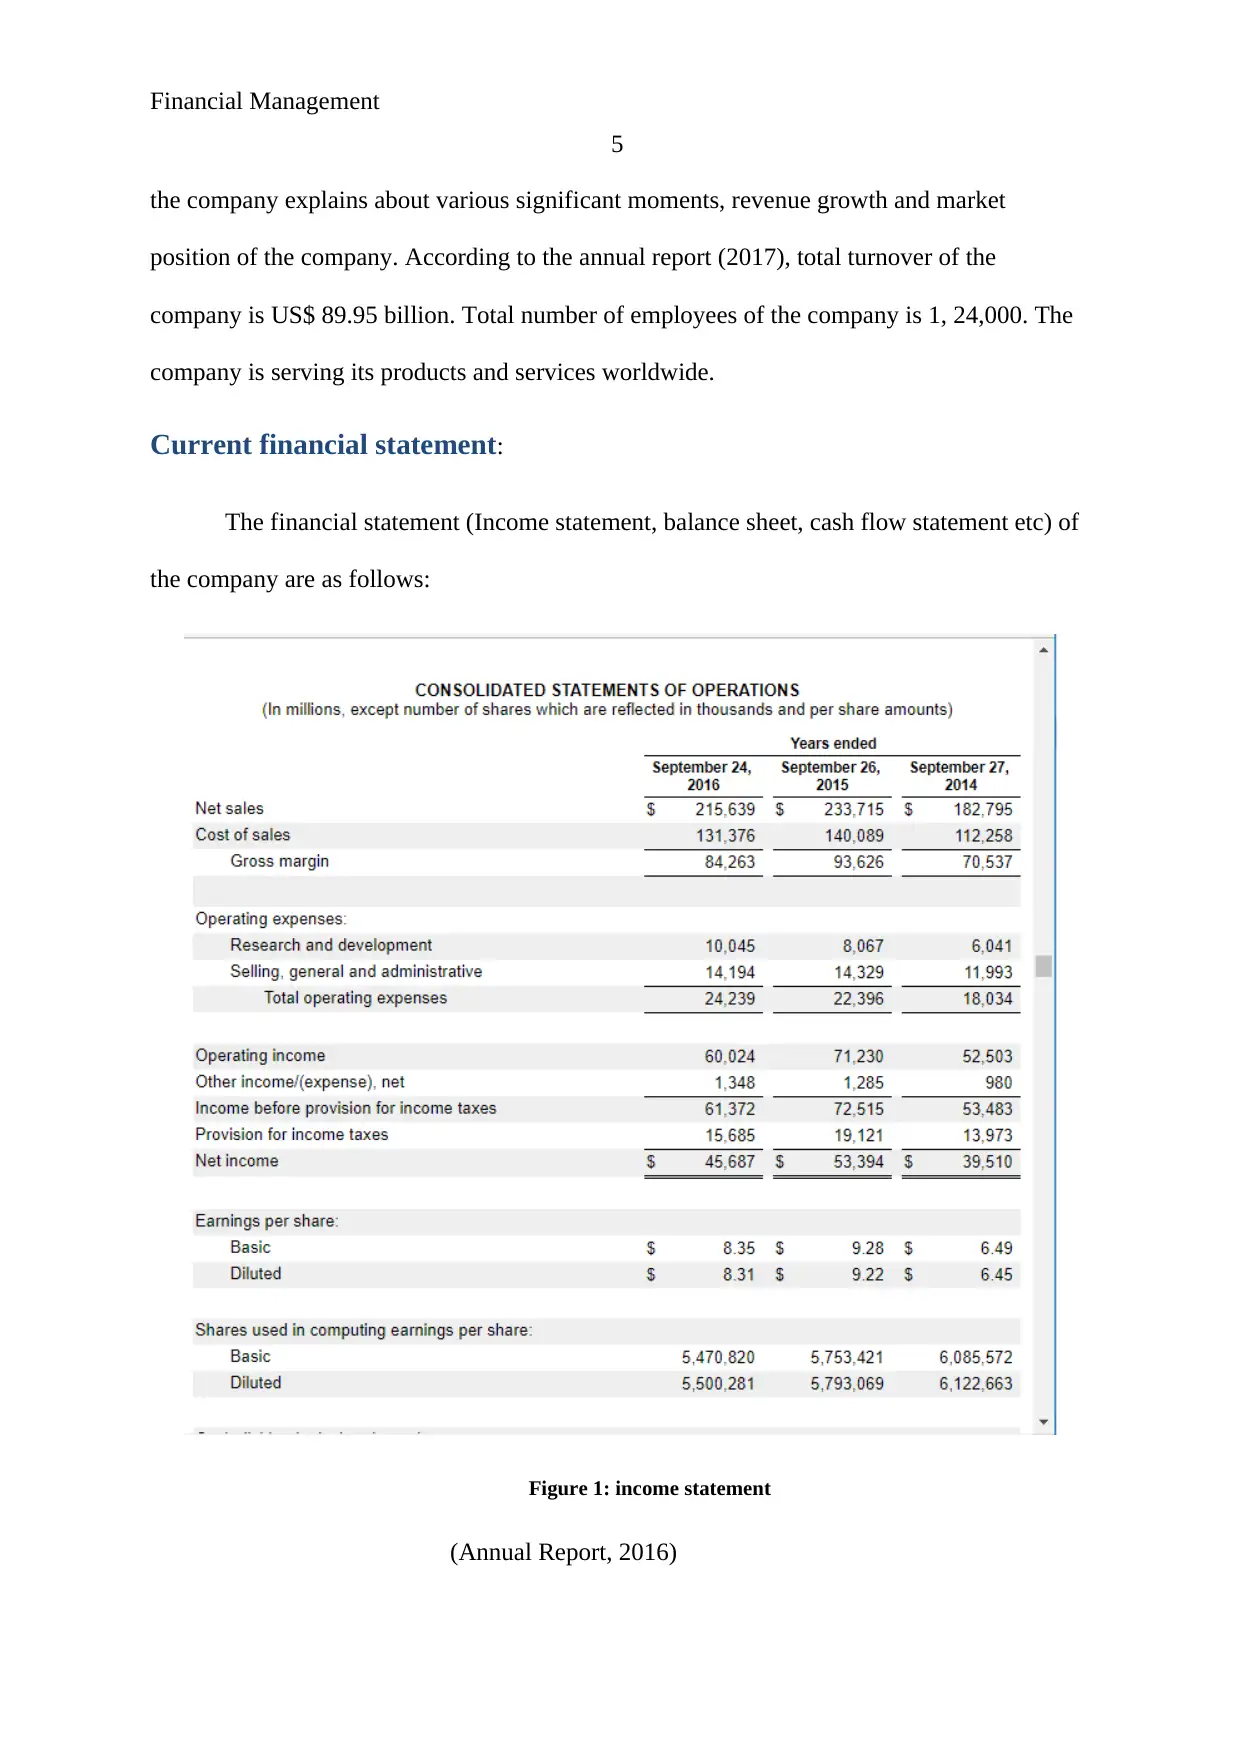
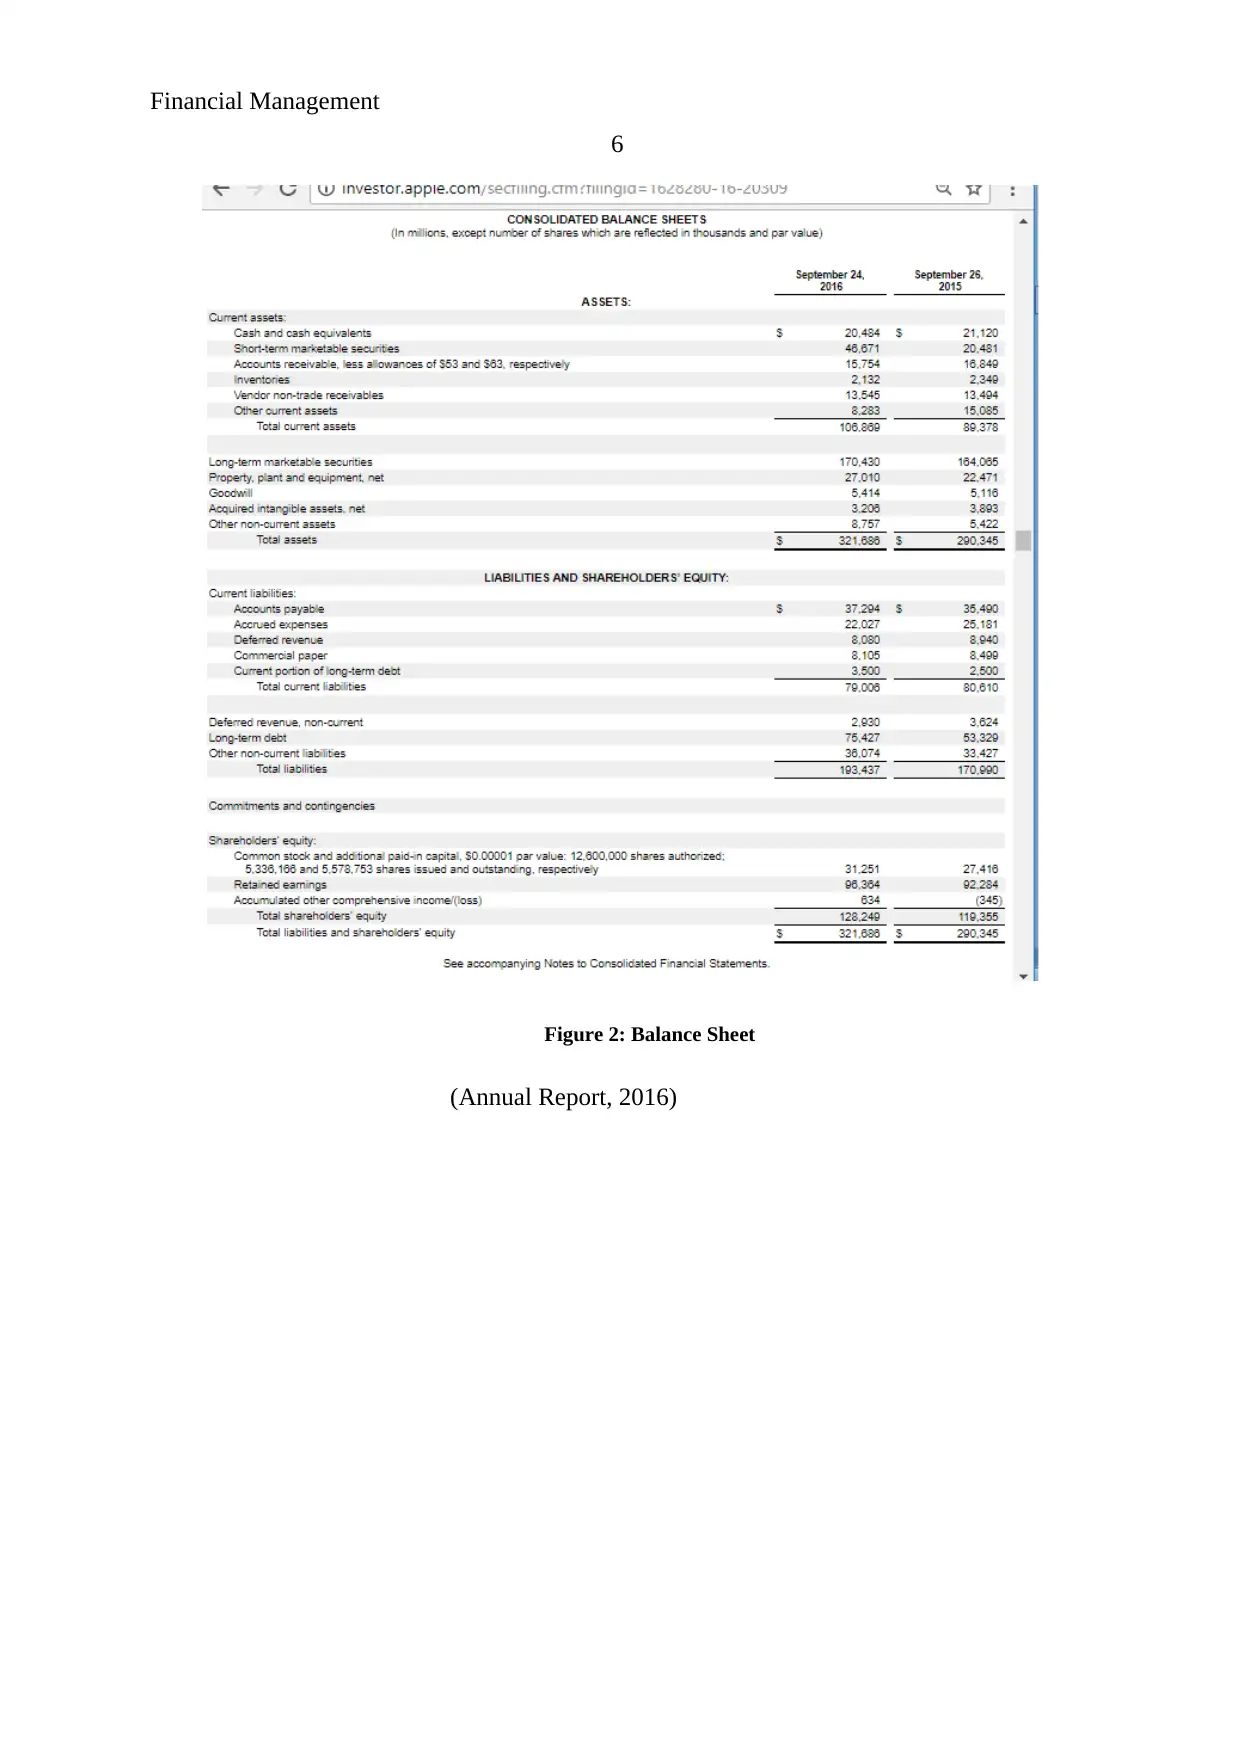
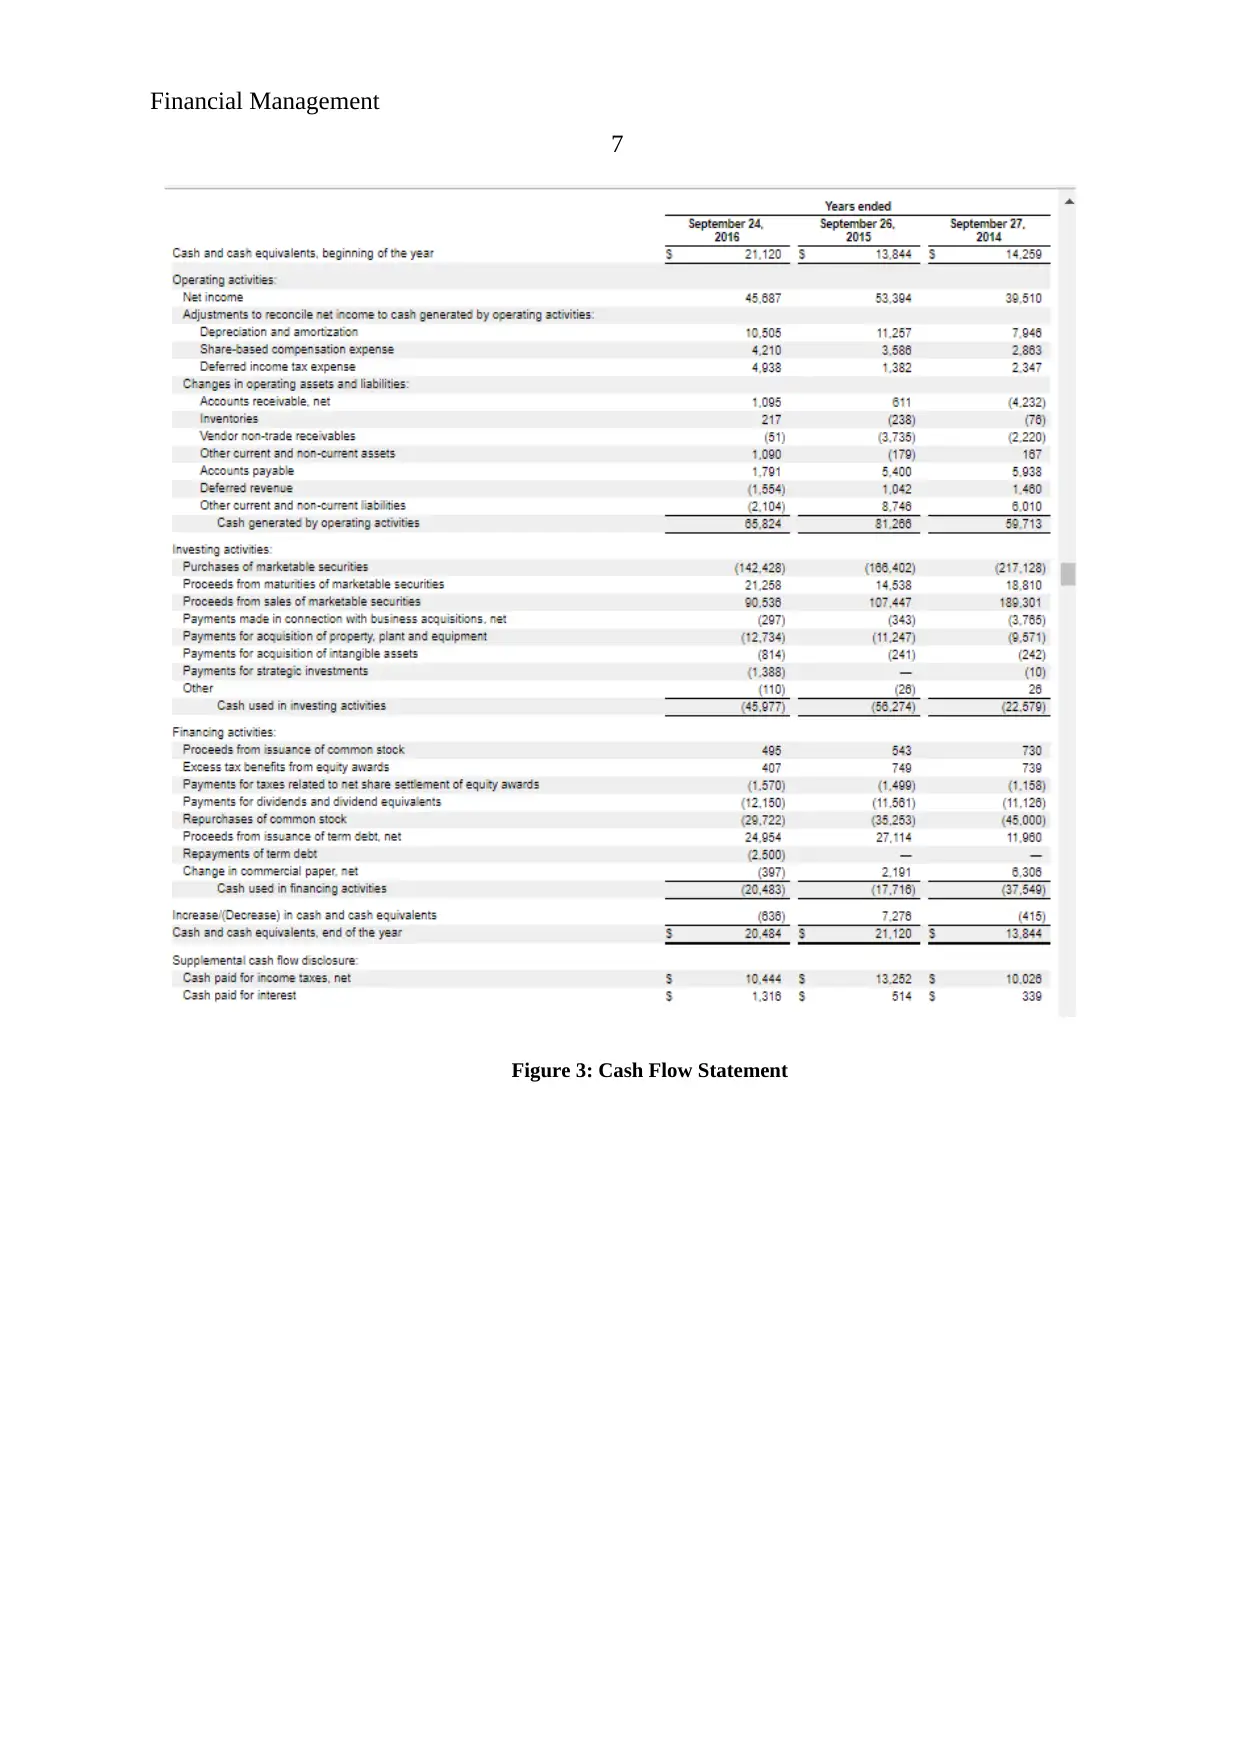
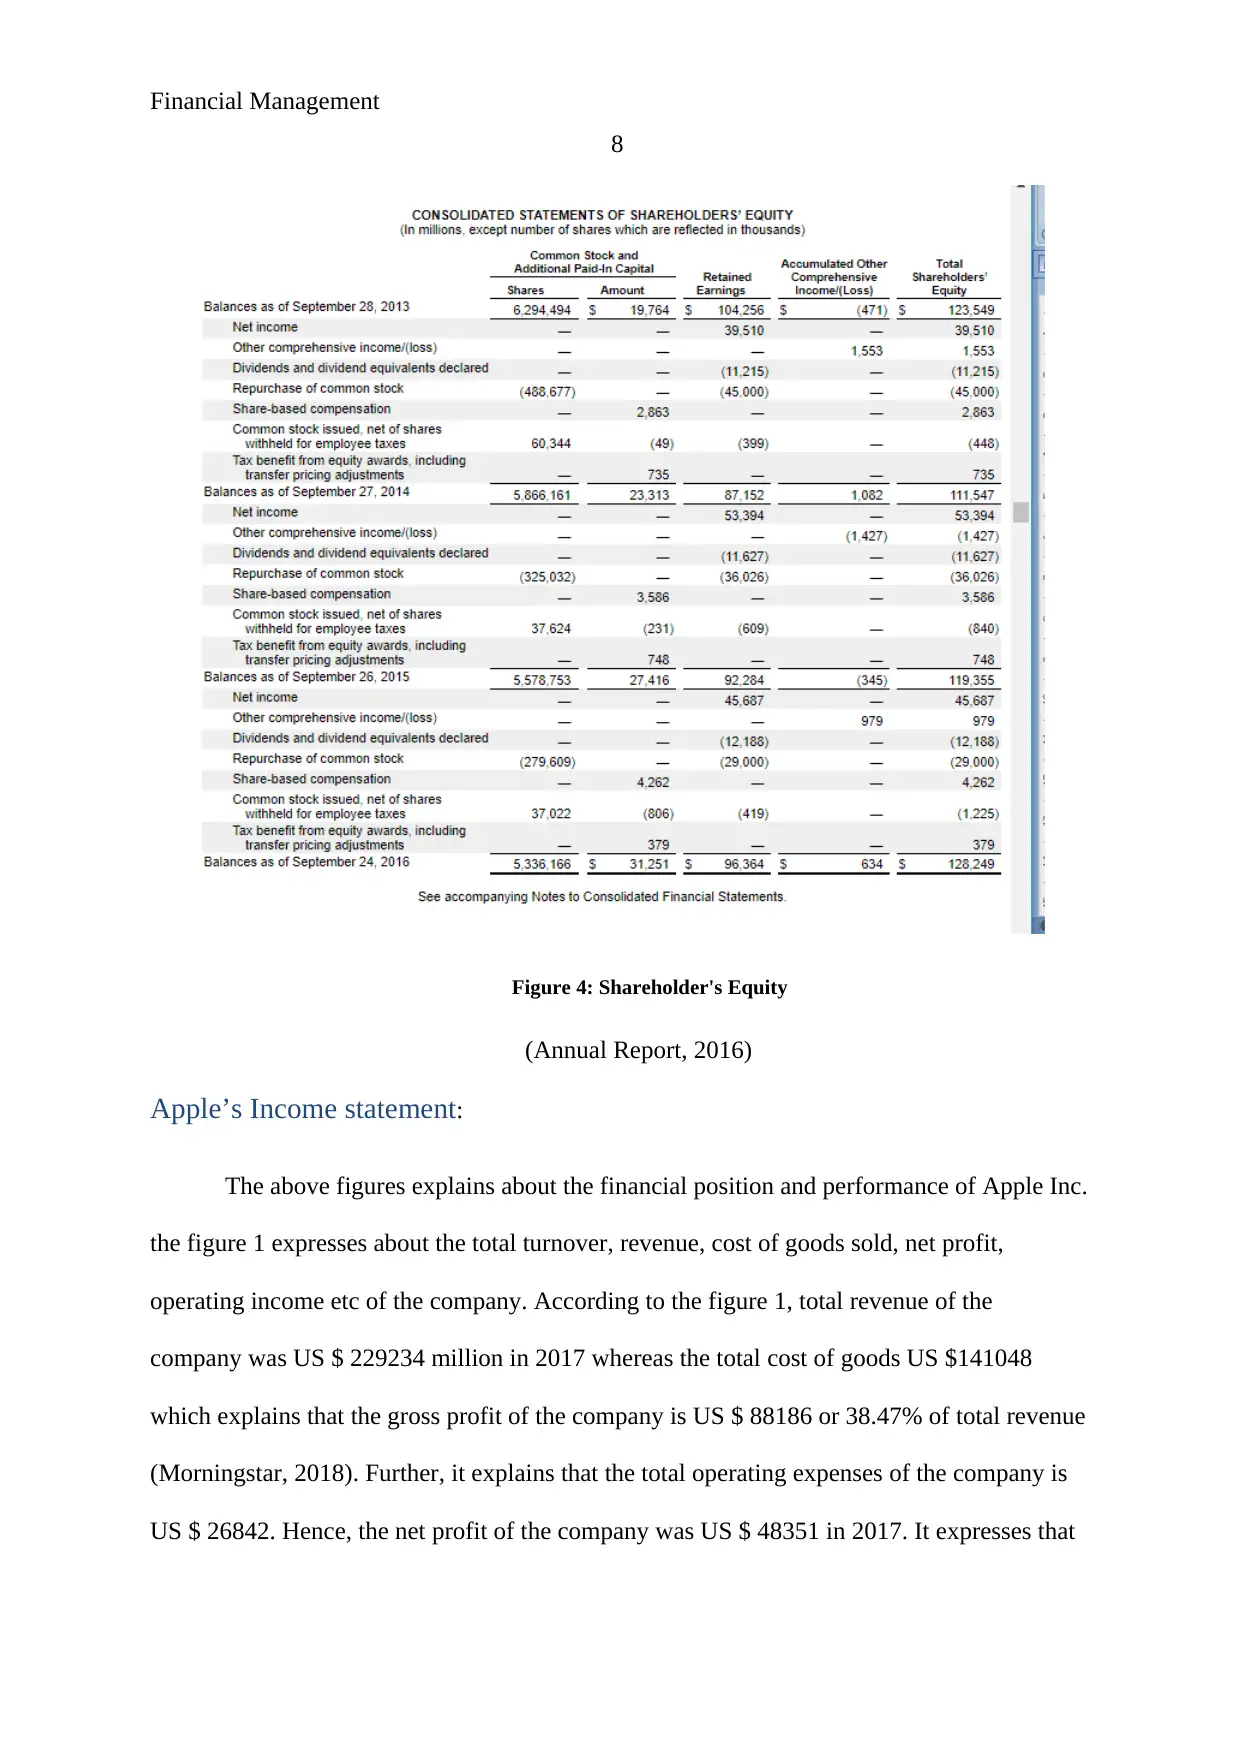
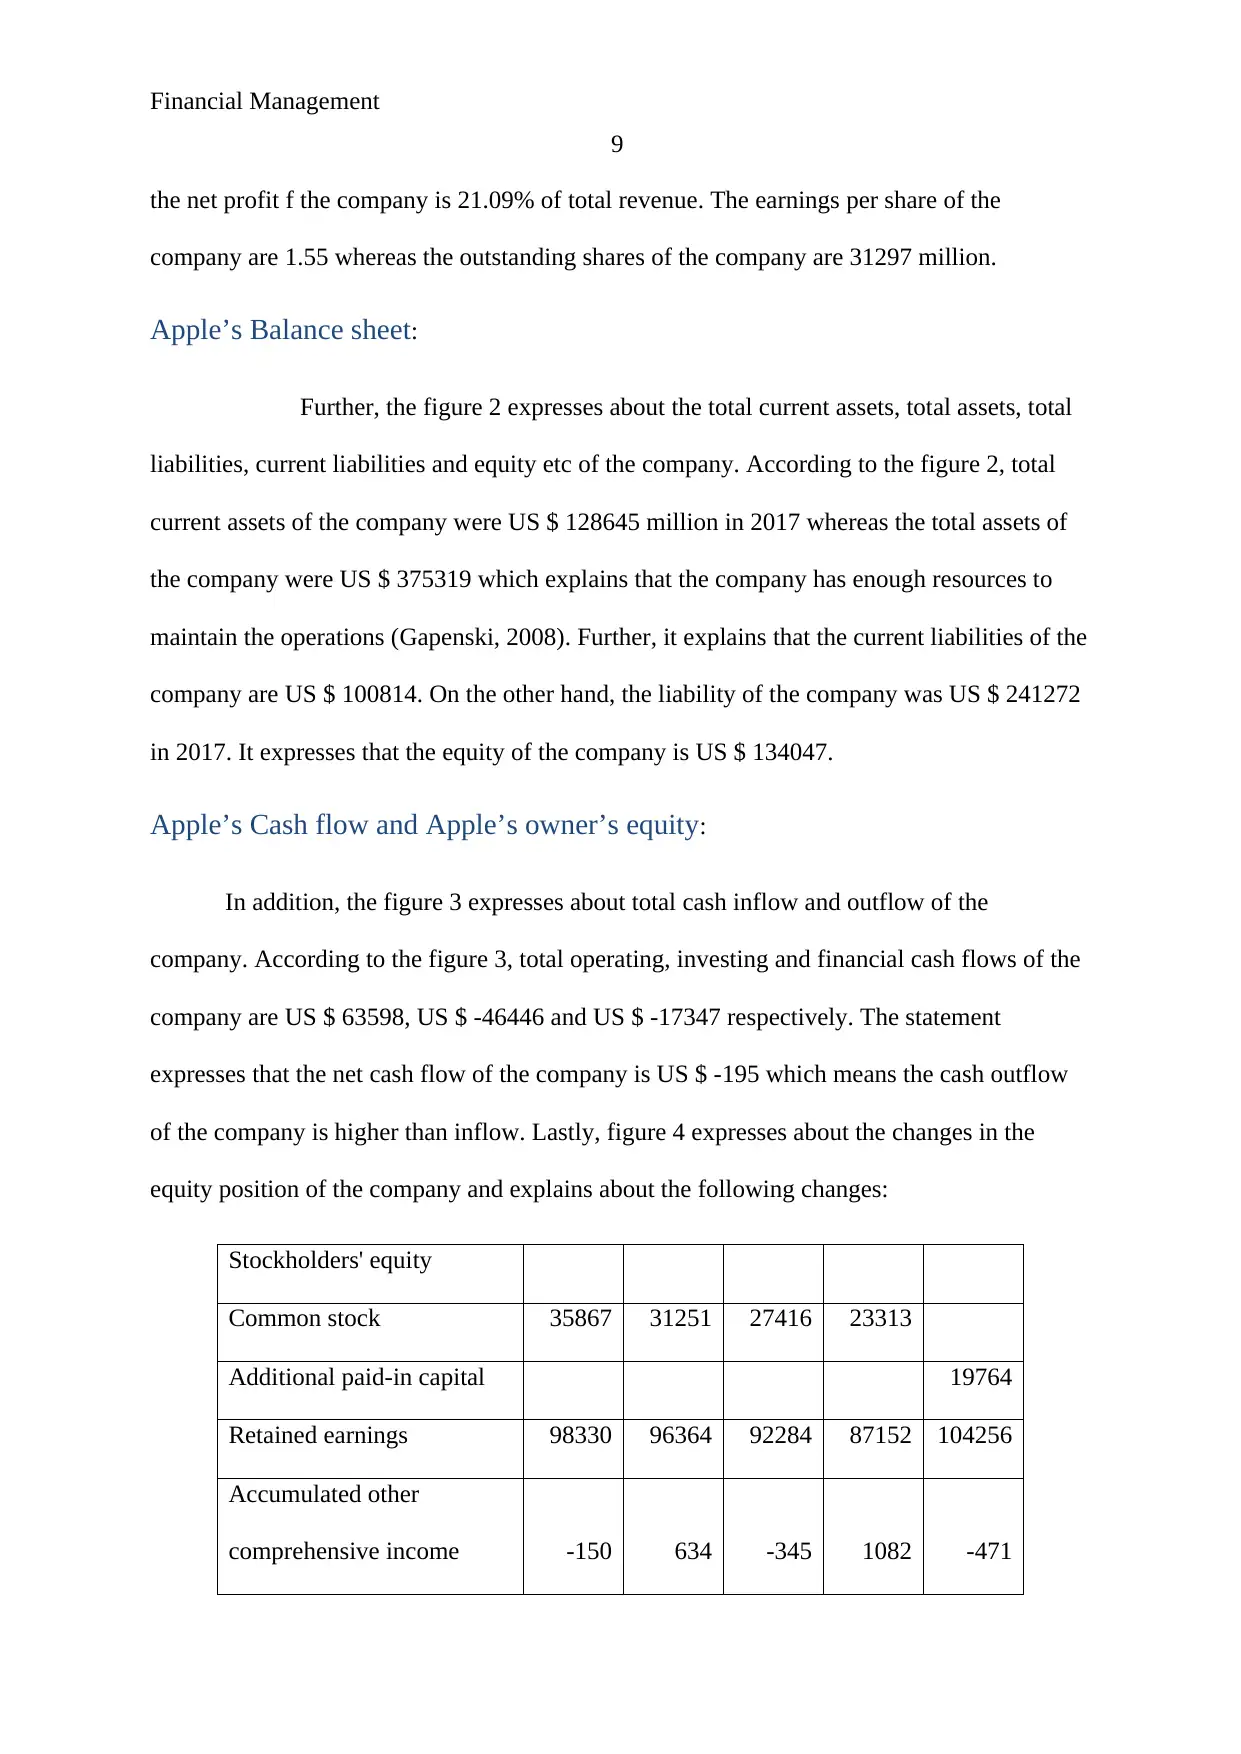
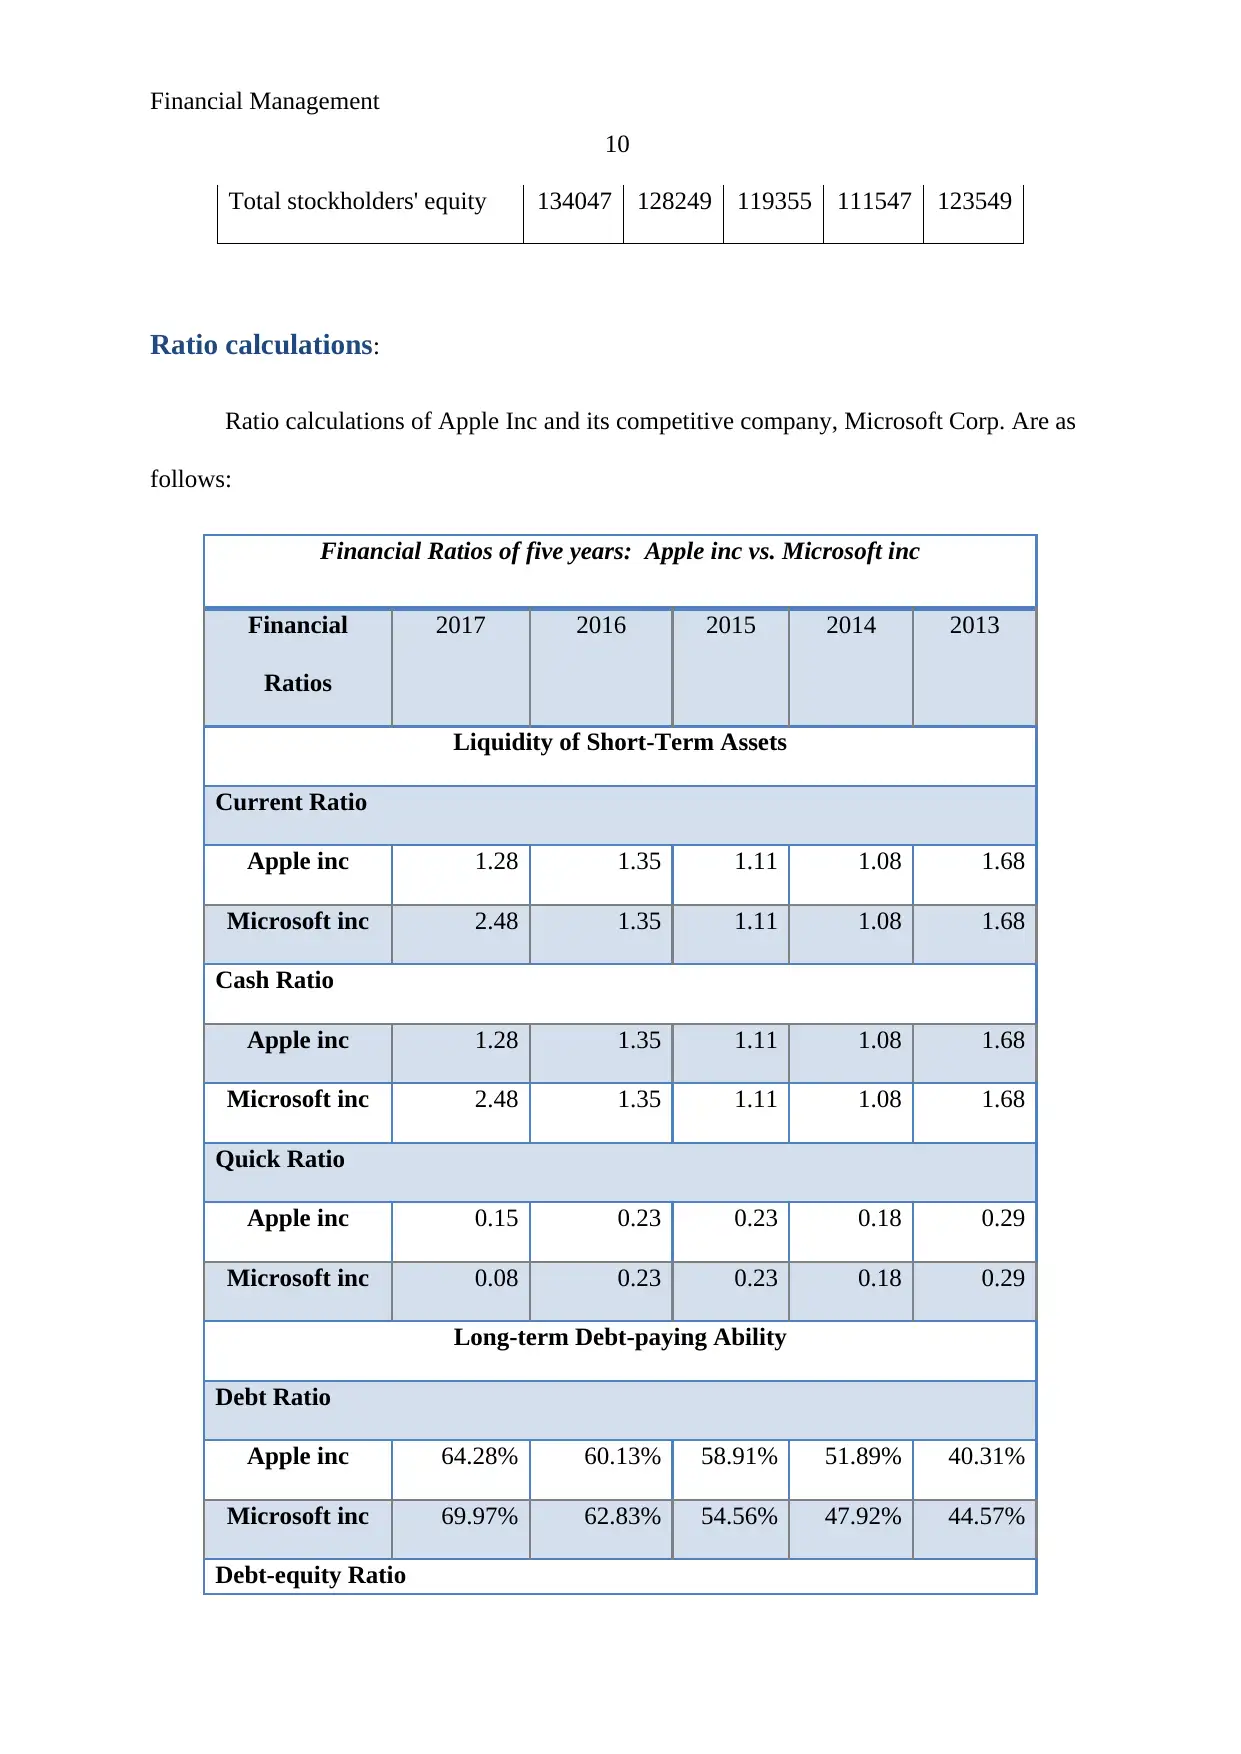
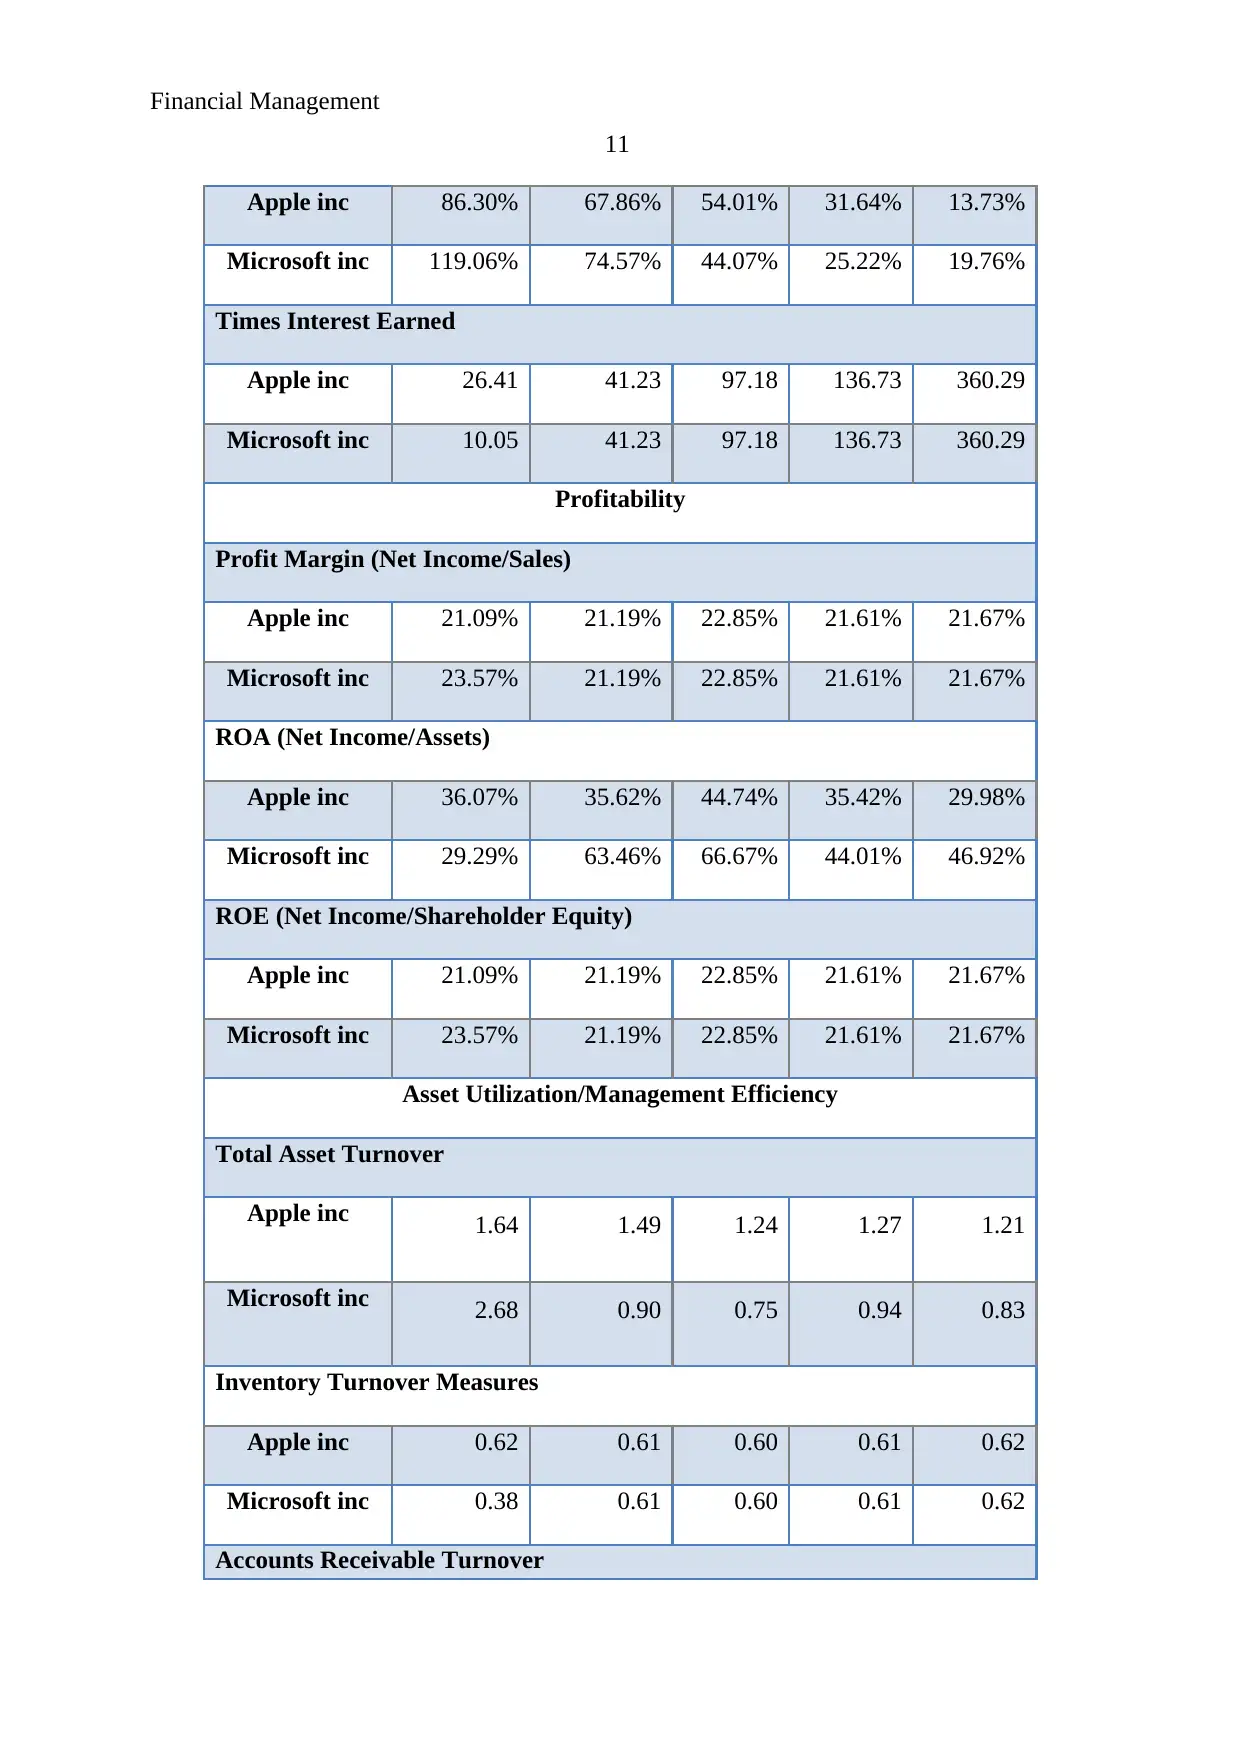
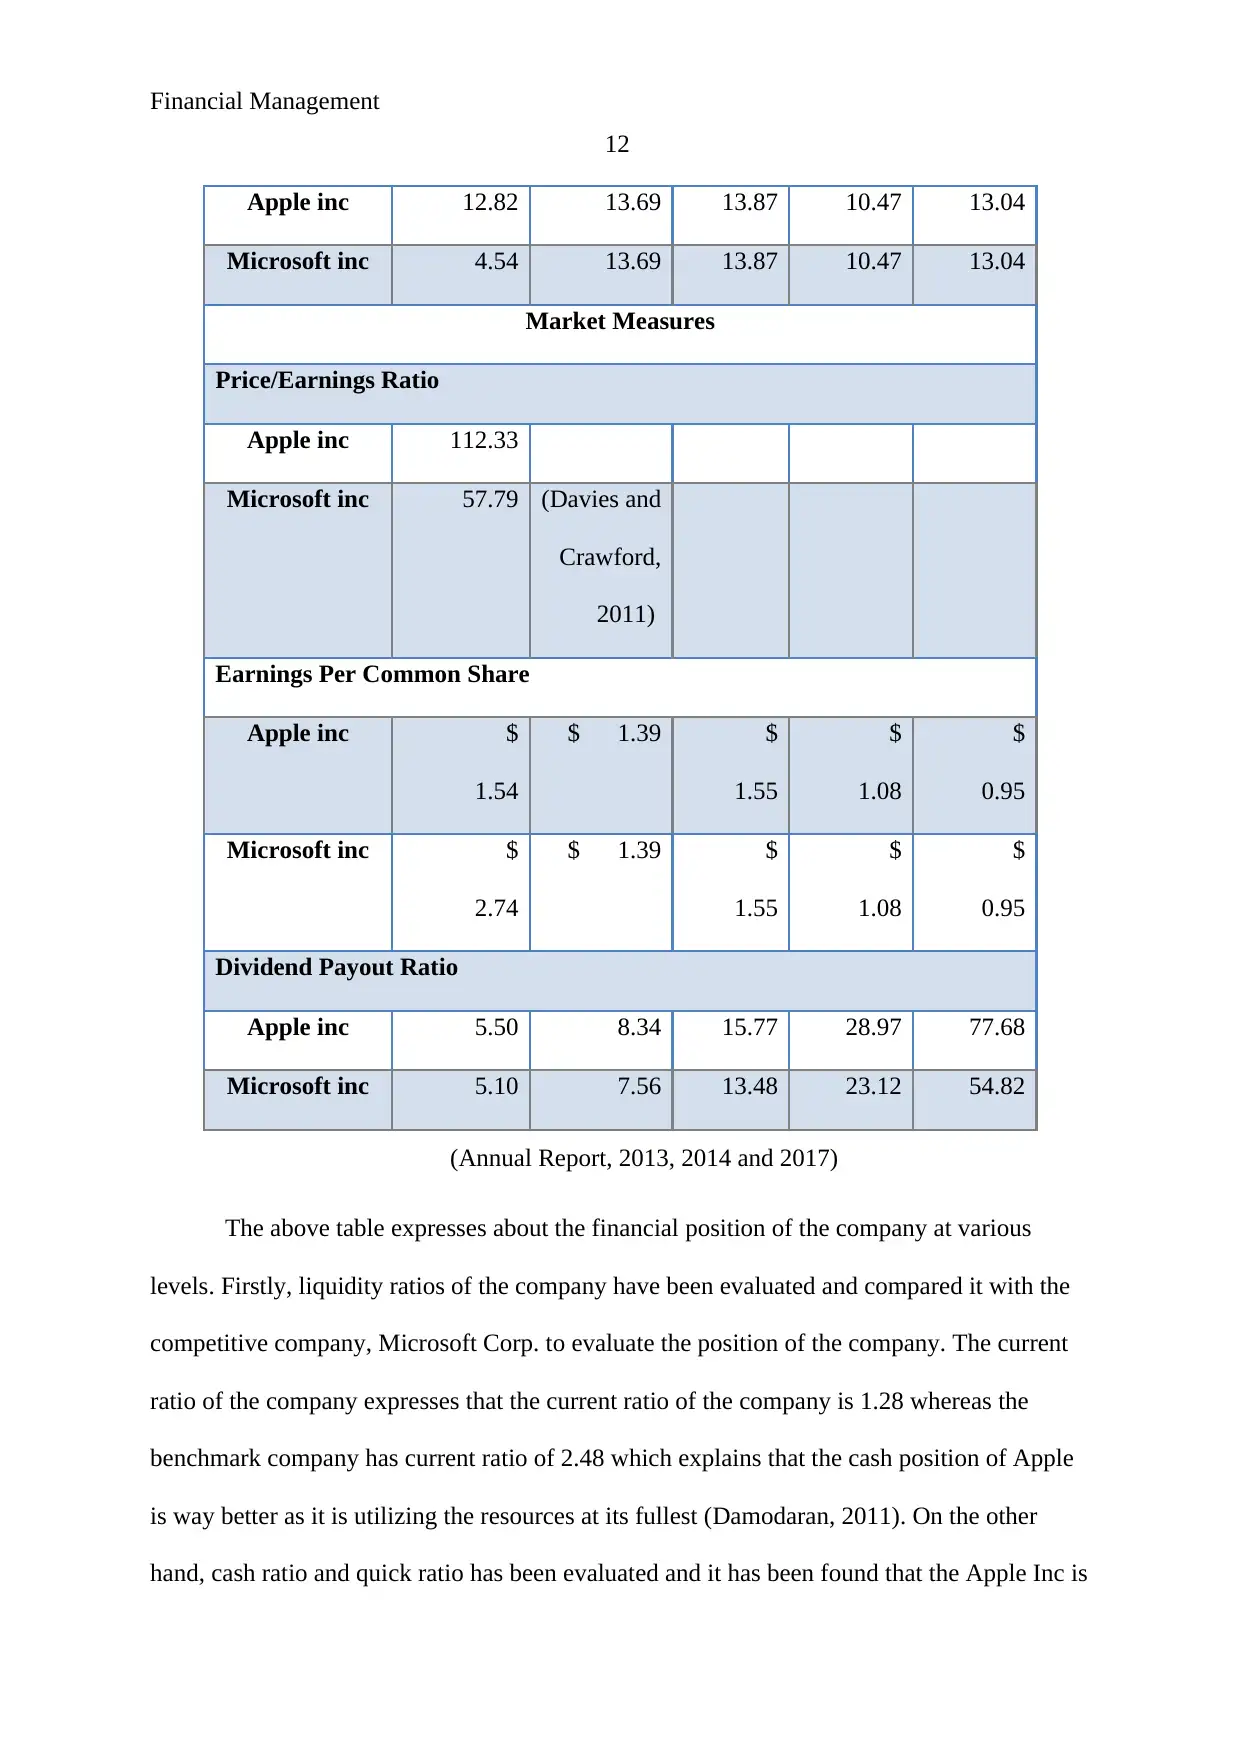
This report provides a comprehensive financial analysis of Apple Inc., evaluating its performance and financial position. The analysis begins with an introduction and company overview, detailing Apple's business operations, product lines, and market position. The report then examines Apple's current financial statements, including the income statement, balance sheet, and cash flow statement, providing key financial figures such as revenue, net profit, assets, liabilities, and cash flows. Ratio calculations are performed to assess liquidity, debt, profitability, asset utilization, and market measures, comparing Apple's performance to Microsoft Corp. Key statistics such as beta are also considered. The report concludes with a stock purchase discussion and recommendations based on the financial analysis, offering insights into the investment opportunity and overall financial health of the company. The analysis is based on financial data from 2017 and prior years.
Document Page
Running Head: Financial Management
1
Financial Management
tabler-icon-diamond-filled.svg

Paraphrase This Document

Need a fresh take? Get an instant paraphrase of this document with our AI Paraphraser
Document Page
Financial Management
2
Contents
Introduction.......................................................................................................................3
Company overview...........................................................................................................3
Current financial statement...............................................................................................5
Apple’s Income statement............................................................................................8
Apple’s Balance sheet...................................................................................................9
Apple’s Cash flow and Apple’s owner’s equity...........................................................9
Ratio calculations............................................................................................................10
Key statistics...................................................................................................................14
Stock purchase................................................................................................................15
Other information...........................................................................................................16
Recommendation............................................................................................................17
References.......................................................................................................................18
Document Page
Financial Management
3
Introduction:
Financial management is an analysis process to evaluate and analyze the position of
the company. This process helps the analyst to evaluate about the performance of the
company so that it becomes easy for them to make better conclusion about the company. This
report has been prepared to evaluate the performance and financial position of the company,
APPLE INC so that the investment opportunity of the company could be evaluated and it has
been analyzed that how is the manpower position of the company.
Company overview:
Apple Inc. is an American company which is operating its business in information
technology industry. Headquarter of the company is in California. The company designs,
sells and develops the computer software, electronic devices, mobile phones and online
services. Hardware product of the company includes iPhone, iPad, iPod, Mac personal
computer, Apple TV, HomePod speaker, smart watches etc. On the other hand, software of
apple includes macOS, iTunes, iOS operating system, iLife, safari web browser, iWork,
Xcode etc. company also offers various online services such as iTunes stores, Apple music,
Mac app store, iCloud (Home, 2018).
Company was founded in April 1976 by Steve Jobs, Steve Woozier and Ronald
Wayne. Firstly, the main business of the company was developing and sell personal computer
named by Wozaniak’s Apple. The company was incorporated as Apple computer Inc in 1977.
The current position of the company explains about various significant moments, revenue
growth and market position of the company. Apple Inc went public for achieving the instant
financial success in 1980. According to the annual report (2017), total turnover of the
Document Page
Financial Management
4
company is US$ 229.234 billion. Total number of employees of the company is 1,23,000.
The company is serving its products and services worldwide (Baker and Nofsinger, 2010).
The company has enjoyed huge level of loyalty and it has also been repeated that the
company has been awarded as most valuable brand of the company. However, the company
has received significant criticism in context with the labour practices, business practices,
environmental practices which also includes anti competitive behaviours and the sources of
materials.
Apple inc. is the largest information technology company in worldwide in terms of its
revenue and it is second largest mobile manufacturing company. In the year of 2015, apple
Inc has become the first US Company which has been valued more than UD$ 700 billion.
Currently, company is maintaining around 499 retail stores in 22 countries and on the other
hand, it is world’s largest music retailing company. According to the report of 2016, around 1
billion apple products are used around the world actively (Arnold, 2013). It is a joint stock
company which has been registered with the SEC. The main stakeholder of the company is
The Vanguard Group which is holding 6.43% of total stock of the company.
The main competitive company of Apple inc. is Microsoft Corp. Microsoft corp. is an
American company which is operating its business in information technology industry.
Headquarter of the company is in Washington. The company designs, sells and develops the
computer software, electronic devices, mobile phones and online services. The best software
product of the company is Microsoft windows line of Microsoft office suit, operating system,
edge web browser (Home, 2018). The hardware product of the company is Xbox video game,
Microsoft surface tablet etc.
Company was founded in April 1975 by Paul Allen and Bill Gates. Firstly, the main
business of the company was developing and sell personal computer. The current position of
tabler-icon-diamond-filled.svg

Paraphrase This Document

Need a fresh take? Get an instant paraphrase of this document with our AI Paraphraser
Document Page
Financial Management
5
the company explains about various significant moments, revenue growth and market
position of the company. According to the annual report (2017), total turnover of the
company is US$ 89.95 billion. Total number of employees of the company is 1, 24,000. The
company is serving its products and services worldwide.
Current financial statement:
The financial statement (Income statement, balance sheet, cash flow statement etc) of
the company are as follows:
Figure 1: income statement
(Annual Report, 2016)
Document Page
Financial Management
6
Figure 2: Balance Sheet
(Annual Report, 2016)
Document Page
Financial Management
7
Figure 3: Cash Flow Statement
tabler-icon-diamond-filled.svg

Paraphrase This Document

Need a fresh take? Get an instant paraphrase of this document with our AI Paraphraser
Document Page
Financial Management
8
Figure 4: Shareholder's Equity
(Annual Report, 2016)
Apple’s Income statement:
The above figures explains about the financial position and performance of Apple Inc.
the figure 1 expresses about the total turnover, revenue, cost of goods sold, net profit,
operating income etc of the company. According to the figure 1, total revenue of the
company was US $ 229234 million in 2017 whereas the total cost of goods US $141048
which explains that the gross profit of the company is US $ 88186 or 38.47% of total revenue
(Morningstar, 2018). Further, it explains that the total operating expenses of the company is
US $ 26842. Hence, the net profit of the company was US $ 48351 in 2017. It expresses that
Document Page
Financial Management
9
the net profit f the company is 21.09% of total revenue. The earnings per share of the
company are 1.55 whereas the outstanding shares of the company are 31297 million.
Apple’s Balance sheet:
Further, the figure 2 expresses about the total current assets, total assets, total
liabilities, current liabilities and equity etc of the company. According to the figure 2, total
current assets of the company were US $ 128645 million in 2017 whereas the total assets of
the company were US $ 375319 which explains that the company has enough resources to
maintain the operations (Gapenski, 2008). Further, it explains that the current liabilities of the
company are US $ 100814. On the other hand, the liability of the company was US $ 241272
in 2017. It expresses that the equity of the company is US $ 134047.
Apple’s Cash flow and Apple’s owner’s equity:
In addition, the figure 3 expresses about total cash inflow and outflow of the
company. According to the figure 3, total operating, investing and financial cash flows of the
company are US $ 63598, US $ -46446 and US $ -17347 respectively. The statement
expresses that the net cash flow of the company is US $ -195 which means the cash outflow
of the company is higher than inflow. Lastly, figure 4 expresses about the changes in the
equity position of the company and explains about the following changes:
Stockholders' equity
Common stock 35867 31251 27416 23313
Additional paid-in capital 19764
Retained earnings 98330 96364 92284 87152 104256
Accumulated other
comprehensive income -150 634 -345 1082 -471
Document Page
Financial Management
10
Total stockholders' equity 134047 128249 119355 111547 123549
Ratio calculations:
Ratio calculations of Apple Inc and its competitive company, Microsoft Corp. Are as
follows:
Financial Ratios of five years: Apple inc vs. Microsoft inc
Financial
Ratios
2017 2016 2015 2014 2013
Liquidity of Short-Term Assets
Current Ratio
Apple inc 1.28 1.35 1.11 1.08 1.68
Microsoft inc 2.48 1.35 1.11 1.08 1.68
Cash Ratio
Apple inc 1.28 1.35 1.11 1.08 1.68
Microsoft inc 2.48 1.35 1.11 1.08 1.68
Quick Ratio
Apple inc 0.15 0.23 0.23 0.18 0.29
Microsoft inc 0.08 0.23 0.23 0.18 0.29
Long-term Debt-paying Ability
Debt Ratio
Apple inc 64.28% 60.13% 58.91% 51.89% 40.31%
Microsoft inc 69.97% 62.83% 54.56% 47.92% 44.57%
Debt-equity Ratio
tabler-icon-diamond-filled.svg

Paraphrase This Document

Need a fresh take? Get an instant paraphrase of this document with our AI Paraphraser
Document Page
Financial Management
11
Apple inc 86.30% 67.86% 54.01% 31.64% 13.73%
Microsoft inc 119.06% 74.57% 44.07% 25.22% 19.76%
Times Interest Earned
Apple inc 26.41 41.23 97.18 136.73 360.29
Microsoft inc 10.05 41.23 97.18 136.73 360.29
Profitability
Profit Margin (Net Income/Sales)
Apple inc 21.09% 21.19% 22.85% 21.61% 21.67%
Microsoft inc 23.57% 21.19% 22.85% 21.61% 21.67%
ROA (Net Income/Assets)
Apple inc 36.07% 35.62% 44.74% 35.42% 29.98%
Microsoft inc 29.29% 63.46% 66.67% 44.01% 46.92%
ROE (Net Income/Shareholder Equity)
Apple inc 21.09% 21.19% 22.85% 21.61% 21.67%
Microsoft inc 23.57% 21.19% 22.85% 21.61% 21.67%
Asset Utilization/Management Efficiency
Total Asset Turnover
Apple inc 1.64 1.49 1.24 1.27 1.21
Microsoft inc 2.68 0.90 0.75 0.94 0.83
Inventory Turnover Measures
Apple inc 0.62 0.61 0.60 0.61 0.62
Microsoft inc 0.38 0.61 0.60 0.61 0.62
Accounts Receivable Turnover
Document Page
Financial Management
12
Apple inc 12.82 13.69 13.87 10.47 13.04
Microsoft inc 4.54 13.69 13.87 10.47 13.04
Market Measures
Price/Earnings Ratio
Apple inc 112.33
Microsoft inc 57.79 (Davies and
Crawford,
2011)
Earnings Per Common Share
Apple inc $
1.54
$ 1.39 $
1.55
$
1.08
$
0.95
Microsoft inc $
2.74
$ 1.39 $
1.55
$
1.08
$
0.95
Dividend Payout Ratio
Apple inc 5.50 8.34 15.77 28.97 77.68
Microsoft inc 5.10 7.56 13.48 23.12 54.82
(Annual Report, 2013, 2014 and 2017)
The above table expresses about the financial position of the company at various
levels. Firstly, liquidity ratios of the company have been evaluated and compared it with the
competitive company, Microsoft Corp. to evaluate the position of the company. The current
ratio of the company expresses that the current ratio of the company is 1.28 whereas the
benchmark company has current ratio of 2.48 which explains that the cash position of Apple
is way better as it is utilizing the resources at its fullest (Damodaran, 2011). On the other
hand, cash ratio and quick ratio has been evaluated and it has been found that the Apple Inc is
chevron_up_icon
1 out of 18
circle_padding
hide_on_mobile
zoom_out_icon
[object Object]