Financial Performance Analysis of Apple Inc. using Ratio Analysis
VerifiedAdded on 2023/01/18
|12
|3042
|91
Report
AI Summary
This report provides a comprehensive financial analysis of Apple Inc., focusing on key financial ratios to assess its performance. The executive summary highlights the importance of ratio analysis in evaluating a company's market position and profitability. The main body of the report offers an overview of Apple Inc., including its financial highlights from the income statement, financial position statement, cash flow statement, and changes in equity. The report delves into the calculation and analysis of various ratios, categorized into liquidity (current ratio, quick ratio), profitability (gross profit ratio, return on capital employed, net profit ratio), and efficiency ratios (fixed assets turnover ratio). The analysis covers the years 2018 and 2019, providing interpretations of the trends and implications for Apple's financial health. The report concludes with a summary of the findings and references used.

Accounting and
Managerial Finance
Managerial Finance
Paraphrase This Document
Need a fresh take? Get an instant paraphrase of this document with our AI Paraphraser
Table of Contents
Executive summary..........................................................................................................................1
MAIN BODY...................................................................................................................................1
Overview of company..................................................................................................................1
Financial highlights of Apple Inc................................................................................................1
Combination of definition, calculation and analysis of
each ratio in different categories.................................................................................................2
CONCLUSION ...............................................................................................................................7
REFERENCERS .............................................................................................................................8

⊘ This is a preview!⊘
Do you want full access?
Subscribe today to unlock all pages.
Trusted by 1+ million students worldwide
Executive summary
In present business scenario, each company use to analyse the overall performance and
profitability so that actual market position can be determined and following decision are made.
Ratio analyse is consider to be an effective method of assessing and comparing of relevant
financial details by computing annual statements figures. This report summarise the calculation
of various kind of ratios and proper analysis which help in determining the overall profitability
of business.
MAIN BODY
Overview of company
Apple Inc., erstwhile Apple Laptop, Inc., American desktop as well as computer software
maker. This was the first successful company for desktop computers and the user interface,
public intellectual. Office is located in Cupertino, California. It is listed at NASDAQ stock
exchange market. NASDAQ is a digital market in which shares are exchanged rather than a
trading floor within an automated software system. This accounts for the automated quotation
process of the National Association of Securities Dealers and is the second biggest stock market
regardless of market capitalisation in the world.
Financial highlights of Apple Inc.
Income statement
Net revenue consist mainly of revenues from either the selling of hardware technology,
digital media and apps, devices, and product support agreements. Company is regarded to be
delivered to the client once shipped and name has been converted, risk of failure and property
rewards. The Corporation acknowledges revenue if there is compelling evidence of an
agreement, distribution has taken place, the selling price is set or scientifically testable, and
receipt is probable (Yin, Wang and Liu, 2014). Such requirements are encountered for much of
the company's product sales at the moment the product is transported. For people online sales,
for whatever consumer employment sales throughout the U.S., for some other sales.
Financial position statement
The assessment methods being used by Business to assess the fair market value of money
market funds and other profitable investment bonds are extracted from cited rates for equivalent
resources or debts in active economies. Net cash, receivables and marketable securities as of
1
Paraphrase This Document
Need a fresh take? Get an instant paraphrase of this document with our AI Paraphraser
September 29, 2018 would include $20.3 billion which was limited from particular use. The
profitability methods used it to measure the fair value of the business's financial instruments and
other financial instruments that usually have high credit rating depositors.
Cash flow statement
Accumulated other detailed income/(loss) ("AOCI") tracks the successful parts of
liquidity hedges till the levered product is recorded in profits. Delayed gains or losses connected
with foreign exchange income liquidity hedges are identified in same period as an element of net
revenue. Recognizing the associated revenue, backdated profits and losses associated with
liquidity shrubs of stock purchases are identified as an element of sales cost in same period as the
associated costs are acknowledged. For options designated as cash flow hedges, changes in the
time value are excluded from the assessment of hedge effectiveness. The ineffective portions and
amounts excluded from the effectiveness testing of cash flow hedges are recognized in other
income/(expense), net. Deferred gains and losses associated with cash flow hedges of interest
income or expense are recognized in other income/(expense), net in the same period as the
related income or expense is recognized (ZHANG and WANG, 2013).
Statement in change in equity position
Changes in the implied vol were removed from either the hedge efficacy test of calls
known as cash flow shrubs. The unsuccessful parts and sums omitted from the liquidity shield
efficacy check are listed in other net income/(cost). Deferred gains or losses connected with
income or cost cash flow hedges were recorded in other income/ (expense), resulting in same
cycle of payment as the applicable income or expenditure. The Group bought back 405.5 million
units of its common shares in conjunction with two different share purchase plans for $73.1
billion in 2018. The new property buyback program of both the Business may not allow it to
acquire any particular number of shares. The Company stated on May 1, 2018 that the
Governing board had approved a program to buy back the Business's common shares of close to
$100 billion.
Combination of definition, calculation and analysis of
each ratio in different categories
Ratio analysis- The term ratio analysis can be defined as a technique in order to assess
monetary efficiency of different types of aspects (Bin, 2013). Under this, a vital range of ratios
are calculated and analysed in a broad manner so that companies overall performance can be
2
analysed. The basic objective of ratio analysis is to assess those aspects in which companies
performance is weaker along with those aspects in that business entity is beating to their
competitors. Herein, it is important to know that variant types of ratios are calculated on the basis
of prepared financial statements. In a descriptive manner, role of ratio analysis is demonstrated
below in such manner:
One of the benefit of ratio analysis is to analyse financial performance of companies in
terms of risk, profitability, solvency & efficiency.
In addition, this is helpful for identifying the risks of firms. It becomes possible because
by calculating and analysing financial leverage ratios, managers become aware about
risks. Another key importance of ratio analysis is that it helps in better planning and forecasting
of firms. This is so because by computing investment ratios, financial managers take
suitable steps in order to assess whether they should make investment in project or not.
From the recent annual report of Apple the following liquidity ratio is discussed below:
Liquidity ratio- It can be defined as a kinds of ratio that is being computed in order to
assess efficiency to make short term debts. Generally, this ratio makes compare between
companies' current assets to its current liabilities. The ideal current ratio is of 2 : 1 that
means a business entity should have almost double amount of current assets for making
payment of short term debts. The liquidity ratio can be categorised into two parts that are
as follows:
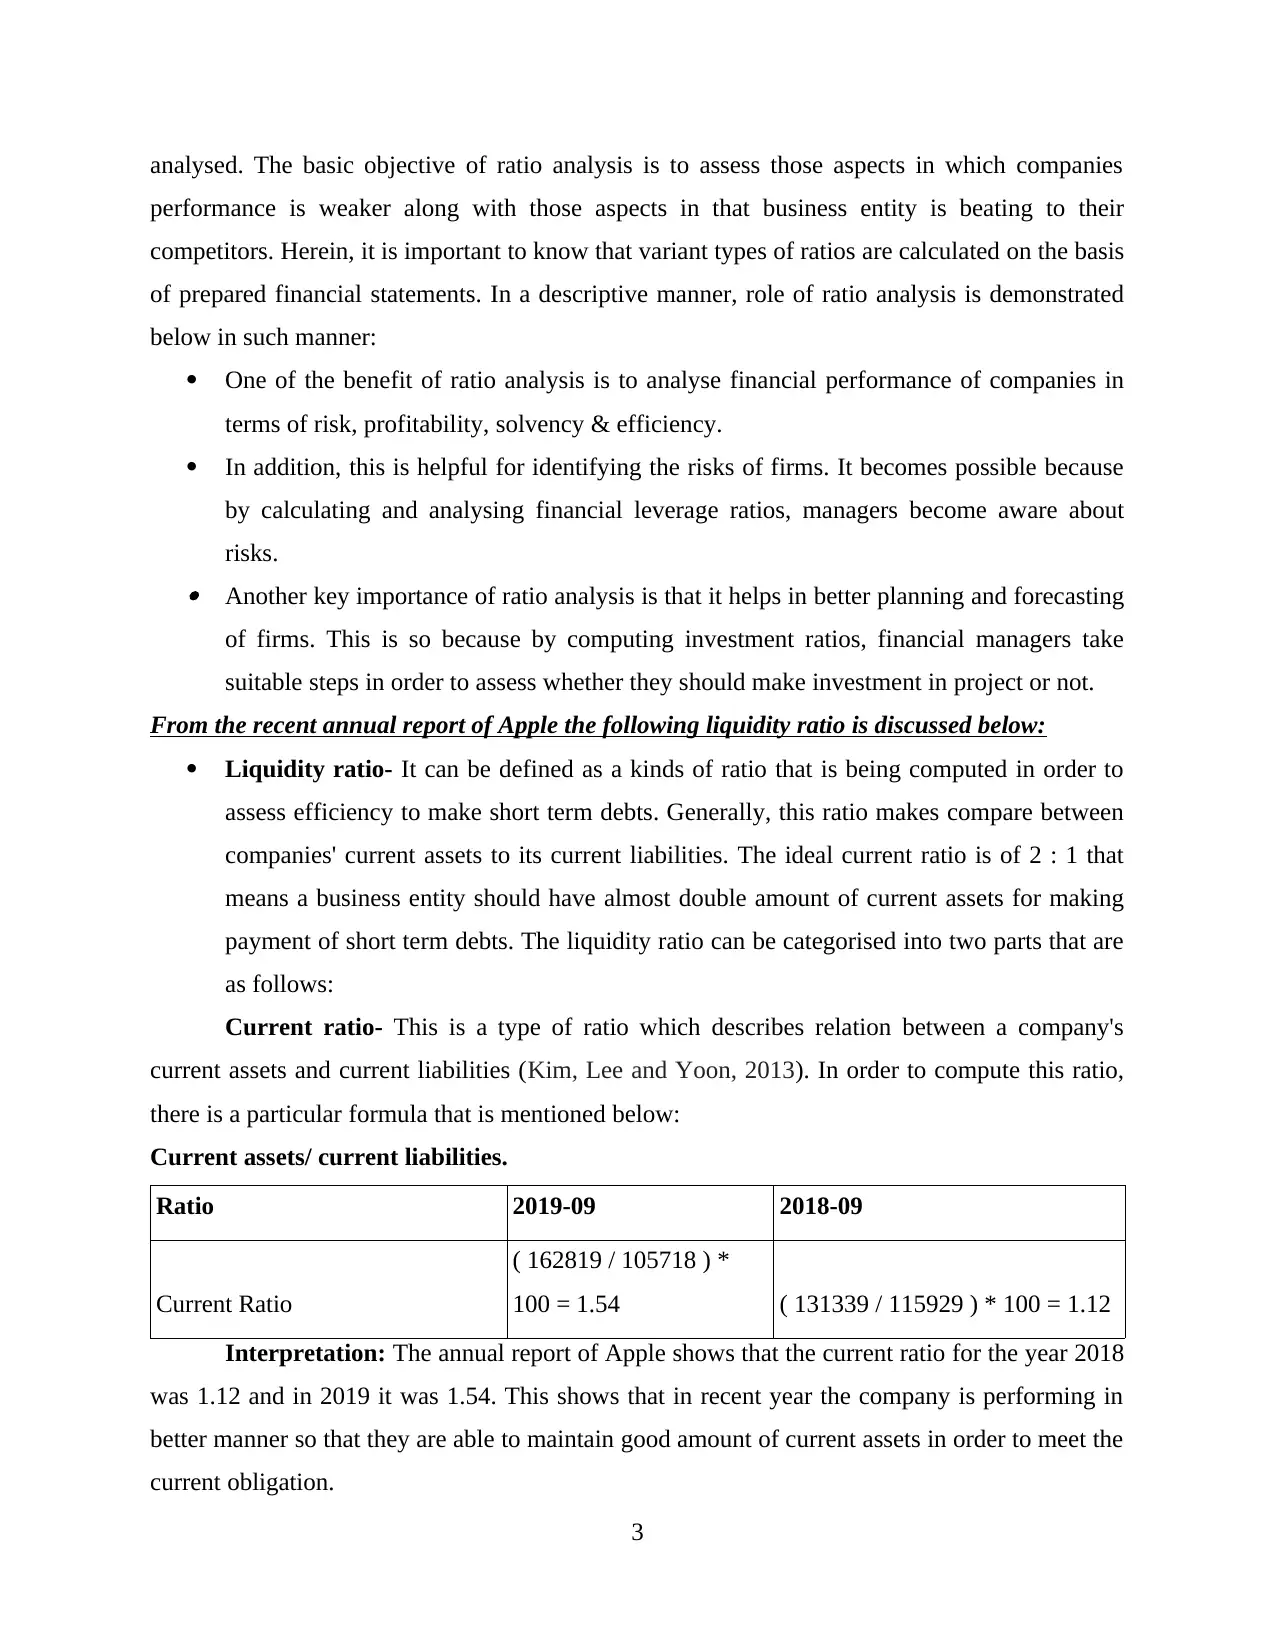
Current ratio- This is a type of ratio which describes relation between a company's
current assets and current liabilities (Kim, Lee and Yoon, 2013). In order to compute this ratio,
there is a particular formula that is mentioned below:
Current assets/ current liabilities.
Ratio 2019-09 2018-09
Current Ratio
( 162819 / 105718 ) *
100 = 1.54 ( 131339 / 115929 ) * 100 = 1.12
Interpretation: The annual report of Apple shows that the current ratio for the year 2018
was 1.12 and in 2019 it was 1.54. This shows that in recent year the company is performing in
better manner so that they are able to maintain good amount of current assets in order to meet the
current obligation.
3
performance is weaker along with those aspects in that business entity is beating to their
competitors. Herein, it is important to know that variant types of ratios are calculated on the basis
of prepared financial statements. In a descriptive manner, role of ratio analysis is demonstrated
below in such manner:
One of the benefit of ratio analysis is to analyse financial performance of companies in
terms of risk, profitability, solvency & efficiency.
In addition, this is helpful for identifying the risks of firms. It becomes possible because
by calculating and analysing financial leverage ratios, managers become aware about
risks. Another key importance of ratio analysis is that it helps in better planning and forecasting
of firms. This is so because by computing investment ratios, financial managers take
suitable steps in order to assess whether they should make investment in project or not.
From the recent annual report of Apple the following liquidity ratio is discussed below:
Liquidity ratio- It can be defined as a kinds of ratio that is being computed in order to
assess efficiency to make short term debts. Generally, this ratio makes compare between
companies' current assets to its current liabilities. The ideal current ratio is of 2 : 1 that
means a business entity should have almost double amount of current assets for making
payment of short term debts. The liquidity ratio can be categorised into two parts that are
as follows:
Current ratio- This is a type of ratio which describes relation between a company's
current assets and current liabilities (Kim, Lee and Yoon, 2013). In order to compute this ratio,
there is a particular formula that is mentioned below:
Current assets/ current liabilities.
Ratio 2019-09 2018-09
Current Ratio
( 162819 / 105718 ) *
100 = 1.54 ( 131339 / 115929 ) * 100 = 1.12
Interpretation: The annual report of Apple shows that the current ratio for the year 2018
was 1.12 and in 2019 it was 1.54. This shows that in recent year the company is performing in
better manner so that they are able to maintain good amount of current assets in order to meet the
current obligation.
3
⊘ This is a preview!⊘
Do you want full access?
Subscribe today to unlock all pages.
Trusted by 1+ million students worldwide
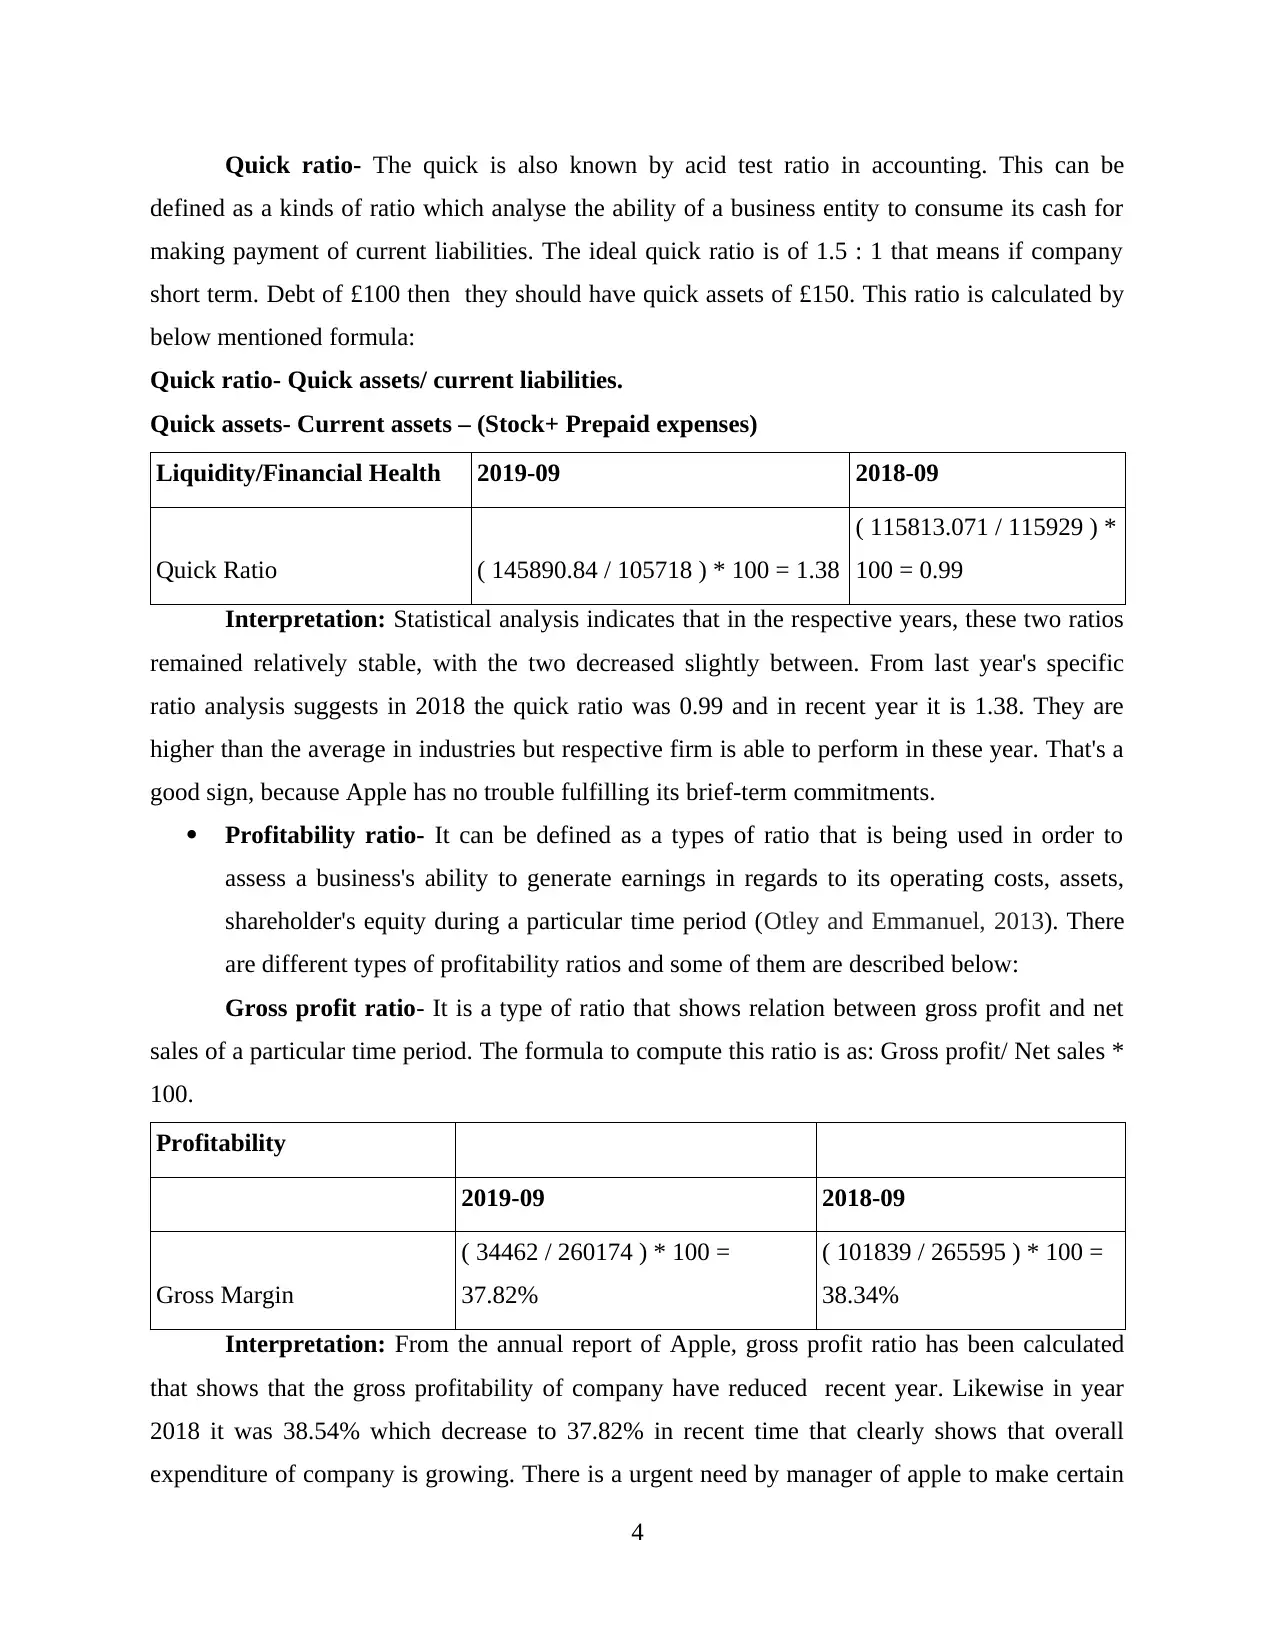
Quick ratio- The quick is also known by acid test ratio in accounting. This can be
defined as a kinds of ratio which analyse the ability of a business entity to consume its cash for
making payment of current liabilities. The ideal quick ratio is of 1.5 : 1 that means if company
short term. Debt of £100 then they should have quick assets of £150. This ratio is calculated by
below mentioned formula:
Quick ratio- Quick assets/ current liabilities.
Quick assets- Current assets – (Stock+ Prepaid expenses)
Liquidity/Financial Health 2019-09 2018-09
Quick Ratio ( 145890.84 / 105718 ) * 100 = 1.38
( 115813.071 / 115929 ) *
100 = 0.99
Interpretation: Statistical analysis indicates that in the respective years, these two ratios
remained relatively stable, with the two decreased slightly between. From last year's specific
ratio analysis suggests in 2018 the quick ratio was 0.99 and in recent year it is 1.38. They are
higher than the average in industries but respective firm is able to perform in these year. That's a
good sign, because Apple has no trouble fulfilling its brief-term commitments.
Profitability ratio- It can be defined as a types of ratio that is being used in order to
assess a business's ability to generate earnings in regards to its operating costs, assets,
shareholder's equity during a particular time period (Otley and Emmanuel, 2013). There
are different types of profitability ratios and some of them are described below:
Gross profit ratio- It is a type of ratio that shows relation between gross profit and net
sales of a particular time period. The formula to compute this ratio is as: Gross profit/ Net sales *
100.
Profitability
2019-09 2018-09
Gross Margin
( 34462 / 260174 ) * 100 =
37.82%
( 101839 / 265595 ) * 100 =
38.34%
Interpretation: From the annual report of Apple, gross profit ratio has been calculated
that shows that the gross profitability of company have reduced recent year. Likewise in year
2018 it was 38.54% which decrease to 37.82% in recent time that clearly shows that overall
expenditure of company is growing. There is a urgent need by manager of apple to make certain
4
Paraphrase This Document
Need a fresh take? Get an instant paraphrase of this document with our AI Paraphraser
policies in order to lower expenses like purchase raw material at lower price which will grow
gross profit.
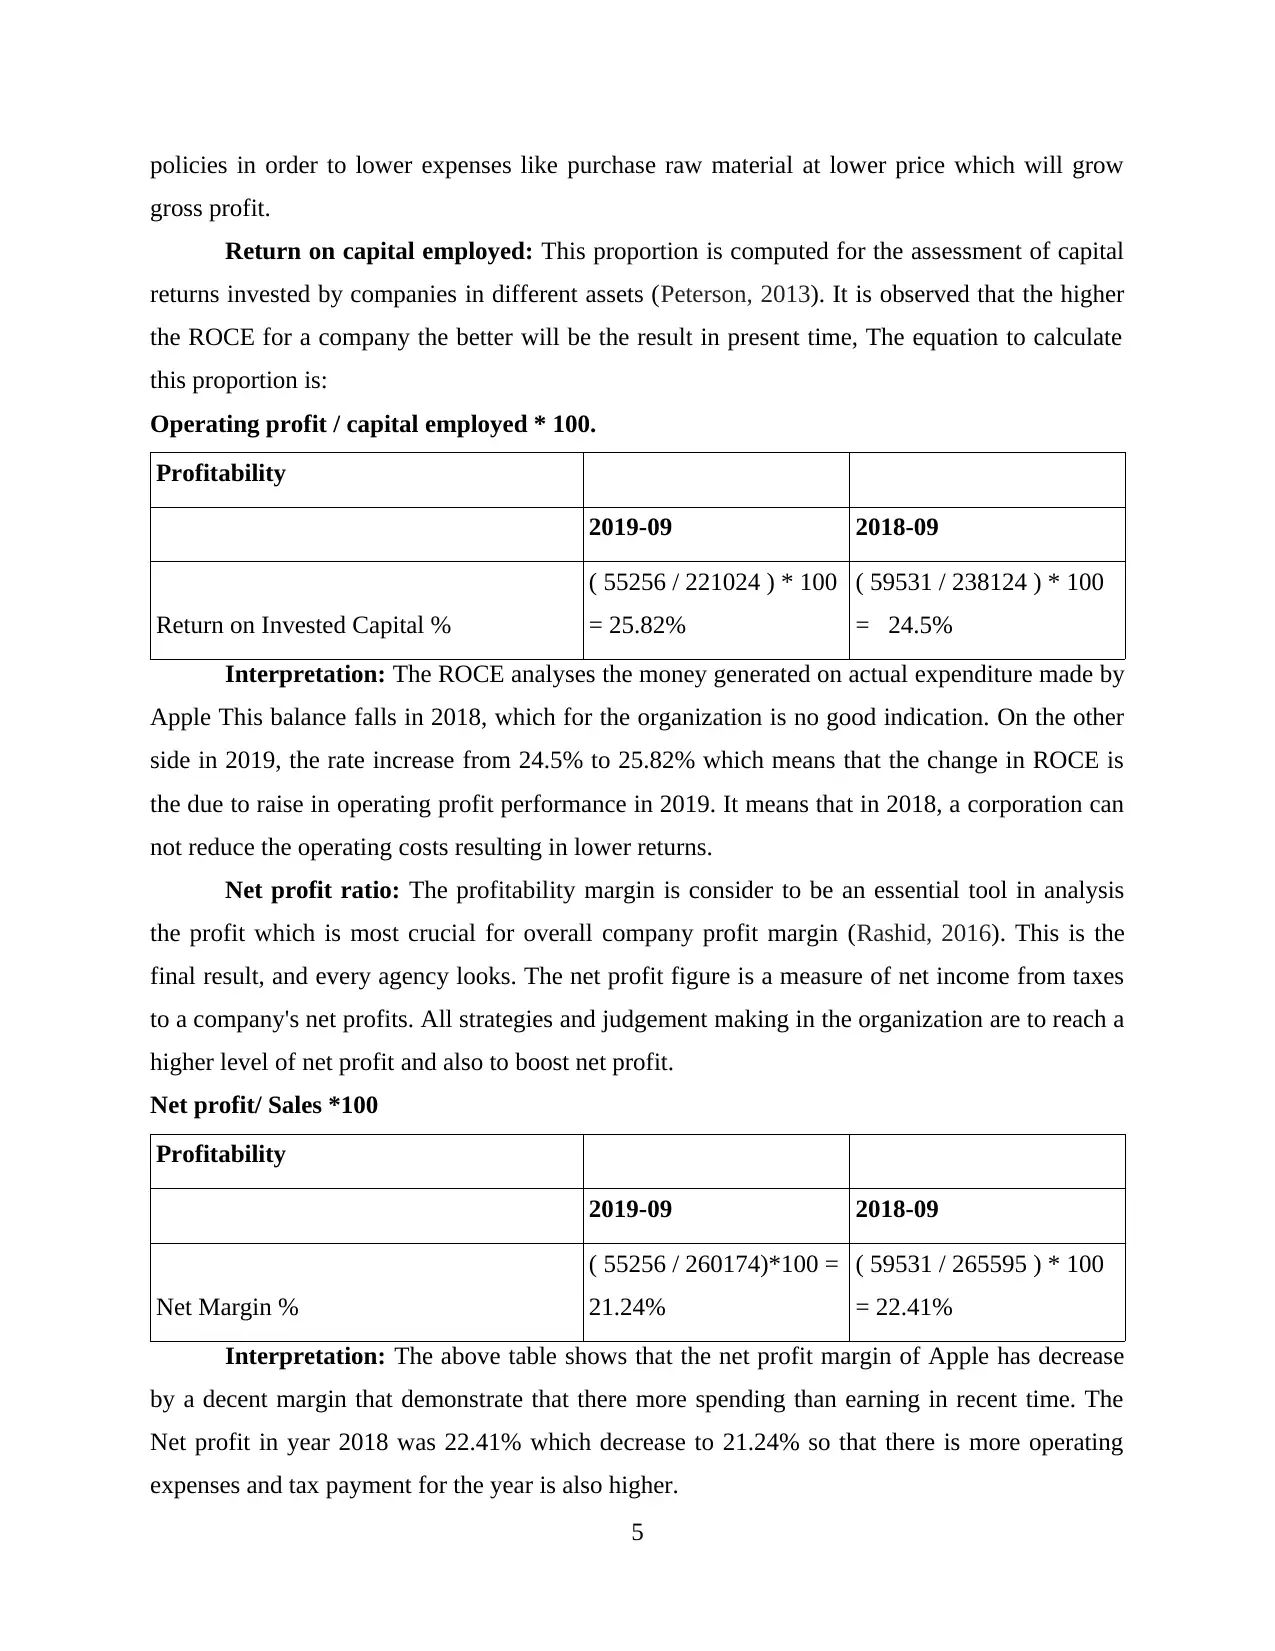
Return on capital employed: This proportion is computed for the assessment of capital
returns invested by companies in different assets (Peterson, 2013). It is observed that the higher
the ROCE for a company the better will be the result in present time, The equation to calculate
this proportion is:
Operating profit / capital employed * 100.
Profitability
2019-09 2018-09
Return on Invested Capital %
( 55256 / 221024 ) * 100
= 25.82%
( 59531 / 238124 ) * 100
= 24.5%
Interpretation: The ROCE analyses the money generated on actual expenditure made by
Apple This balance falls in 2018, which for the organization is no good indication. On the other
side in 2019, the rate increase from 24.5% to 25.82% which means that the change in ROCE is
the due to raise in operating profit performance in 2019. It means that in 2018, a corporation can
not reduce the operating costs resulting in lower returns.
Net profit ratio: The profitability margin is consider to be an essential tool in analysis
the profit which is most crucial for overall company profit margin (Rashid, 2016). This is the
final result, and every agency looks. The net profit figure is a measure of net income from taxes
to a company's net profits. All strategies and judgement making in the organization are to reach a
higher level of net profit and also to boost net profit.
Net profit/ Sales *100
Profitability
2019-09 2018-09
Net Margin %
( 55256 / 260174)*100 =
21.24%
( 59531 / 265595 ) * 100
= 22.41%
Interpretation: The above table shows that the net profit margin of Apple has decrease
by a decent margin that demonstrate that there more spending than earning in recent time. The
Net profit in year 2018 was 22.41% which decrease to 21.24% so that there is more operating
expenses and tax payment for the year is also higher.
5
gross profit.
Return on capital employed: This proportion is computed for the assessment of capital
returns invested by companies in different assets (Peterson, 2013). It is observed that the higher
the ROCE for a company the better will be the result in present time, The equation to calculate
this proportion is:
Operating profit / capital employed * 100.
Profitability
2019-09 2018-09
Return on Invested Capital %
( 55256 / 221024 ) * 100
= 25.82%
( 59531 / 238124 ) * 100
= 24.5%
Interpretation: The ROCE analyses the money generated on actual expenditure made by
Apple This balance falls in 2018, which for the organization is no good indication. On the other
side in 2019, the rate increase from 24.5% to 25.82% which means that the change in ROCE is
the due to raise in operating profit performance in 2019. It means that in 2018, a corporation can
not reduce the operating costs resulting in lower returns.
Net profit ratio: The profitability margin is consider to be an essential tool in analysis
the profit which is most crucial for overall company profit margin (Rashid, 2016). This is the
final result, and every agency looks. The net profit figure is a measure of net income from taxes
to a company's net profits. All strategies and judgement making in the organization are to reach a
higher level of net profit and also to boost net profit.
Net profit/ Sales *100
Profitability
2019-09 2018-09
Net Margin %
( 55256 / 260174)*100 =
21.24%
( 59531 / 265595 ) * 100
= 22.41%
Interpretation: The above table shows that the net profit margin of Apple has decrease
by a decent margin that demonstrate that there more spending than earning in recent time. The
Net profit in year 2018 was 22.41% which decrease to 21.24% so that there is more operating
expenses and tax payment for the year is also higher.
5
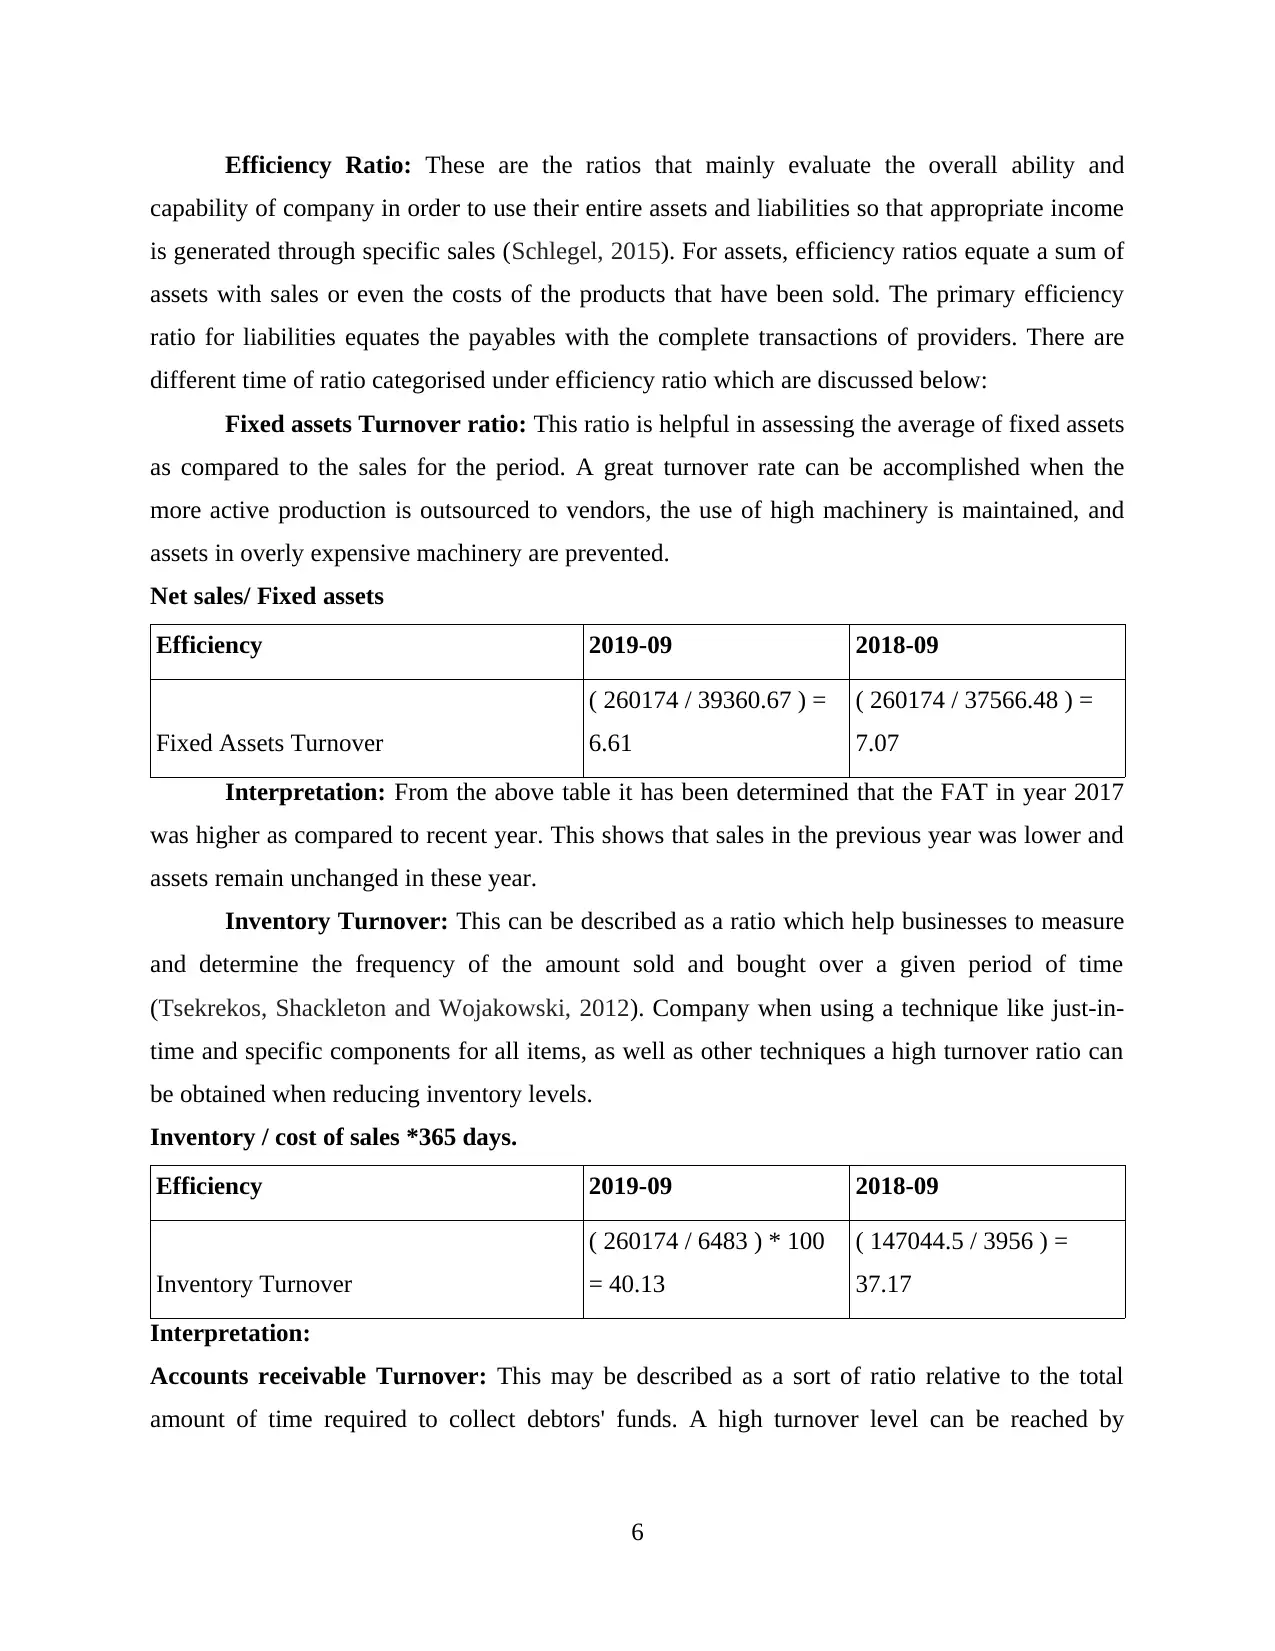
Efficiency Ratio: These are the ratios that mainly evaluate the overall ability and
capability of company in order to use their entire assets and liabilities so that appropriate income
is generated through specific sales (Schlegel, 2015). For assets, efficiency ratios equate a sum of
assets with sales or even the costs of the products that have been sold. The primary efficiency
ratio for liabilities equates the payables with the complete transactions of providers. There are
different time of ratio categorised under efficiency ratio which are discussed below:
Fixed assets Turnover ratio: This ratio is helpful in assessing the average of fixed assets
as compared to the sales for the period. A great turnover rate can be accomplished when the
more active production is outsourced to vendors, the use of high machinery is maintained, and
assets in overly expensive machinery are prevented.
Net sales/ Fixed assets
Efficiency 2019-09 2018-09
Fixed Assets Turnover
( 260174 / 39360.67 ) =
6.61
( 260174 / 37566.48 ) =
7.07
Interpretation: From the above table it has been determined that the FAT in year 2017
was higher as compared to recent year. This shows that sales in the previous year was lower and
assets remain unchanged in these year.
Inventory Turnover: This can be described as a ratio which help businesses to measure
and determine the frequency of the amount sold and bought over a given period of time
(Tsekrekos, Shackleton and Wojakowski, 2012). Company when using a technique like just-in-
time and specific components for all items, as well as other techniques a high turnover ratio can
be obtained when reducing inventory levels.
Inventory / cost of sales *365 days.
Efficiency 2019-09 2018-09
Inventory Turnover
( 260174 / 6483 ) * 100
= 40.13
( 147044.5 / 3956 ) =
37.17
Interpretation:
Accounts receivable Turnover: This may be described as a sort of ratio relative to the total
amount of time required to collect debtors' funds. A high turnover level can be reached by
6
⊘ This is a preview!⊘
Do you want full access?
Subscribe today to unlock all pages.
Trusted by 1+ million students worldwide
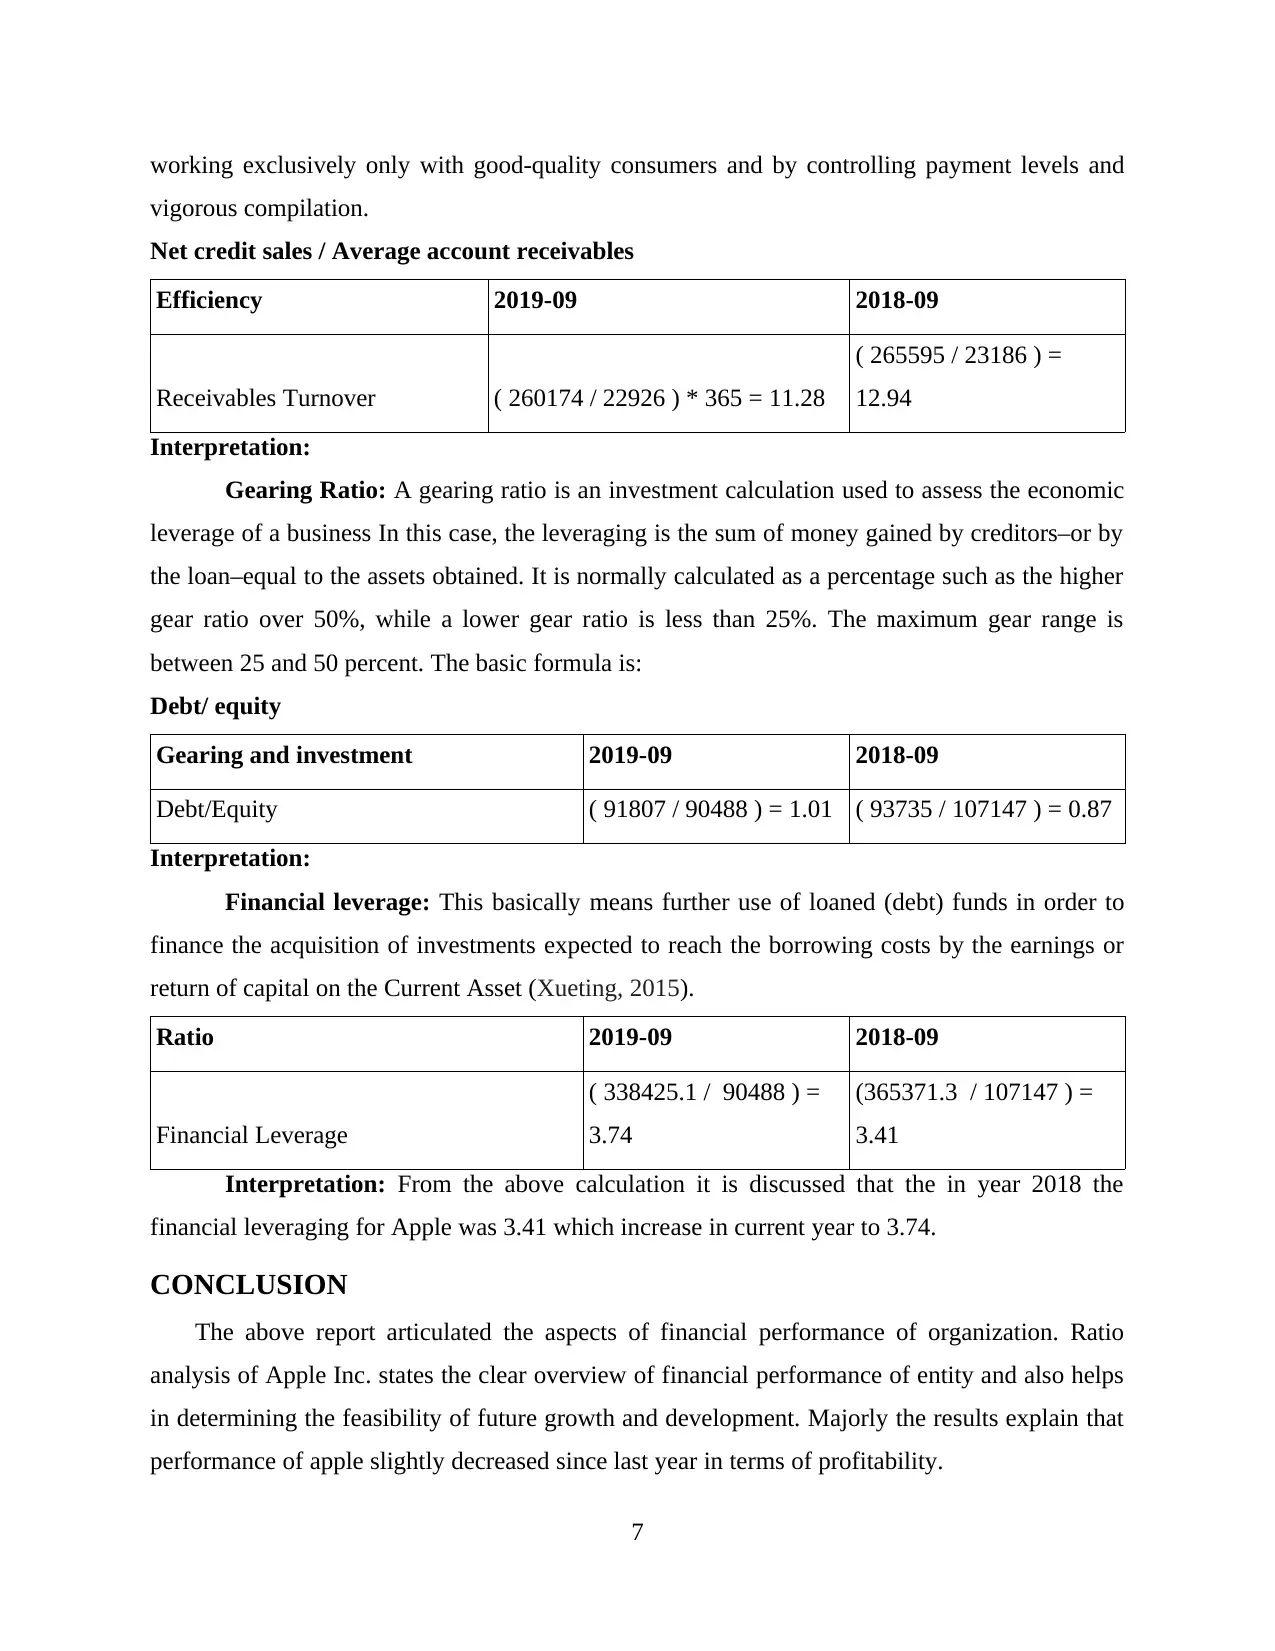
working exclusively only with good-quality consumers and by controlling payment levels and
vigorous compilation.
Net credit sales / Average account receivables
Efficiency 2019-09 2018-09
Receivables Turnover ( 260174 / 22926 ) * 365 = 11.28
( 265595 / 23186 ) =
12.94
Interpretation:
Gearing Ratio: A gearing ratio is an investment calculation used to assess the economic
leverage of a business In this case, the leveraging is the sum of money gained by creditors–or by
the loan–equal to the assets obtained. It is normally calculated as a percentage such as the higher
gear ratio over 50%, while a lower gear ratio is less than 25%. The maximum gear range is
between 25 and 50 percent. The basic formula is:
Debt/ equity
Gearing and investment 2019-09 2018-09
Debt/Equity ( 91807 / 90488 ) = 1.01 ( 93735 / 107147 ) = 0.87
Interpretation:
Financial leverage: This basically means further use of loaned (debt) funds in order to
finance the acquisition of investments expected to reach the borrowing costs by the earnings or
return of capital on the Current Asset (Xueting, 2015).
Ratio 2019-09 2018-09
Financial Leverage
( 338425.1 / 90488 ) =
3.74
(365371.3 / 107147 ) =
3.41
Interpretation: From the above calculation it is discussed that the in year 2018 the
financial leveraging for Apple was 3.41 which increase in current year to 3.74.
CONCLUSION
The above report articulated the aspects of financial performance of organization. Ratio
analysis of Apple Inc. states the clear overview of financial performance of entity and also helps
in determining the feasibility of future growth and development. Majorly the results explain that
performance of apple slightly decreased since last year in terms of profitability.
7
Paraphrase This Document
Need a fresh take? Get an instant paraphrase of this document with our AI Paraphraser

8
REFERENCERS
Books and Journals:
Bin, L. I., 2013. Managerial Power, Over-investment and Corporate Value: The Analysis Based
on the Theory of Centralization and Decentralization. Collected Essays on Finance and
Economics, (6), p.11.
Kim, S., Lee, C. and Yoon, S. W., 2013. Goodwill accounting and asymmetric timeliness of
earnings. Review of Accounting and Finance.
Otley, D. and Emmanuel, K.M.C., 2013. Readings in accounting for management control.
Springer.
Peterson, S. J., 2013. Construction accounting and financial management (Vol. 2). Upper Saddle
River, NJ: Pearson.
Rashid, A., 2016. Managerial ownership and agency cost: evidence from Bangladesh. Journal of
business ethics. 137(3). pp.609-621.
Schlegel, D., 2015. Background: Cost-of-capital in the finance literature. In Cost-of-Capital in
Managerial Finance (pp. 9-70). Springer, Cham.
Tsekrekos, A. E., Shackleton, M. B. and Wojakowski, R., 2012. Evaluating natural resource
investments under different model dynamics: Managerial insights. European Financial
Management. 18(4). pp.543-575.
Xueting, W.A.N.G., 2015. Problems of Chinese Managerial Accounting and Countermeasures
under Stakeholder Theory. Journal of Zhengzhou Railway Vocational and Technical
College, (3), p.10.
Yin, K. G., Wang, Y. Y. and Liu, X. Q., 2014. Nature of property rights, managerial ownership
and social responsibility information disclosure—Evidence from Chinese listed
companies. Res. Econ. Manage. 9. pp.114-120.
ZHANG, H. H. and WANG, Y., 2013. State Ownership, Managerial Power and Perks. Journal
of Fujian Jiangxia University. 3.
9
⊘ This is a preview!⊘
Do you want full access?
Subscribe today to unlock all pages.
Trusted by 1+ million students worldwide
1 out of 12
Related Documents


Your All-in-One AI-Powered Toolkit for Academic Success.
+13062052269
info@desklib.com
Available 24*7 on WhatsApp / Email
![[object Object]](/_next/static/media/star-bottom.7253800d.svg)
Unlock your academic potential
Copyright © 2020–2026 A2Z Services. All Rights Reserved. Developed and managed by ZUCOL.