Analysis of Apple Inc.'s Financial Ratios Compared to Tech Industry
VerifiedAdded on  2019/09/21
|4
|1182
|240
Report
AI Summary
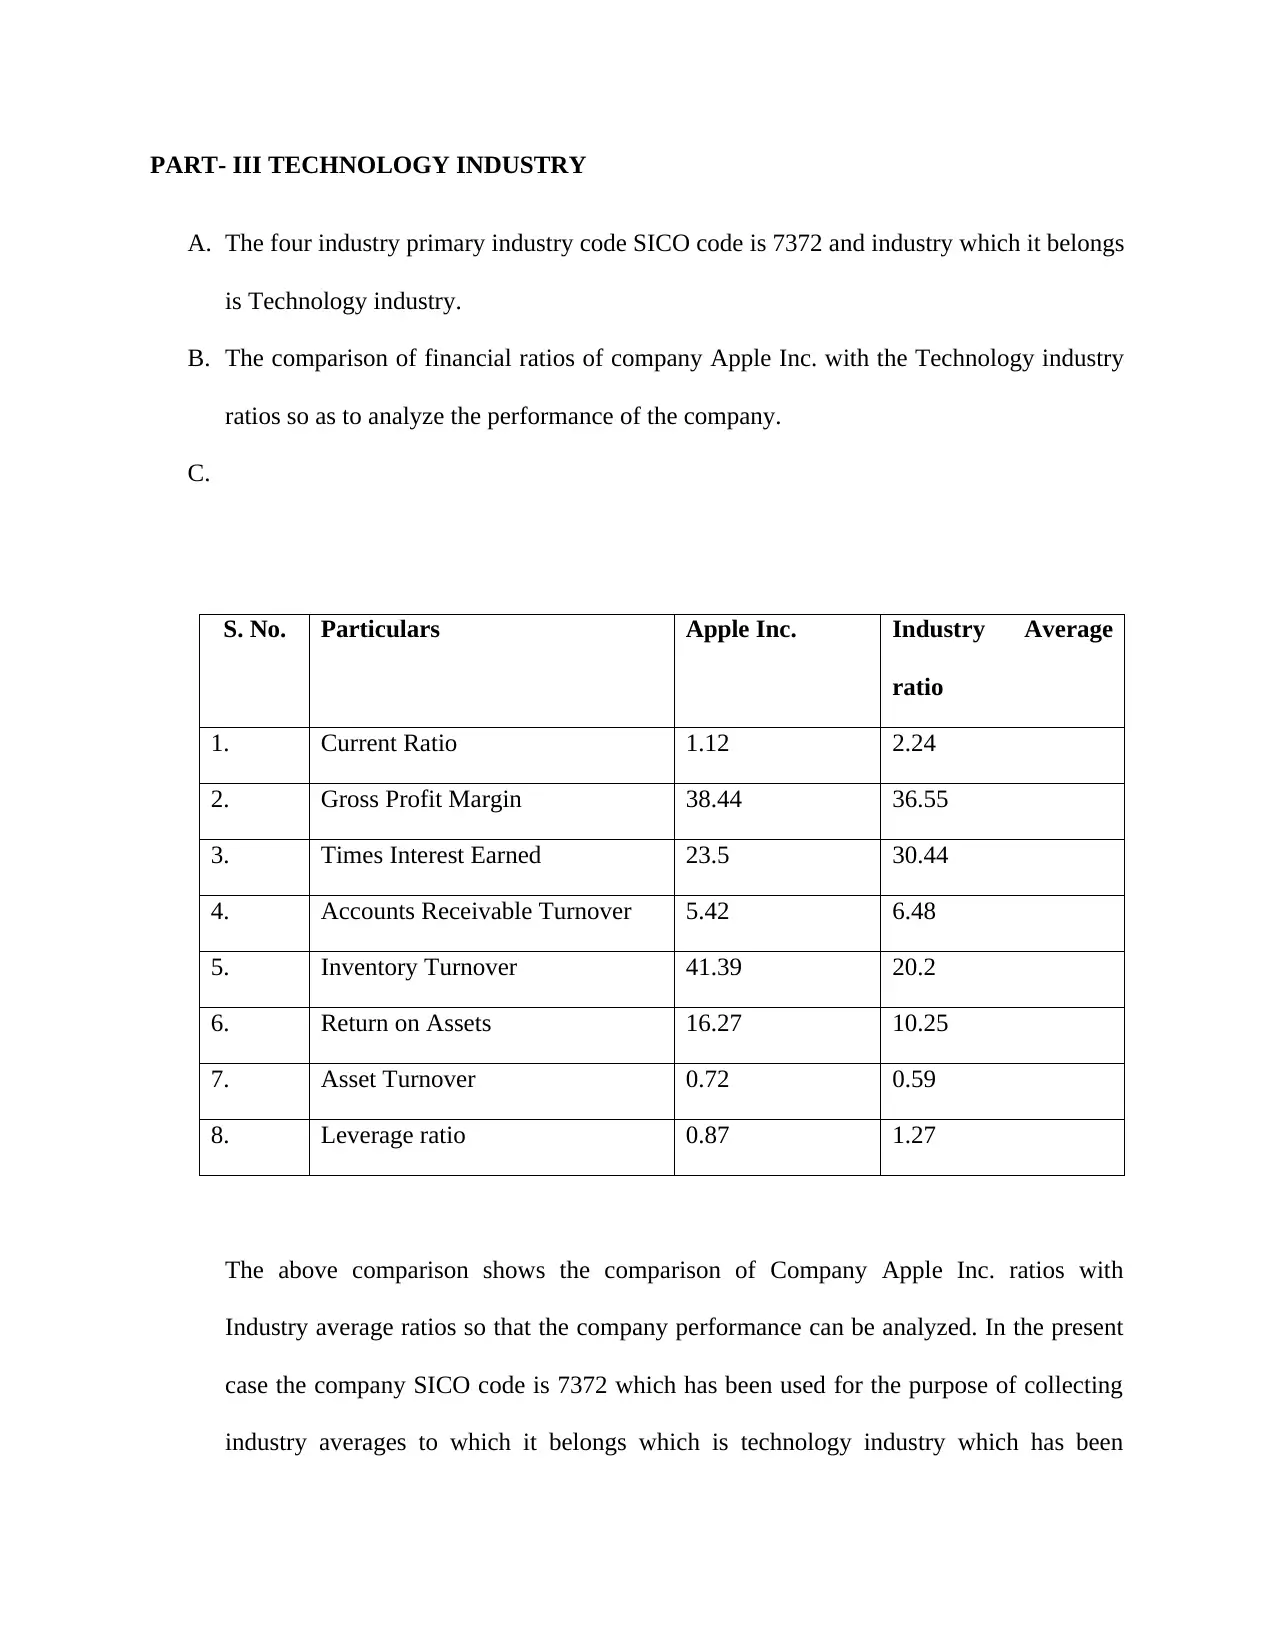
This report presents a financial ratio analysis comparing Apple Inc.'s performance against the technology industry average. The analysis covers key financial ratios such as current ratio, gross profit margin, times interest earned, accounts receivable turnover, inventory turnover, return on assets, asset turnover, and leverage ratio. The comparison highlights Apple Inc.'s strengths in profitability and efficiency, as indicated by its gross profit margin, return on assets, and inventory turnover, which are better than industry averages. However, the analysis also reveals areas for improvement, such as liquidity and the times interest earned ratio, where Apple Inc. falls short of industry benchmarks. The report emphasizes the importance of financial ratio analysis in evaluating a company's overall financial health, including its liquidity, solvency, and profitability, and its reliance on external funding. Overall, the report concludes that while Apple Inc. demonstrates strong performance in several areas, addressing its liquidity and debt management is crucial for sustained growth and market position.

PART- III TECHNOLOGY INDUSTRY
A. The four industry primary industry code SICO code is 7372 and industry which it belongs
is Technology industry.
B. The comparison of financial ratios of company Apple Inc. with the Technology industry
ratios so as to analyze the performance of the company.
C.
S. No. Particulars Apple Inc. Industry Average
ratio
1. Current Ratio 1.12 2.24
2. Gross Profit Margin 38.44 36.55
3. Times Interest Earned 23.5 30.44
4. Accounts Receivable Turnover 5.42 6.48
5. Inventory Turnover 41.39 20.2
6. Return on Assets 16.27 10.25
7. Asset Turnover 0.72 0.59
8. Leverage ratio 0.87 1.27
The above comparison shows the comparison of Company Apple Inc. ratios with
Industry average ratios so that the company performance can be analyzed. In the present
case the company SICO code is 7372 which has been used for the purpose of collecting
industry averages to which it belongs which is technology industry which has been
Paraphrase This Document
Need a fresh take? Get an instant paraphrase of this document with our AI Paraphraser

calculated by taking the average of the ratio of all the companies in the industry so that it
can be standard benchmark which can be utilized to compare with the industry data.
In the present case the comparison of current ratio states that while the company ratio is
1.12 and the industry average ratio is 2.24 which involves the following company like
Microsoft Corp., Oracle Corp, Adobe System Corp. etc. which shows that the company
ratio is weaker than the industry average which tells us that the liquidity position of
Apple Inc. is less than Industry average and have to focus on increasing the liquidity
position of the company. The other ratio which is Gross Profit margin which states that
the profitability of the company from the Sale of Product / Services which in the present
case has been 38.44 of the company while the industry average is 36.22 which shows that
the performance of the company with respect to Industry Average is better. The Time
interest earned ratio tells us that the no. of times the profits are available to cover the
interest expense which is 23.5 in case of company and industry average is around 30.44
which shows the company ratio is weaker as compared to industry averages and have to
work more in future in order to improve its position in order to increase its profits.
The ratio which is Accounts receivable Turnover ratio tells us the no. of times the
company collects its average account receivable in a period which tell us that the higher
the ratio the more favorable it is for company which is 5.42 in case of company and 6.48
in case of industry average which shows that the efficiency of the company in collecting
its receivable is weak in comparison to industry but the highest of the ratio among the
industry the company has is Intuit Inc. which is 49.07.
Inventory turnover ratio is efficiency ratio which tells us that the no. of times of the
company is able to sell its inventory during a period and higher ratio implies more

favorable to the company which in the present case is 41.39 of the company and 20.2 is
the industry average which shows that the company performance is better than those of
the industry and other companies also within the industry which have higher inventory
turnover ratio is Activision Blizzard Inc. which has 52.65 that is the one among the
companies which has high inventory turnover ratio. The return on assets ratio tell us the
return that the company is earning on the assets employed in the company and the higher
the ratio the more favorable is for the company which is 16.27 of the company and 10.25
of the industry average so it shows that the company performance is better in comparison
to industry which it belongs and the ratio tells us that the return earned on per rupee of
asset employed in the company.
Asset turnover ratio is an indicator of company efficiency with respect to asset it has
employed in the company and higher ratio implies more efficient a company is and lower
ratio implies the less efficient the company is which in the present case of company is
0.72 and in case of industry average is 0.59 which shows that the company efficiency is
better the industry average.
Financial leverage ratio tells us that the Debt of the company in comparison to overall
assets employed by the company which in case of company is 0.87 and in case of
industry average is 1.27 which shows that the company is in better position in
comparison to industry to which it belongs as the proportion of debt in comparison to
assets of the company is less than industry average which shows the company
dependency on the outside funds of the company.
All the above ratios show the company performance in comparison to its industry average
so that the performance in terms of profitability, liquidity and solvency so that the correct
⊘ This is a preview!⊘
Do you want full access?
Subscribe today to unlock all pages.

Trusted by 1+ million students worldwide

steps can be taken so as to improve its position in future. The above ratio shows that the
efficiency of the company is good in comparison to industry average while the liquidity
of the company is weaker in comparison to the industry so it has to take some steps so as
to increase its liquidity position. The profitability of the company is increasing year by
year and has captured a large share in the market which has increased its position among
the industry. Apple Inc. in the past years was able to increase its sale and has entered into
various ranges of products and service which has increased its customer base. The
company has to work more in order to improve its liquidity position as no. of times the
profits available to cover interest is less the industry average which shows that the
company has to work more and in future the dependence of the company on outside
funds has to be reduced. The ratio analysis helps us to compare company from different
parameters so as to analysis the company from every aspect and which also helps in
evaluating financial position of the company and also on how much the company is
dependent on outside funds for its operation and also it also helps to analyze the return it
provides to the shareholders of the company on the funds they have employed in the
company as a means of analyzing return on the funds invested. The ratio analysis helps us
to analyze the company in correct way because some companies in spite of higher sales
suffer a loss and ratio analyze helps us to analyze the reason by calculation different
ratios. In the present case of company overall ratio analysis tells us that the company is in
a better position overall while there is some adverse ratio also which the company has to
work on in order to improve its position in future.
1 out of 4
Related Documents

Your All-in-One AI-Powered Toolkit for Academic Success.
 +13062052269
info@desklib.com
Available 24*7 on WhatsApp / Email
Unlock your academic potential
© 2024  |  Zucol Services PVT LTD  |  All rights reserved.