Apple Inc. Investment Management Case Study and Analysis
VerifiedAdded on 2023/05/28
|20
|4073
|481
Project
AI Summary
This project presents an investment case study of Apple Inc., evaluating its performance in 2018. The analysis includes an introduction, investment case, sector outlook, fundamental analysis (including financial ratios, and technical analysis), and risk analysis. The investment case highlights Apple's increasing share price and dividend growth, while the sector outlook examines the positive economic conditions of the US and the growth within the technology sector. Fundamental analysis uses financial ratios to assess liquidity, profitability, and efficiency. The project also includes risk assessment and concludes with an overall investment recommendation for Apple Inc.
Running head: INVESTMENT MANAGEMENT
Investment Management
Name of the Student:
Name of the University:
Authors Note:
Investment Management
Name of the Student:
Name of the University:
Authors Note:
Paraphrase This Document
Need a fresh take? Get an instant paraphrase of this document with our AI Paraphraser
INVESTMENT MANAGEMENT 2
Table of Contents
1. Introduction:...........................................................................................................................3
2. Investment Case:....................................................................................................................3
3. Sector Outlook:......................................................................................................................6
4. Fundamental Analysis:.........................................................................................................10
4.1 Financial Ratios:.................................................................................................................10
4.2 Fundamental Analysis:.......................................................................................................12
4.3 Technical Analysis:............................................................................................................14
5. Risk Analysis:......................................................................................................................15
6. Conclusion:..........................................................................................................................17
Reference and Bibliography:....................................................................................................18
INVESTMENT MANAGEMENT 3
1. Introduction:
The assessment aims in evaluating the performance of Apple Inc for the fiscal year of
2018. The performance is relatively evaluated with the help of financial ratios such as
liquidity, profitability and efficiency ratio. Furthermore, technical analysis is used for
analyzing the current financial trend of the company and determine whether the price will fall
or increase over time. In addition, the calculations are also conducted for the fundamental
analysis, which uses dividend discount model for analyzing the theoretical price of the stock
and comparing it with the current share price. Further evaluation is conducted on quantitative
and qualitative risk analysis for Apple Inc, which can eventually help in detecting the
strength, weakness, threat and opportunities for the company. The assessment provides
relevant information regarding the current stock prices and investment case, which can allow
investors to generate higher income over the period. Lastly, the evaluation has been
conducted on the economic condition of US to determine the impact it might have on the
performance of the Apple Inc.
2. Investment Case:
The stock selected for investment purpose is Apple Inc, as the organisation has been
generating high level of income over the period of time. In addition, the share price of Apple
Inc. has relevantly increased over the fiscal years, due to the improvements, which can be
achieved in previous fiscal years. Uechi et al. (2015) indicated that investors carefully sort
stocks for investment with the help of fundamental and technical analysis, which allows them
to make calculate investment decisions. The company has also increased the level of
dividends for each fiscal year, which can eventually help in generating high level of income
over for the investors. Apple Inc is considered a safe-haven for the investors, as it allows
⊘ This is a preview!⊘
Do you want full access?
Subscribe today to unlock all pages.
Trusted by 1+ million students worldwide
INVESTMENT MANAGEMENT 4
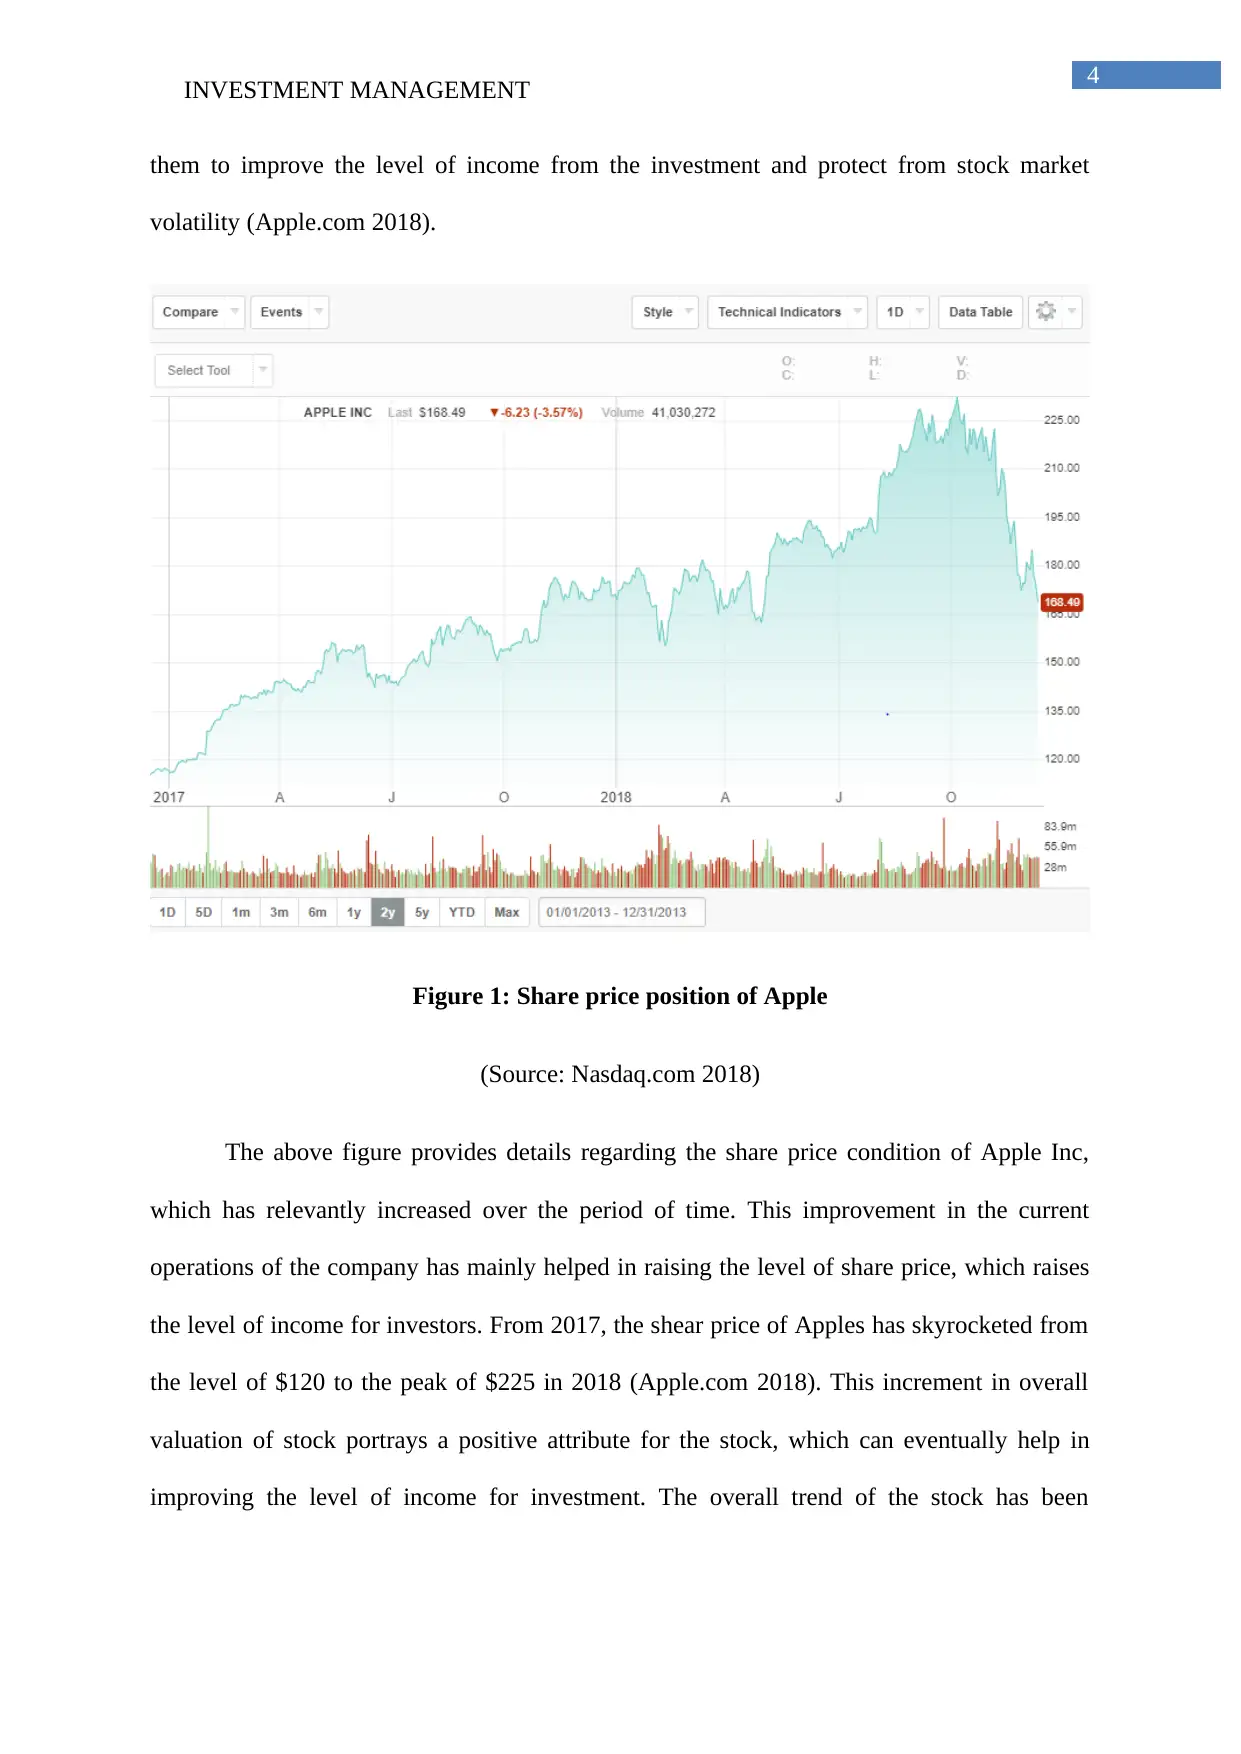
them to improve the level of income from the investment and protect from stock market
volatility (Apple.com 2018).
Figure 1: Share price position of Apple
(Source: Nasdaq.com 2018)
The above figure provides details regarding the share price condition of Apple Inc,
which has relevantly increased over the period of time. This improvement in the current
operations of the company has mainly helped in raising the level of share price, which raises
the level of income for investors. From 2017, the shear price of Apples has skyrocketed from
the level of $120 to the peak of $225 in 2018 (Apple.com 2018). This increment in overall
valuation of stock portrays a positive attribute for the stock, which can eventually help in
improving the level of income for investment. The overall trend of the stock has been
Paraphrase This Document
Need a fresh take? Get an instant paraphrase of this document with our AI Paraphraser
INVESTMENT MANAGEMENT 5
considered a positive and up, which is an optimistic factor for investors considering the
investment in Apple Inc.
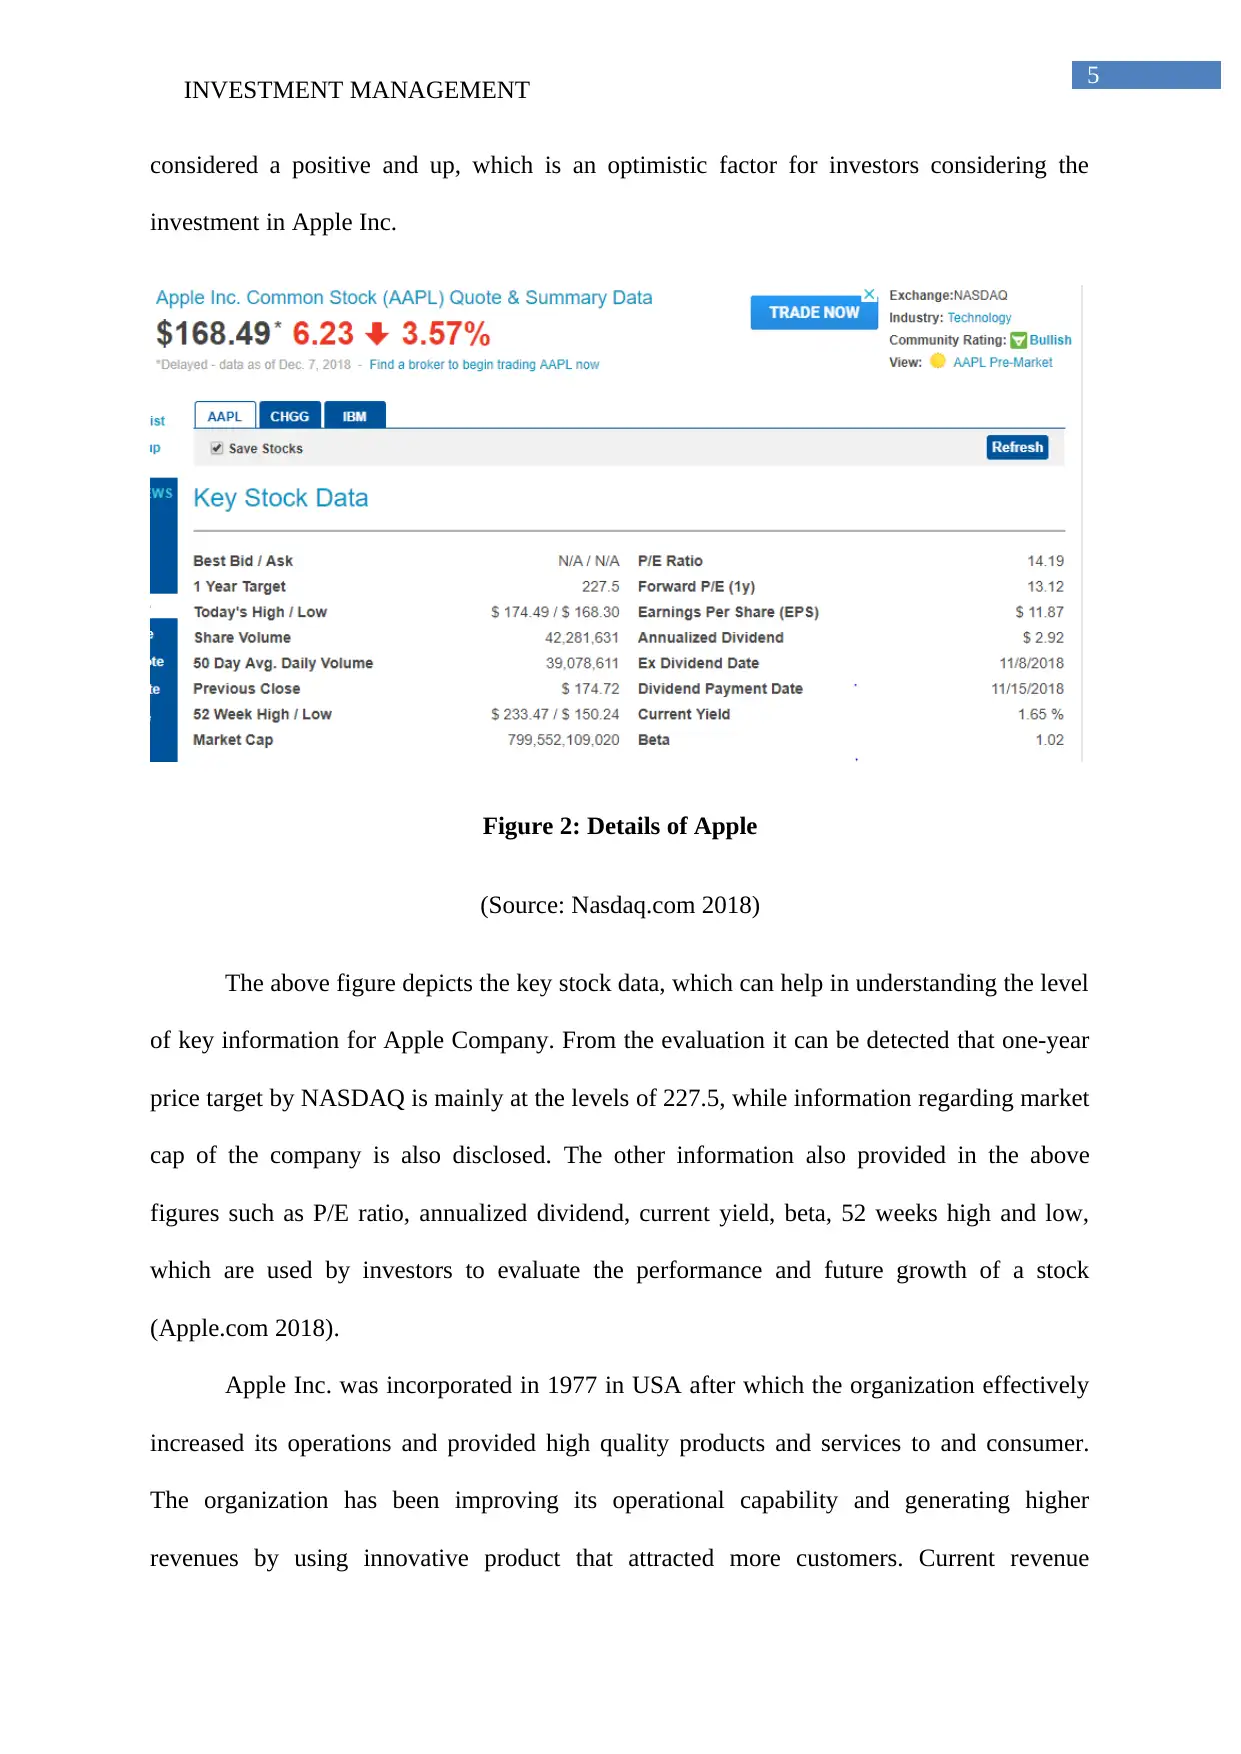
Figure 2: Details of Apple
(Source: Nasdaq.com 2018)
The above figure depicts the key stock data, which can help in understanding the level
of key information for Apple Company. From the evaluation it can be detected that one-year
price target by NASDAQ is mainly at the levels of 227.5, while information regarding market
cap of the company is also disclosed. The other information also provided in the above
figures such as P/E ratio, annualized dividend, current yield, beta, 52 weeks high and low,
which are used by investors to evaluate the performance and future growth of a stock
(Apple.com 2018).
Apple Inc. was incorporated in 1977 in USA after which the organization effectively
increased its operations and provided high quality products and services to and consumer.
The organization has been improving its operational capability and generating higher
revenues by using innovative product that attracted more customers. Current revenue
considered a positive and up, which is an optimistic factor for investors considering the
investment in Apple Inc.
Figure 2: Details of Apple
(Source: Nasdaq.com 2018)
The above figure depicts the key stock data, which can help in understanding the level
of key information for Apple Company. From the evaluation it can be detected that one-year
price target by NASDAQ is mainly at the levels of 227.5, while information regarding market
cap of the company is also disclosed. The other information also provided in the above
figures such as P/E ratio, annualized dividend, current yield, beta, 52 weeks high and low,
which are used by investors to evaluate the performance and future growth of a stock
(Apple.com 2018).
Apple Inc. was incorporated in 1977 in USA after which the organization effectively
increased its operations and provided high quality products and services to and consumer.
The organization has been improving its operational capability and generating higher
revenues by using innovative product that attracted more customers. Current revenue
INVESTMENT MANAGEMENT 6
generation capability of the company is mainly are the levels of $265.595 Billion with a net
income of $59.53 Billion during the fiscal year of 2018 (Apple.com 2018). This incremental
revenues and net income of the company has a relatively improved the level of dividends that
could be provided to investors. The growth that has been witnessed by the organization over
the previous Physical use can eventually allow investors to increase returns and secure their
Investments from negative market volatility.
3. Sector Outlook:
The sector outlook analysis relevantly helps in detecting the overall stocks, which can
improve investors return generation capability. In addition, from the evaluation it can be
detected that investors use the sector outlook for analyzing the trend and opportunity for
investments in a particular organization. From the overall evaluation, it can be detected that
US has been one of the highest returns generating countries all around the world due to this
large market cap and GDP. Hence, investment in the companies originated from the country
would be beneficial for the organization for generating high level of income over the period
of time. Scarborough (2016) mentioned that industry analysis allows investor to understand
the level of investment opportunities, which can help in generating high level of income from
investment.
⊘ This is a preview!⊘
Do you want full access?
Subscribe today to unlock all pages.
Trusted by 1+ million students worldwide
INVESTMENT MANAGEMENT 7
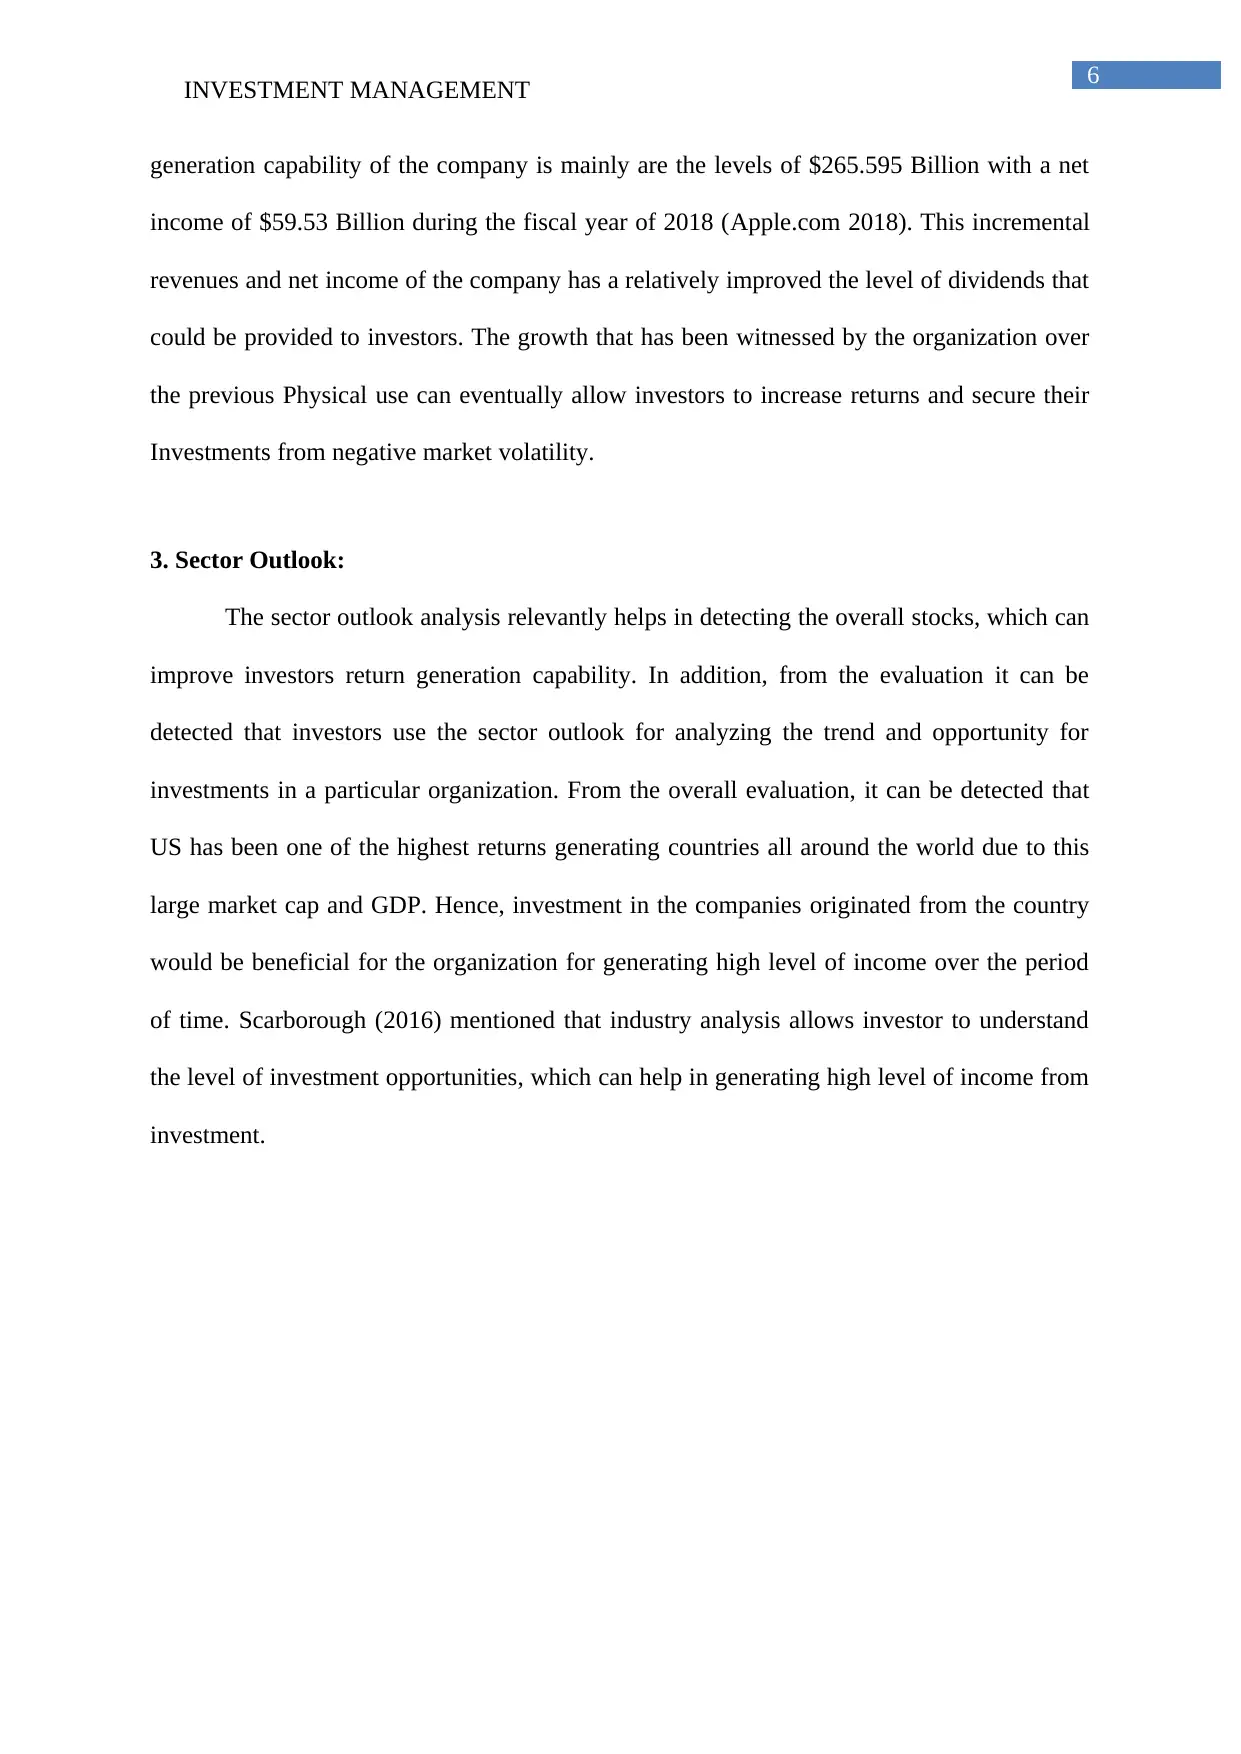
Figure 3: United States Economy Data
(Source: Forrester.com 2018)
The economic outlook of USA has relatively improved after the selection of Donald
Trump as the President. The economic development that has been made by the president has
a relatively motivated and high increased elevated the overall economic conditions of the
country. The economic growth of USA has relatively improved from the levels of 1.5% to
2.3%, while the GDP per capita income has increased from 57,559 to 59,501. Moreover, the
unemployment rate has declined while the stock market valuation as a relatively increased to
the levels of 25.1 from previous fiscal year 13.4. Furthermore, the industrial production of the
Paraphrase This Document
Need a fresh take? Get an instant paraphrase of this document with our AI Paraphraser
INVESTMENT MANAGEMENT 8
economy was a relatively positive in comparison to previous year. The analysis of the overall
economy has a relatively highlighted the performance and improvements that has been
achieved by US in comparison to other countries. Hence, investment in US companies would
eventually security investment scope of an investor and allow them to generate high returns
and capital growth (Vogel 2014).
Figure 4: GDP growth in Industry
(Source: Statista.com 2018)
The above figure provides information regarding the gross domestic product of
United States as per the industry. From the evaluation it could be understood that the finance
insurance industry has a relatively seen a higher growth in the domestic product. The
business service sector is relatively considered the third contributor of the GDP, which
indicates the high level of income that is generated by the industry in USA. This indicates
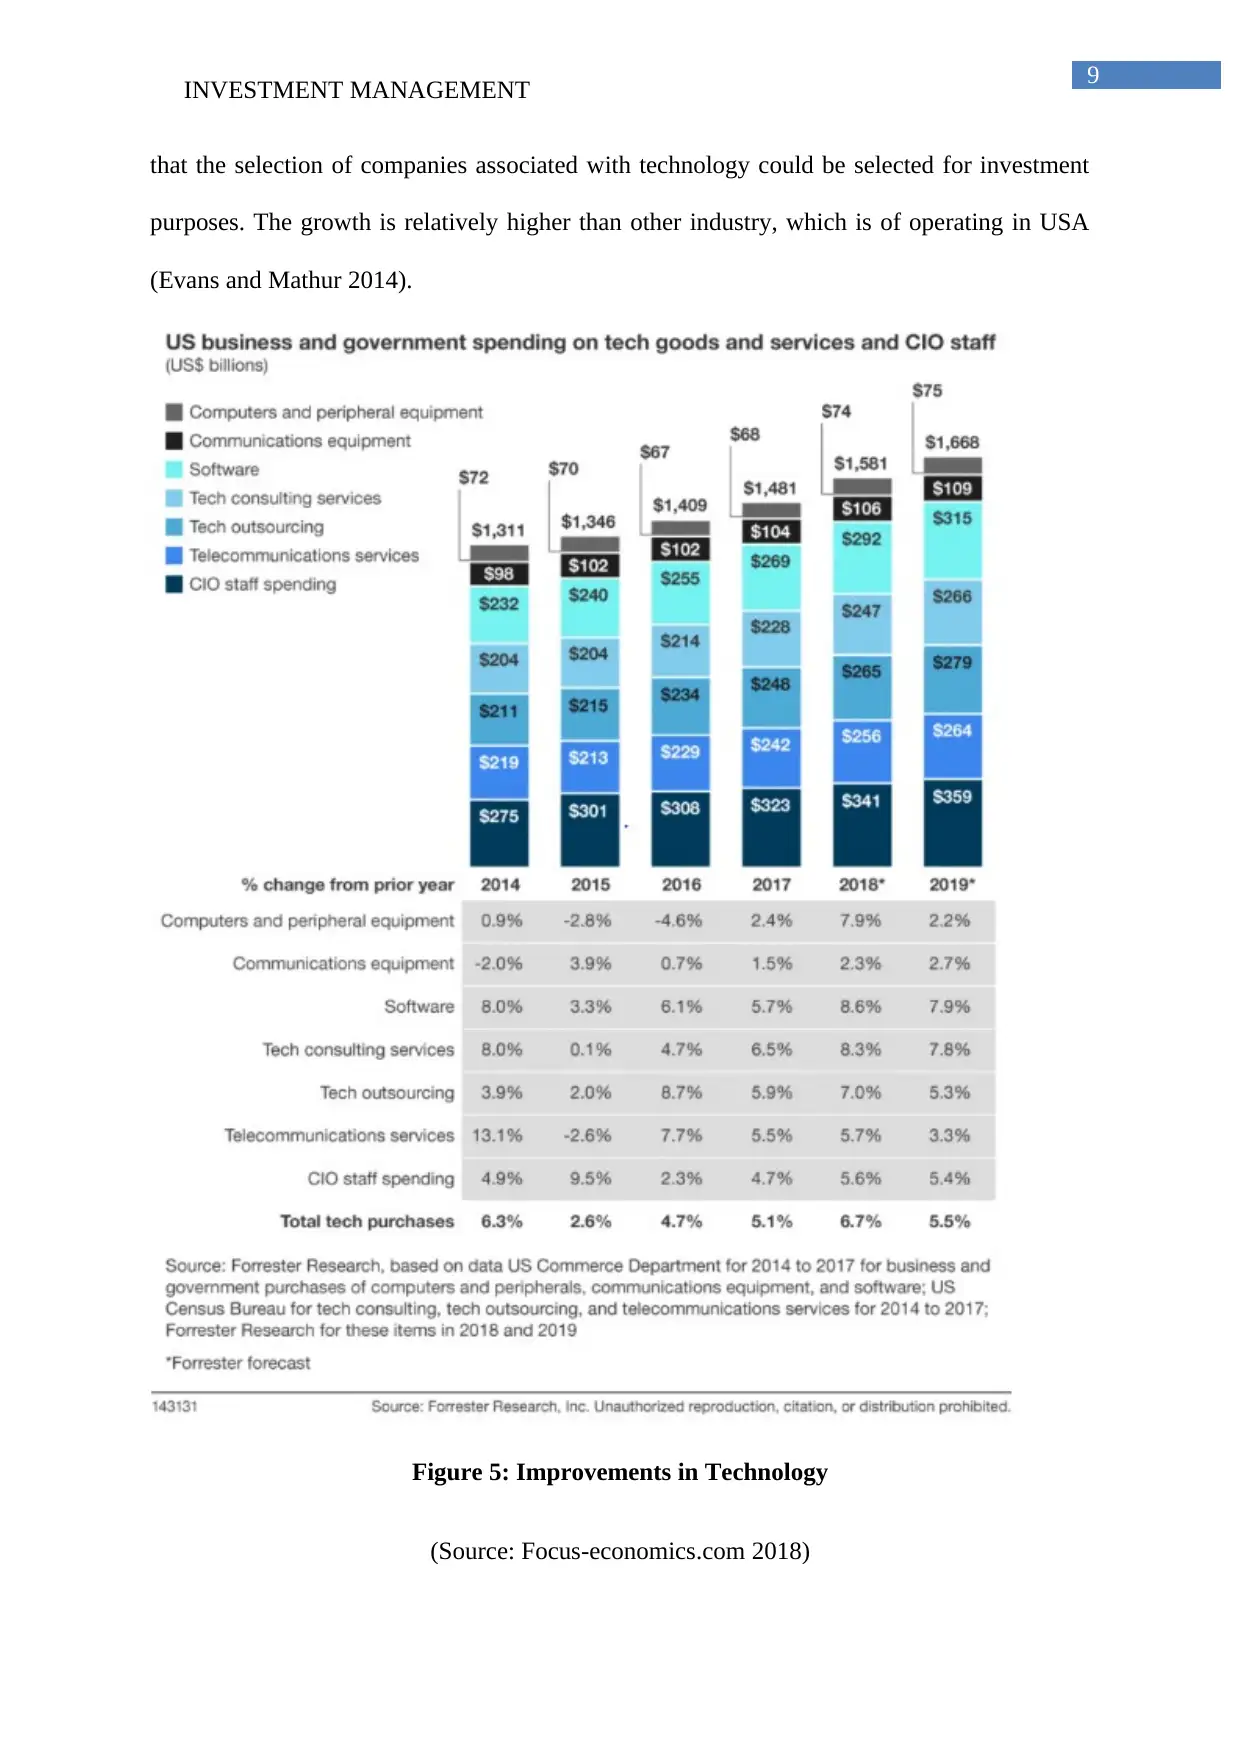
INVESTMENT MANAGEMENT 9
that the selection of companies associated with technology could be selected for investment
purposes. The growth is relatively higher than other industry, which is of operating in USA
(Evans and Mathur 2014).
Figure 5: Improvements in Technology
(Source: Focus-economics.com 2018)
that the selection of companies associated with technology could be selected for investment
purposes. The growth is relatively higher than other industry, which is of operating in USA
(Evans and Mathur 2014).
Figure 5: Improvements in Technology
(Source: Focus-economics.com 2018)
⊘ This is a preview!⊘
Do you want full access?
Subscribe today to unlock all pages.
Trusted by 1+ million students worldwide
INVESTMENT MANAGEMENT 10
Under the business service industry the Information Technology Sector is a relatively
considered to be one of the most adequate investment option. From the evaluation of the
above figure, it could be understood that US business and government spending have
conducted relevant improvements in the technology sector. The anticipation of 2019 overall
spending is relatively at the levels of $1,668 billion. This increases the chance of profitability
in the Information Technology Sector, which can be achieved by organisations, as higher
growth and Income prospects are anticipated. Hence, the investors for increasing the overall
investment capital and returns can select the organization that is working in Technology
Sector. Thus, selection of Apple Inc. is most preferable for the investors, as the risk from
investment is low and returns are higher (Greco, Figueira and Ehrgott 2016).
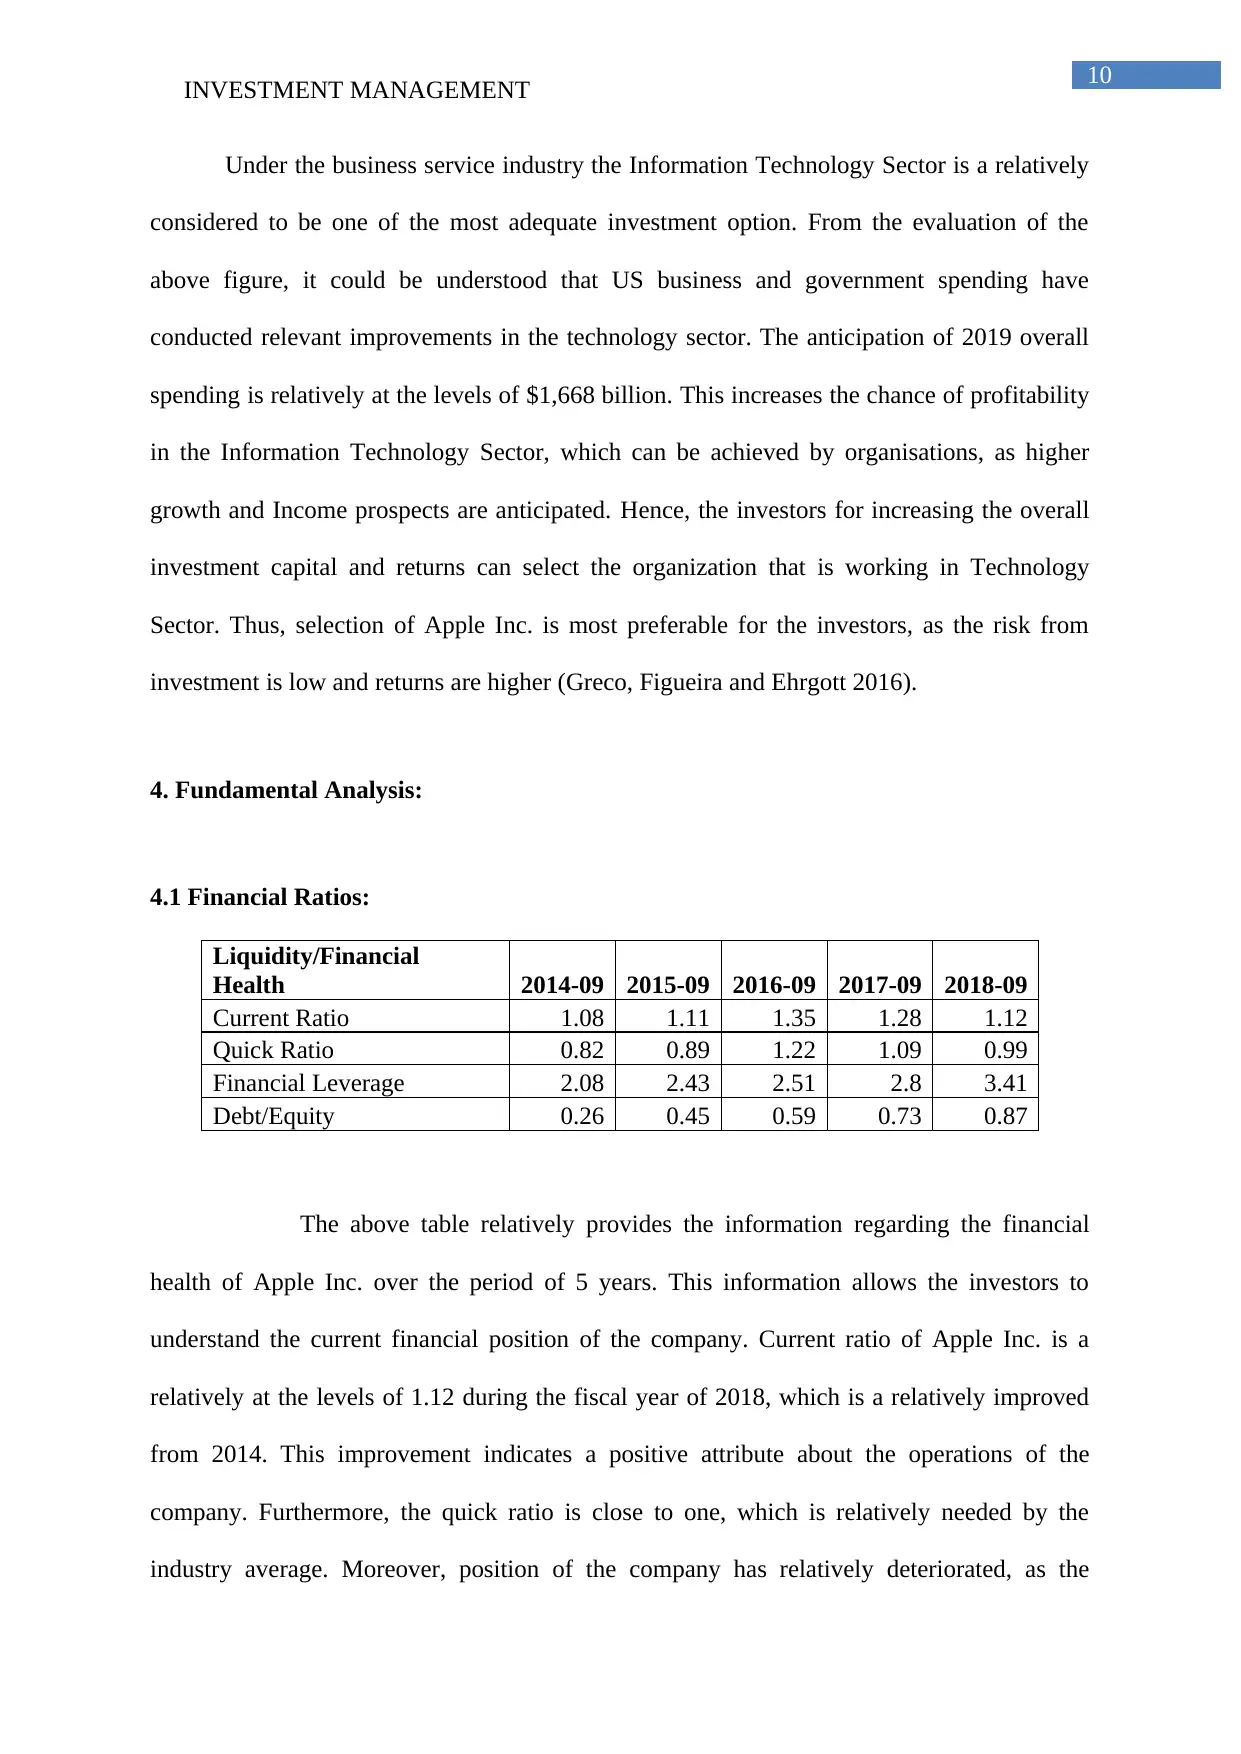
4. Fundamental Analysis:
4.1 Financial Ratios:
Liquidity/Financial
Health 2014-09 2015-09 2016-09 2017-09 2018-09
Current Ratio 1.08 1.11 1.35 1.28 1.12
Quick Ratio 0.82 0.89 1.22 1.09 0.99
Financial Leverage 2.08 2.43 2.51 2.8 3.41
Debt/Equity 0.26 0.45 0.59 0.73 0.87
The above table relatively provides the information regarding the financial
health of Apple Inc. over the period of 5 years. This information allows the investors to
understand the current financial position of the company. Current ratio of Apple Inc. is a
relatively at the levels of 1.12 during the fiscal year of 2018, which is a relatively improved
from 2014. This improvement indicates a positive attribute about the operations of the
company. Furthermore, the quick ratio is close to one, which is relatively needed by the
industry average. Moreover, position of the company has relatively deteriorated, as the
Under the business service industry the Information Technology Sector is a relatively
considered to be one of the most adequate investment option. From the evaluation of the
above figure, it could be understood that US business and government spending have
conducted relevant improvements in the technology sector. The anticipation of 2019 overall
spending is relatively at the levels of $1,668 billion. This increases the chance of profitability
in the Information Technology Sector, which can be achieved by organisations, as higher
growth and Income prospects are anticipated. Hence, the investors for increasing the overall
investment capital and returns can select the organization that is working in Technology
Sector. Thus, selection of Apple Inc. is most preferable for the investors, as the risk from
investment is low and returns are higher (Greco, Figueira and Ehrgott 2016).
4. Fundamental Analysis:
4.1 Financial Ratios:
Liquidity/Financial
Health 2014-09 2015-09 2016-09 2017-09 2018-09
Current Ratio 1.08 1.11 1.35 1.28 1.12
Quick Ratio 0.82 0.89 1.22 1.09 0.99
Financial Leverage 2.08 2.43 2.51 2.8 3.41
Debt/Equity 0.26 0.45 0.59 0.73 0.87
The above table relatively provides the information regarding the financial
health of Apple Inc. over the period of 5 years. This information allows the investors to
understand the current financial position of the company. Current ratio of Apple Inc. is a
relatively at the levels of 1.12 during the fiscal year of 2018, which is a relatively improved
from 2014. This improvement indicates a positive attribute about the operations of the
company. Furthermore, the quick ratio is close to one, which is relatively needed by the
industry average. Moreover, position of the company has relatively deteriorated, as the
Paraphrase This Document
Need a fresh take? Get an instant paraphrase of this document with our AI Paraphraser
INVESTMENT MANAGEMENT 11
organization has increased the exposure debt to conduct its operation. Hence, the financial
health of the organization has deteriorated during 2018, as compared to 2017. This decline in
financial health indicates negative attribute for the company in short term where the values
have declined from 2017 to 2018. However, improvements can be witnessed when analyzing
the data on 5-year basis. This has relatively indicated that the progress of the organization is
adequate and portrays a positive attribute. Nevertheless, the accumulation of debt is a concern
for investors, while the rising share price and high dividend would eventually support the
investors with their investment (Ibn-Homaid and Tijani 2015).
Profitability 2014-09 2015-09 2016-09 2017-09 2018-09
Net Margin % 21.61 22.85 21.19 21.09 22.41
Return on Assets % 18.01 20.45 14.93 13.87 16.07
Return on Equity
% 33.61 46.25 36.9 36.87 49.36
Interest Coverage 140.28 99.93 43.15 28.59 23.5
The profitability ratio of Apple Inc. as a relatively improved over the fiscal years,
which can be seen in the above table. This improvement in profitability ratio has depicted the
capability of the organization to generate higher revenue from operations under different
circumstances. The net margin ratio of the organization has improved from the levels of
21.61% to 22.4 1% during the period of five years, which indicate the measures that has been
used by the company for improving the level of operating expenses and improving its
profitability position. Both the return on Assets and equity has improved drastically over the
period of five-fiscal year, which is an abbreviation of the high level of income that has been
generated by the company after efficiently utilizing the overall Assets and equity capital.
Furthermore, the interest coverage ratio of the company has declined which indicate Sahay
accumulation of debt that has been conducted by the management to continue their
operations. The increment in debt accumulation has negatively affected the net profit
INVESTMENT MANAGEMENT 12
conditions of the organization. However, the analysis directly indicates of positive attributes
of the profitability conditions of Apple, which can be used by the investors to conduct
adequate investments in the organization (Jordan 2014).
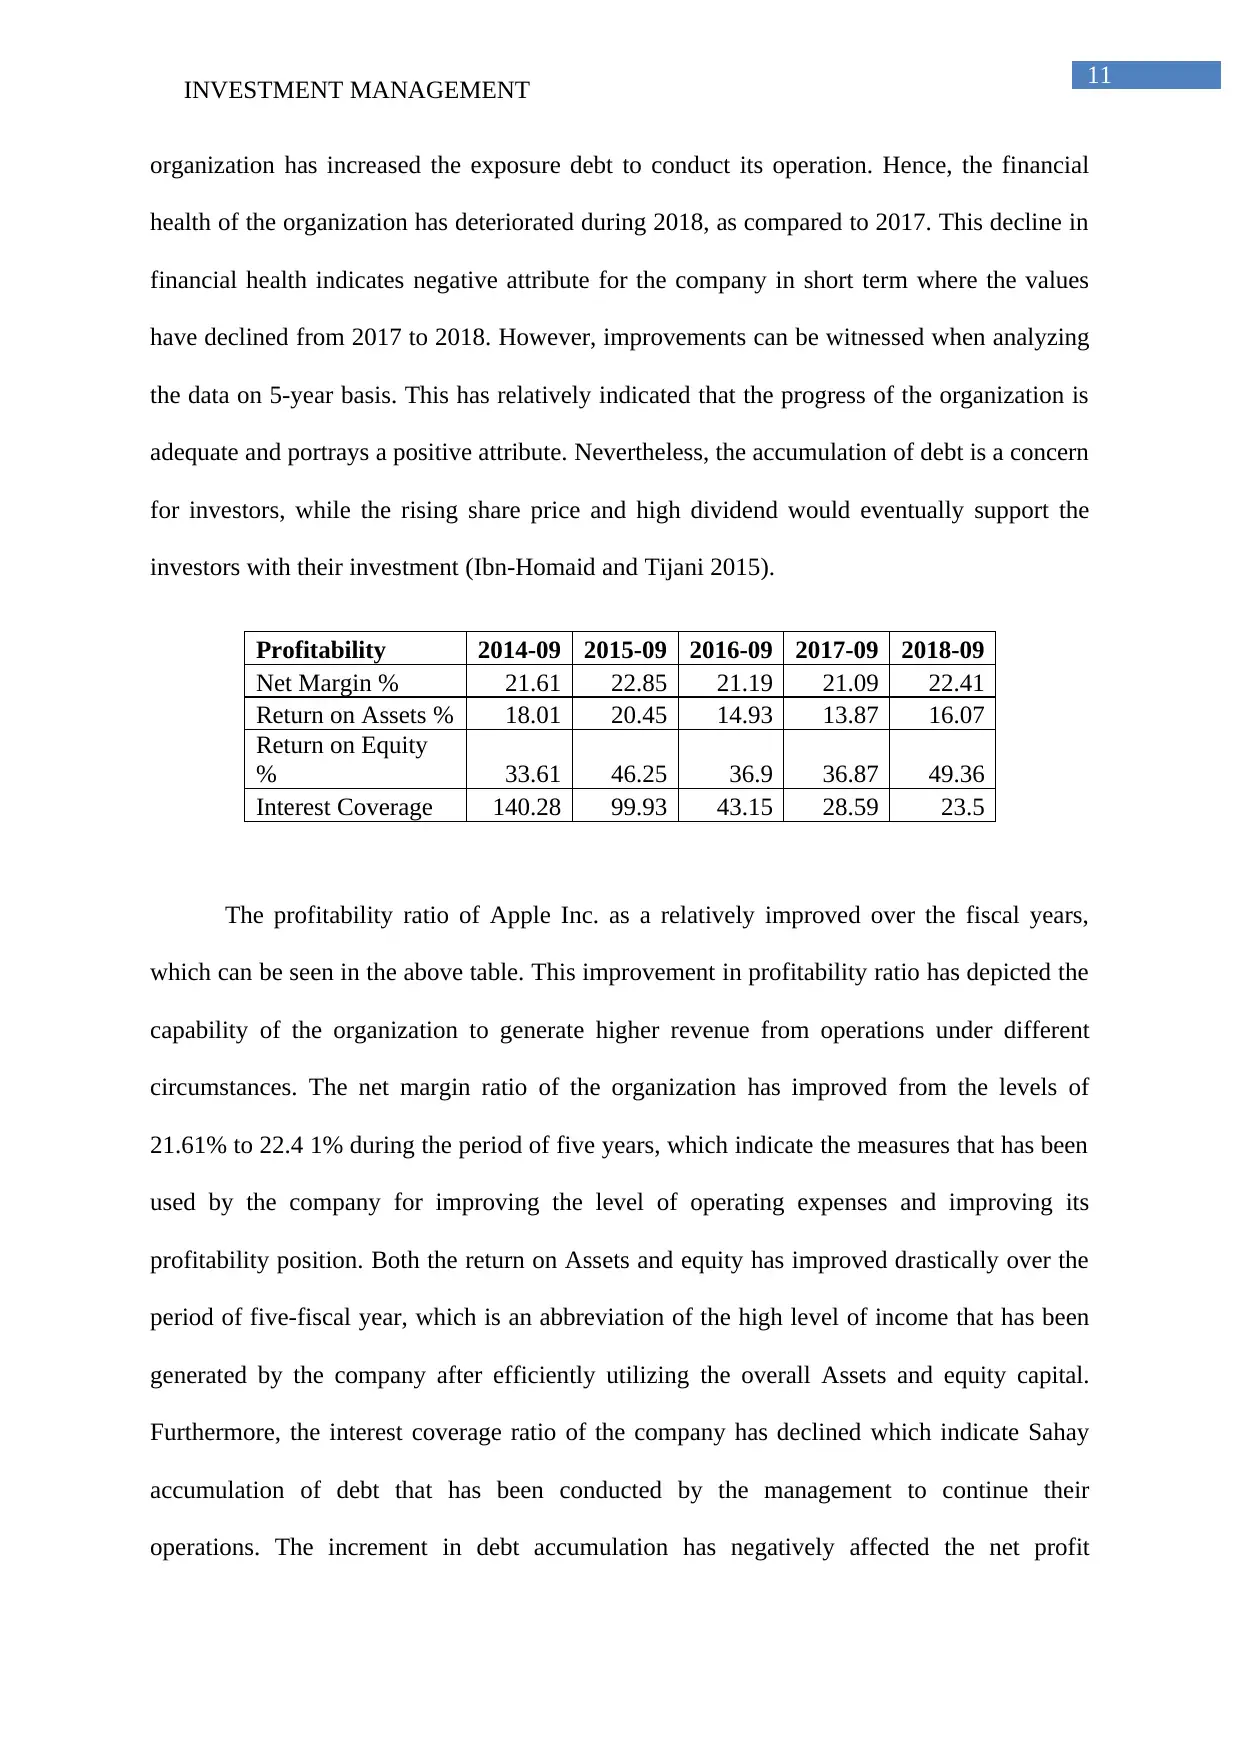
Efficiency 2014-09
2015-
09 2016-09
2017-
09 2018-09
Days Sales Outstanding 30.51 26.79 27.59 26.77 28.21
Days Inventory 6.3 5.81 6.22 9.04 9.82
Payables Period 85.45 85.57 101.11 111.72 116.95
Asset Turnover 0.83 0.89 0.7 0.66 0.72
The efficiency ratio adequately provides the management decision-making
capabilities for appropriately utilizing the available resources available at the disposal. The
above values have indicated a positive attributes for the company. The days outstanding sales
has declined from the levels of 30.51 to 28.21, which indicates a positive attributes that the
organization is getting the money back for its products quickly than anticipated. Moreover,
the payable period of the organization has improved, which directly indicate that the creditors
provide larger time period to the organization before collecting the dues. This would
eventually allow the management to minimize the cash outflow during the fiscal year and
effectively conduct its operations without hurting the cache or working capital of the
company. However, certain decline in day’s inventory and asset turnover ratio of the
organization is witnessed during the fiscal year of 2018. The decline in asset turnover would
result in Low income that is generated by the company after deploying the adequate assets
available to the management (Kou, Peng and Wang 2014).
4.2 Fundamental Analysis:
Particulars Value
Risk Free rate (5Yr) 2.70%
Market Premium
(5Yr) 11.40%
conditions of the organization. However, the analysis directly indicates of positive attributes
of the profitability conditions of Apple, which can be used by the investors to conduct
adequate investments in the organization (Jordan 2014).
Efficiency 2014-09
2015-
09 2016-09
2017-
09 2018-09
Days Sales Outstanding 30.51 26.79 27.59 26.77 28.21
Days Inventory 6.3 5.81 6.22 9.04 9.82
Payables Period 85.45 85.57 101.11 111.72 116.95
Asset Turnover 0.83 0.89 0.7 0.66 0.72
The efficiency ratio adequately provides the management decision-making
capabilities for appropriately utilizing the available resources available at the disposal. The
above values have indicated a positive attributes for the company. The days outstanding sales
has declined from the levels of 30.51 to 28.21, which indicates a positive attributes that the
organization is getting the money back for its products quickly than anticipated. Moreover,
the payable period of the organization has improved, which directly indicate that the creditors
provide larger time period to the organization before collecting the dues. This would
eventually allow the management to minimize the cash outflow during the fiscal year and
effectively conduct its operations without hurting the cache or working capital of the
company. However, certain decline in day’s inventory and asset turnover ratio of the
organization is witnessed during the fiscal year of 2018. The decline in asset turnover would
result in Low income that is generated by the company after deploying the adequate assets
available to the management (Kou, Peng and Wang 2014).
4.2 Fundamental Analysis:
Particulars Value
Risk Free rate (5Yr) 2.70%
Market Premium
(5Yr) 11.40%
⊘ This is a preview!⊘
Do you want full access?
Subscribe today to unlock all pages.
Trusted by 1+ million students worldwide
1 out of 20
Related Documents


Your All-in-One AI-Powered Toolkit for Academic Success.
+13062052269
info@desklib.com
Available 24*7 on WhatsApp / Email
![[object Object]](/_next/static/media/star-bottom.7253800d.svg)
Unlock your academic potential
Copyright © 2020–2026 A2Z Services. All Rights Reserved. Developed and managed by ZUCOL.