CBE 1 Report: Analysis of Apple Inc.'s Micro and Macro Environment
VerifiedAdded on 2023/01/19
|16
|3614
|45
Report
AI Summary
This report provides a comprehensive analysis of Apple Inc.'s business environment, focusing on both the micro and macro levels. The microenvironment analysis covers supply and demand dynamics, exploring the relationship between price and quantity, and delves into various types of elasticity, including price, cross, and income elasticity. It also examines Apple's market structure as an oligopoly. The report further includes an internal audit, assessing productivity through revenue per square foot, product units per time, and employee milestones, as well as evaluating Apple's business strategies, such as e-commerce and marketing mix. A PESTEL analysis is conducted to evaluate political, economic, social, and technological factors impacting the company, including lobbying efforts, currency exchange rates, social trends, and technological advancements. The report also explores Apple's external environment, including the analysis of the company's SWOT.

CBE
1
1
Paraphrase This Document
Need a fresh take? Get an instant paraphrase of this document with our AI Paraphraser
Table of Contents
2
2
INTRODUCTION
Micro environment is the environment which directly linked with the organization and
affect its operational activities. It includes various elements which affect business such as
suppliers, competitors, mediators, customers etc. In order to understand micro environment,
business have to understand the factors such as supply & demand, elasticity and done internal
audit which helps in increasing productivity through making effective strategies (Aćimović and
et.al., 2014). Macro environment also affect the business operations which further impact
production as well as profitability. This report based on Apple Inc, which is American
multinational technology based company which sell electronic items through online or offline
mode. This report covers various topics such as Supply & Demand, price, cross or income
elasticity, internal audit as well as done PESTEL analysis. I addition, it includes the external
audit and it will have done with the help of SWOT analysis which helps in understand strength,
weakness, opportunity or threat of the company.
MAIN BODY
Overview of company:
Apple Inc. is an American based multinational technology company which situated in
Cupertino, California. They design, develop or sell the electronic items for the consumers such
as computer software, online services, electronic items etc. Apple consider into Big Four Tech
Companies and remaining include the Amazon, Google and Facebook (Apple Inc, 2019).
Smartphone products include the serious of iPhones, iPad for tablet, Mac for personal computer,
smartwatch etc. Company founded in 1976 by Steve Jobs, Steve Wozniak and Ronald Wayne.
Currently they have more than 500 stores in world wide area.
1. Micro Environment
Supply: It is an economic concept which describe the number of goods which make
available for consumers. Supply related to the quantity which produce according to the change in
the price of commodity. Basically, price and produced quantity have positive relation because
when price increases then supply of goods also increases due to high demand in the market
(Cashin and et.al., 2014). On the other hand, when price decreases then supply of product also
reduces due to low demand in the market. Law of supply must be understanding by the company
3
⊘ This is a preview!⊘
Do you want full access?
Subscribe today to unlock all pages.
Trusted by 1+ million students worldwide
because further it helps in formulating strategy or decision making process. Relationship of price
and quantity will effective represent with the help of supply curve.
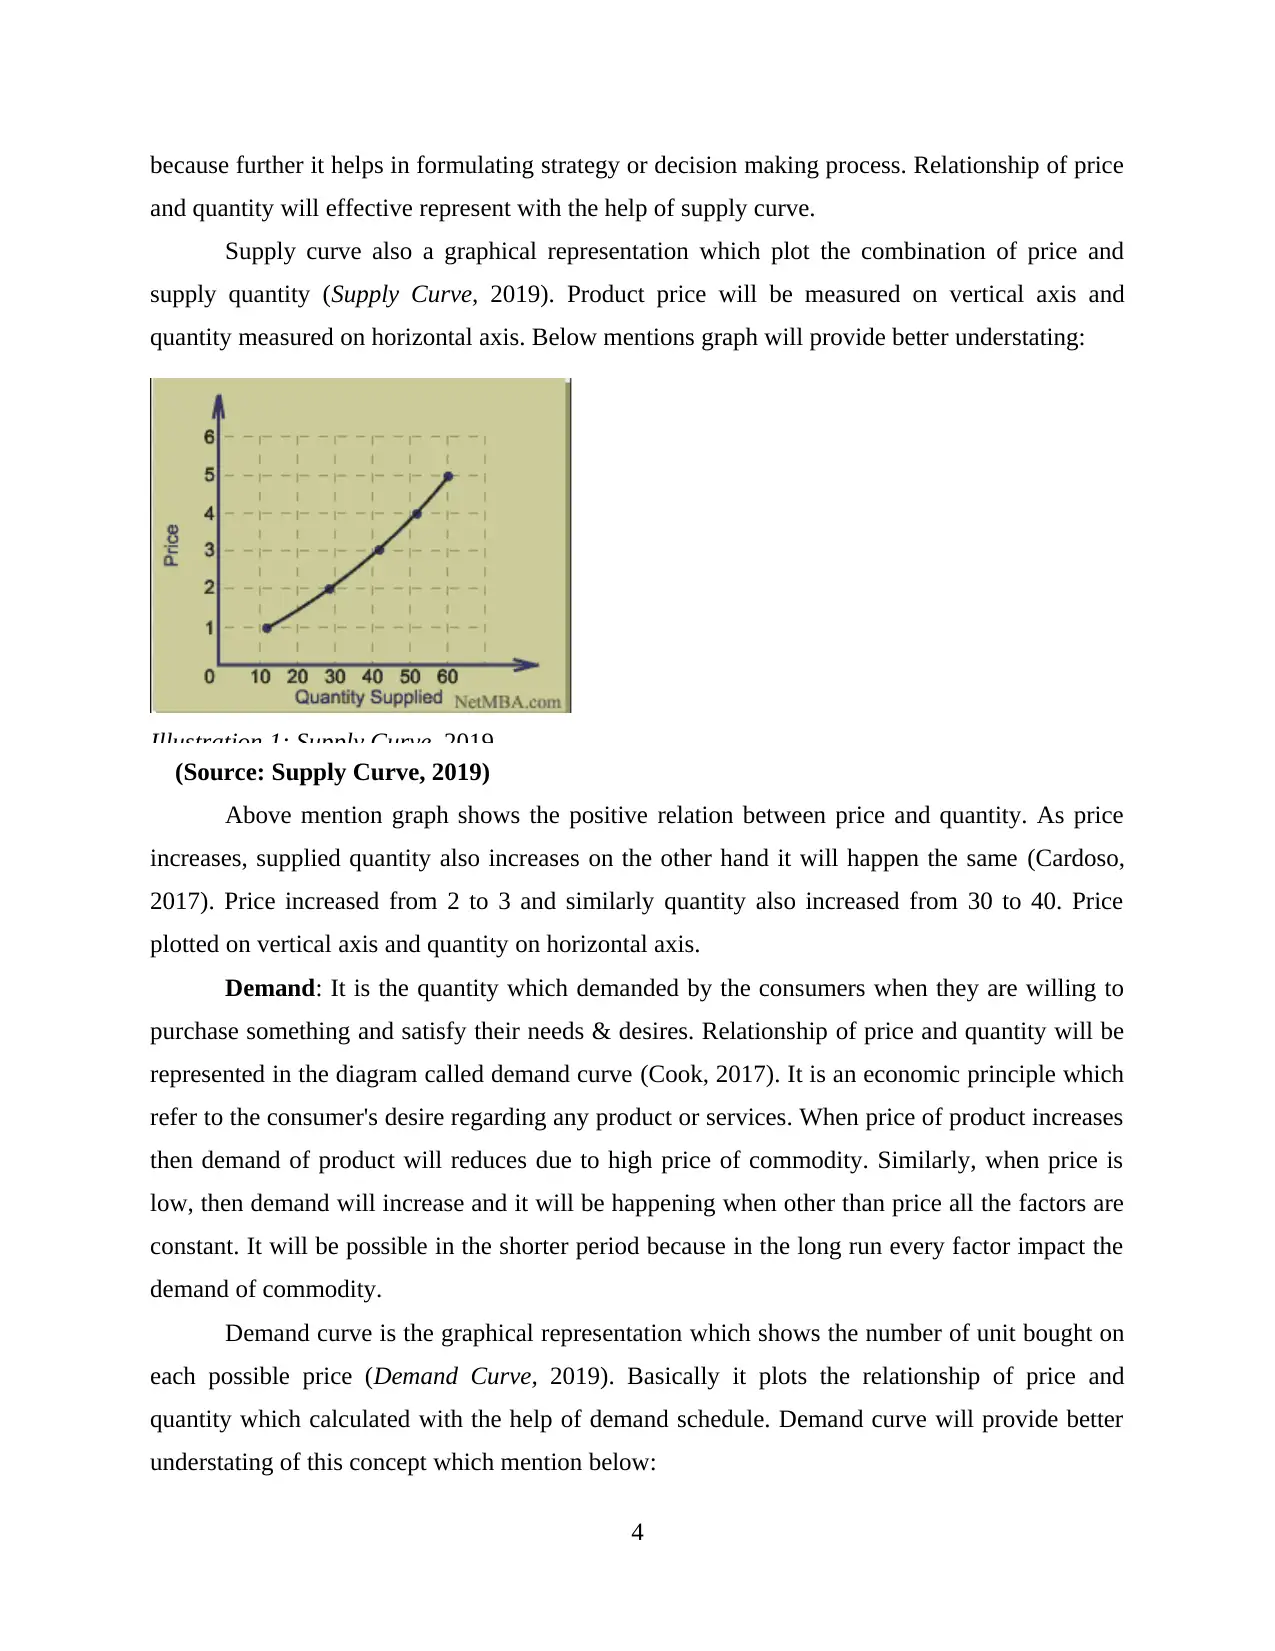
Supply curve also a graphical representation which plot the combination of price and
supply quantity (Supply Curve, 2019). Product price will be measured on vertical axis and
quantity measured on horizontal axis. Below mentions graph will provide better understating:
Illustration 1: Supply Curve, 2019.
(Source: Supply Curve, 2019)
Above mention graph shows the positive relation between price and quantity. As price
increases, supplied quantity also increases on the other hand it will happen the same (Cardoso,
2017). Price increased from 2 to 3 and similarly quantity also increased from 30 to 40. Price
plotted on vertical axis and quantity on horizontal axis.
Demand: It is the quantity which demanded by the consumers when they are willing to
purchase something and satisfy their needs & desires. Relationship of price and quantity will be
represented in the diagram called demand curve (Cook, 2017). It is an economic principle which
refer to the consumer's desire regarding any product or services. When price of product increases
then demand of product will reduces due to high price of commodity. Similarly, when price is
low, then demand will increase and it will be happening when other than price all the factors are
constant. It will be possible in the shorter period because in the long run every factor impact the
demand of commodity.
Demand curve is the graphical representation which shows the number of unit bought on
each possible price (Demand Curve, 2019). Basically it plots the relationship of price and
quantity which calculated with the help of demand schedule. Demand curve will provide better
understating of this concept which mention below:
4
and quantity will effective represent with the help of supply curve.
Supply curve also a graphical representation which plot the combination of price and
supply quantity (Supply Curve, 2019). Product price will be measured on vertical axis and
quantity measured on horizontal axis. Below mentions graph will provide better understating:
Illustration 1: Supply Curve, 2019.
(Source: Supply Curve, 2019)
Above mention graph shows the positive relation between price and quantity. As price
increases, supplied quantity also increases on the other hand it will happen the same (Cardoso,
2017). Price increased from 2 to 3 and similarly quantity also increased from 30 to 40. Price
plotted on vertical axis and quantity on horizontal axis.
Demand: It is the quantity which demanded by the consumers when they are willing to
purchase something and satisfy their needs & desires. Relationship of price and quantity will be
represented in the diagram called demand curve (Cook, 2017). It is an economic principle which
refer to the consumer's desire regarding any product or services. When price of product increases
then demand of product will reduces due to high price of commodity. Similarly, when price is
low, then demand will increase and it will be happening when other than price all the factors are
constant. It will be possible in the shorter period because in the long run every factor impact the
demand of commodity.
Demand curve is the graphical representation which shows the number of unit bought on
each possible price (Demand Curve, 2019). Basically it plots the relationship of price and
quantity which calculated with the help of demand schedule. Demand curve will provide better
understating of this concept which mention below:
4
Paraphrase This Document
Need a fresh take? Get an instant paraphrase of this document with our AI Paraphraser
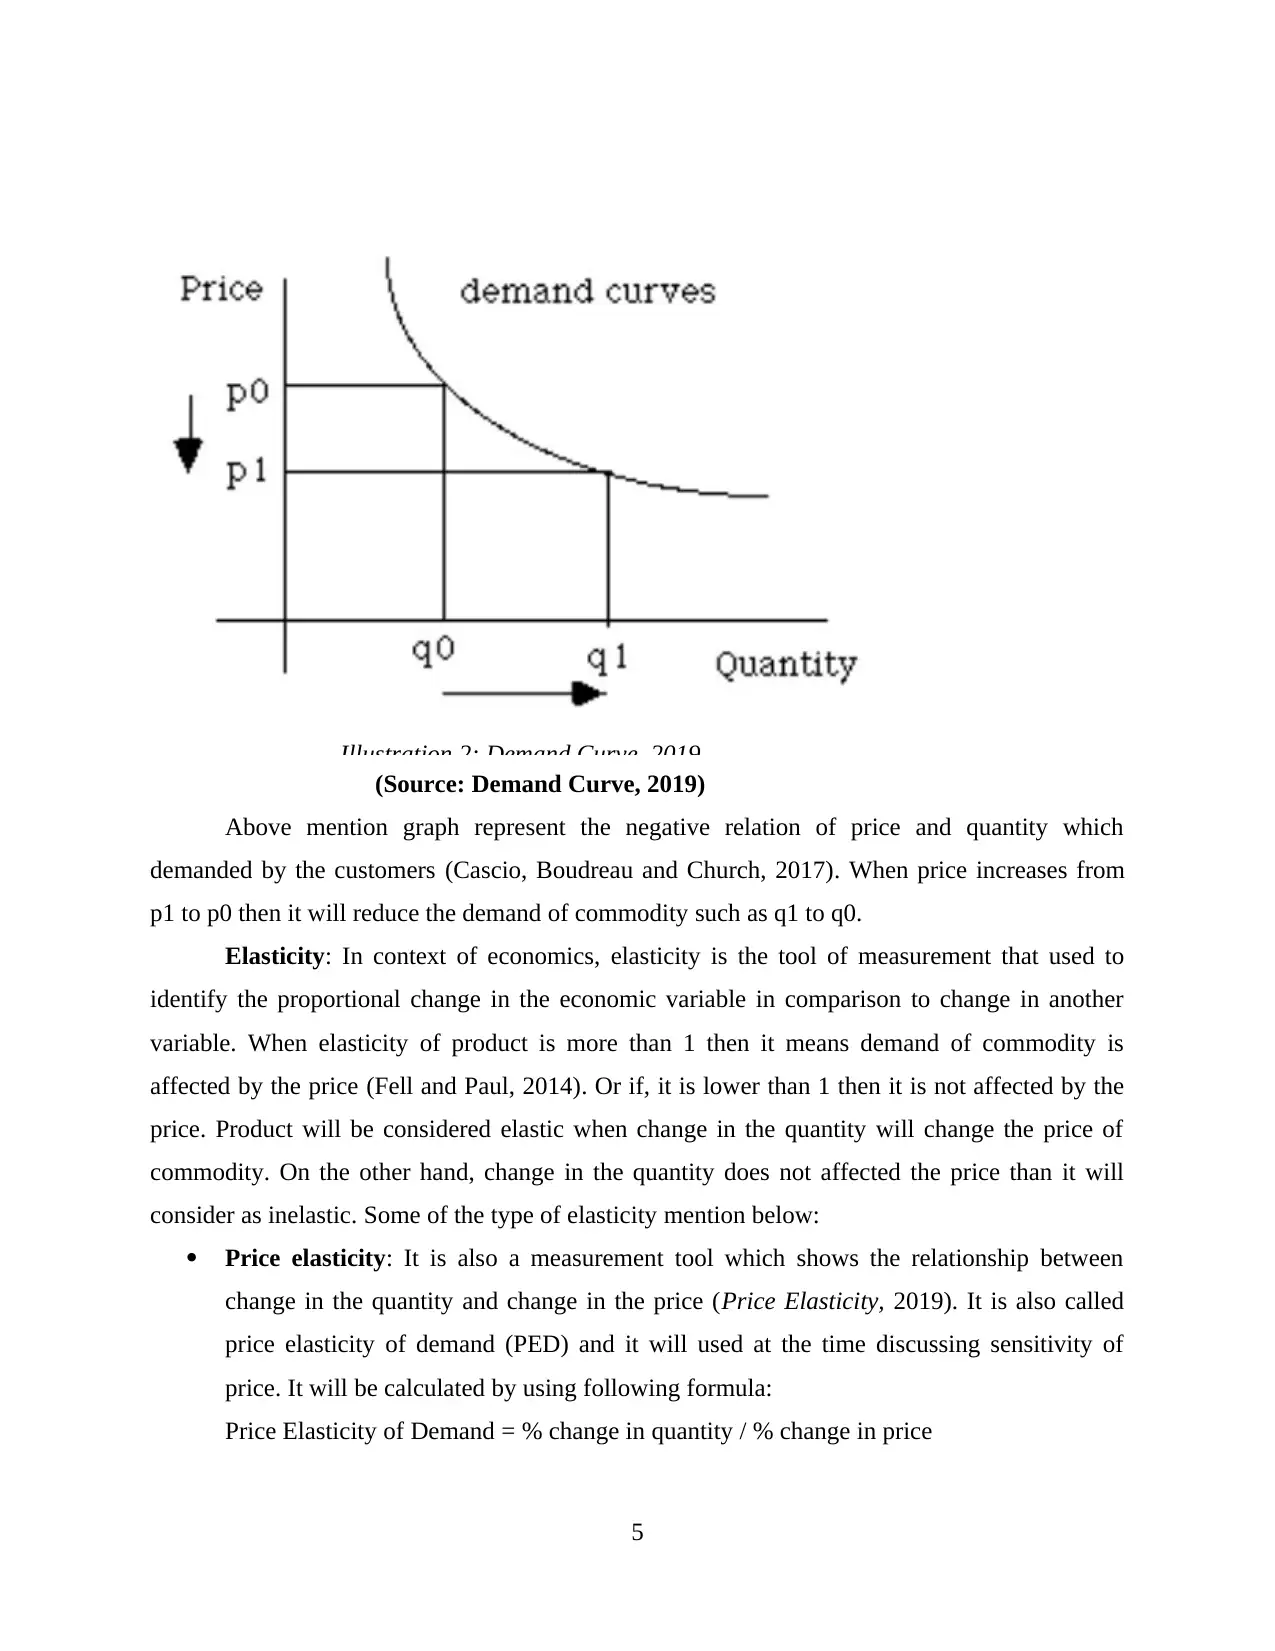
Illustration 2: Demand Curve, 2019.
(Source: Demand Curve, 2019)
Above mention graph represent the negative relation of price and quantity which
demanded by the customers (Cascio, Boudreau and Church, 2017). When price increases from
p1 to p0 then it will reduce the demand of commodity such as q1 to q0.
Elasticity: In context of economics, elasticity is the tool of measurement that used to
identify the proportional change in the economic variable in comparison to change in another
variable. When elasticity of product is more than 1 then it means demand of commodity is
affected by the price (Fell and Paul, 2014). Or if, it is lower than 1 then it is not affected by the
price. Product will be considered elastic when change in the quantity will change the price of
commodity. On the other hand, change in the quantity does not affected the price than it will
consider as inelastic. Some of the type of elasticity mention below:
Price elasticity: It is also a measurement tool which shows the relationship between
change in the quantity and change in the price (Price Elasticity, 2019). It is also called
price elasticity of demand (PED) and it will used at the time discussing sensitivity of
price. It will be calculated by using following formula:
Price Elasticity of Demand = % change in quantity / % change in price
5
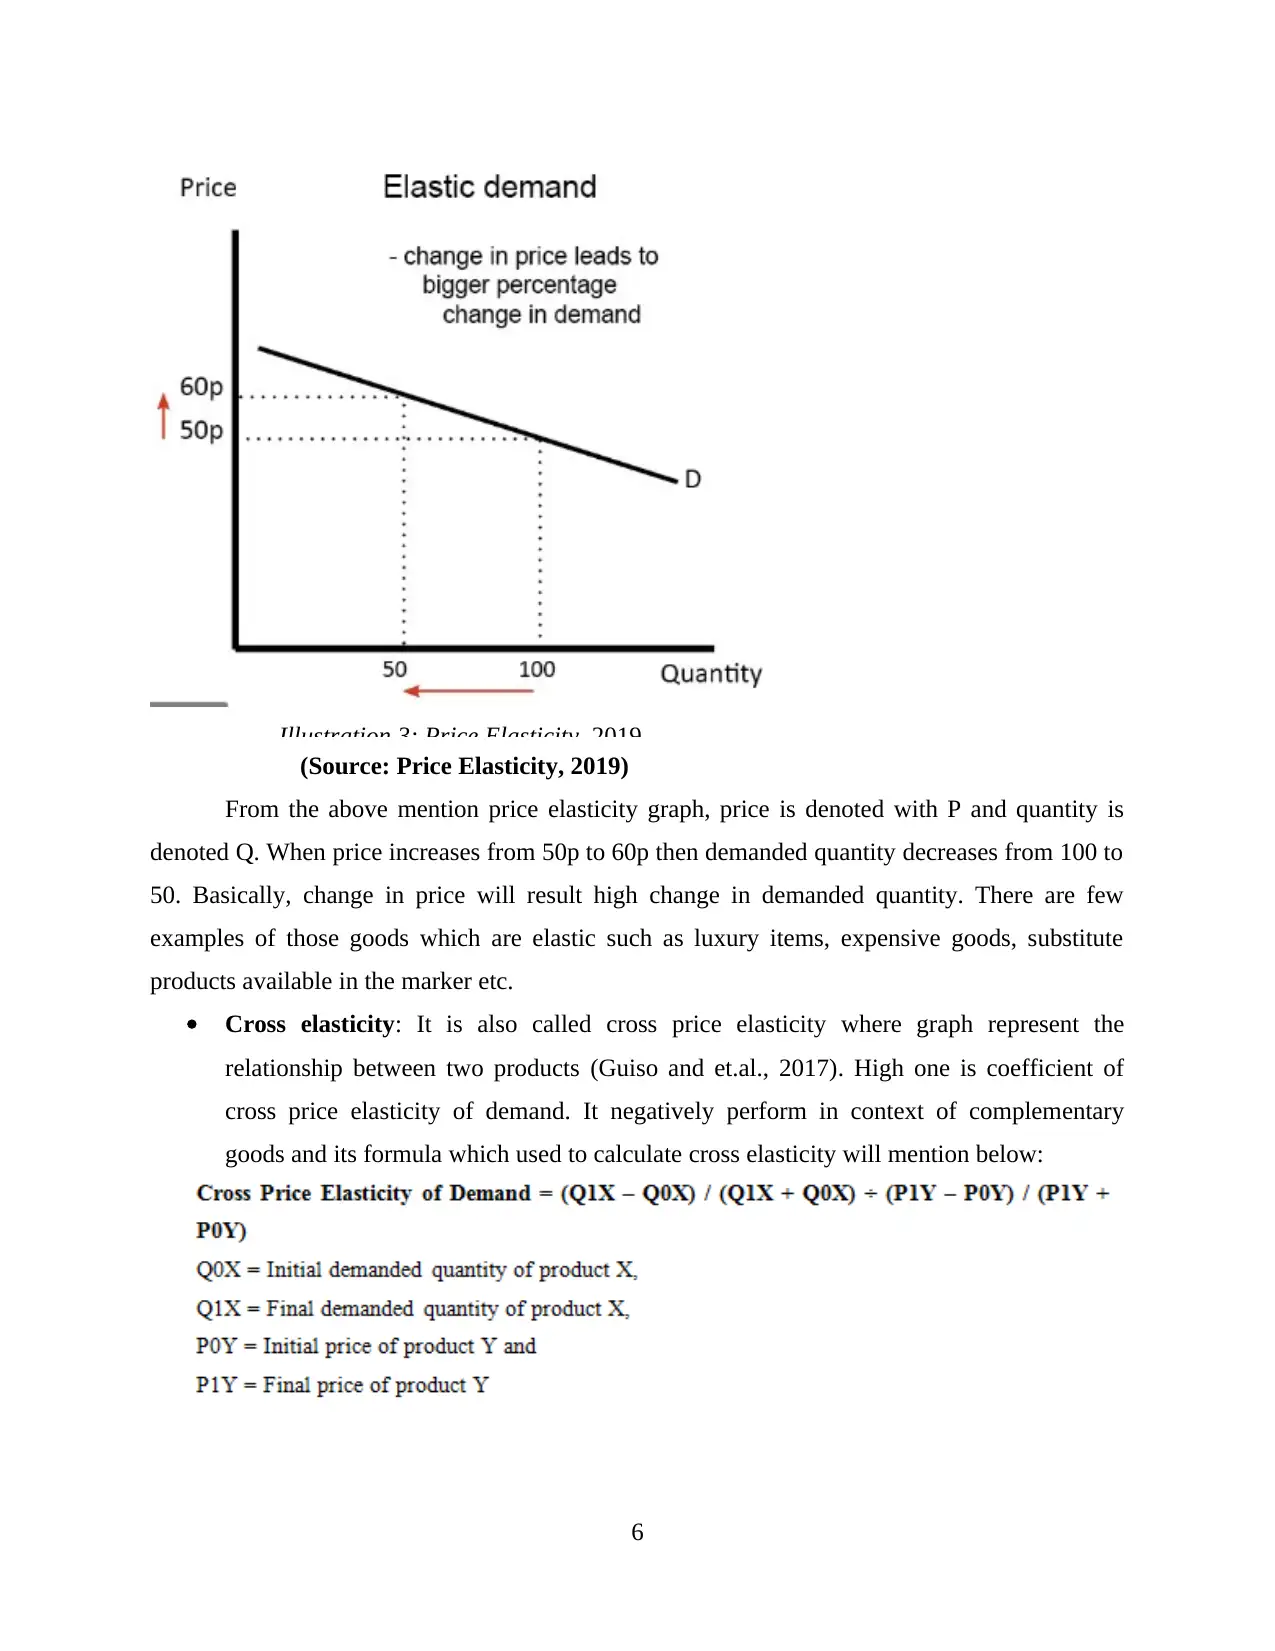
Illustration 3: Price Elasticity, 2019.
(Source: Price Elasticity, 2019)
From the above mention price elasticity graph, price is denoted with P and quantity is
denoted Q. When price increases from 50p to 60p then demanded quantity decreases from 100 to
50. Basically, change in price will result high change in demanded quantity. There are few
examples of those goods which are elastic such as luxury items, expensive goods, substitute
products available in the marker etc.
Cross elasticity: It is also called cross price elasticity where graph represent the
relationship between two products (Guiso and et.al., 2017). High one is coefficient of
cross price elasticity of demand. It negatively perform in context of complementary
goods and its formula which used to calculate cross elasticity will mention below:
6
⊘ This is a preview!⊘
Do you want full access?
Subscribe today to unlock all pages.
Trusted by 1+ million students worldwide
Income elasticity: In context of economics, income elasticity is the connection between
demand of product or disposable income of customers (Labandeira, Labeaga and López-
Otero, 2017). In simple words, individual income will decided that consumer purchase
that product or not. There is a formula to calculate income elasticity which mention
below:
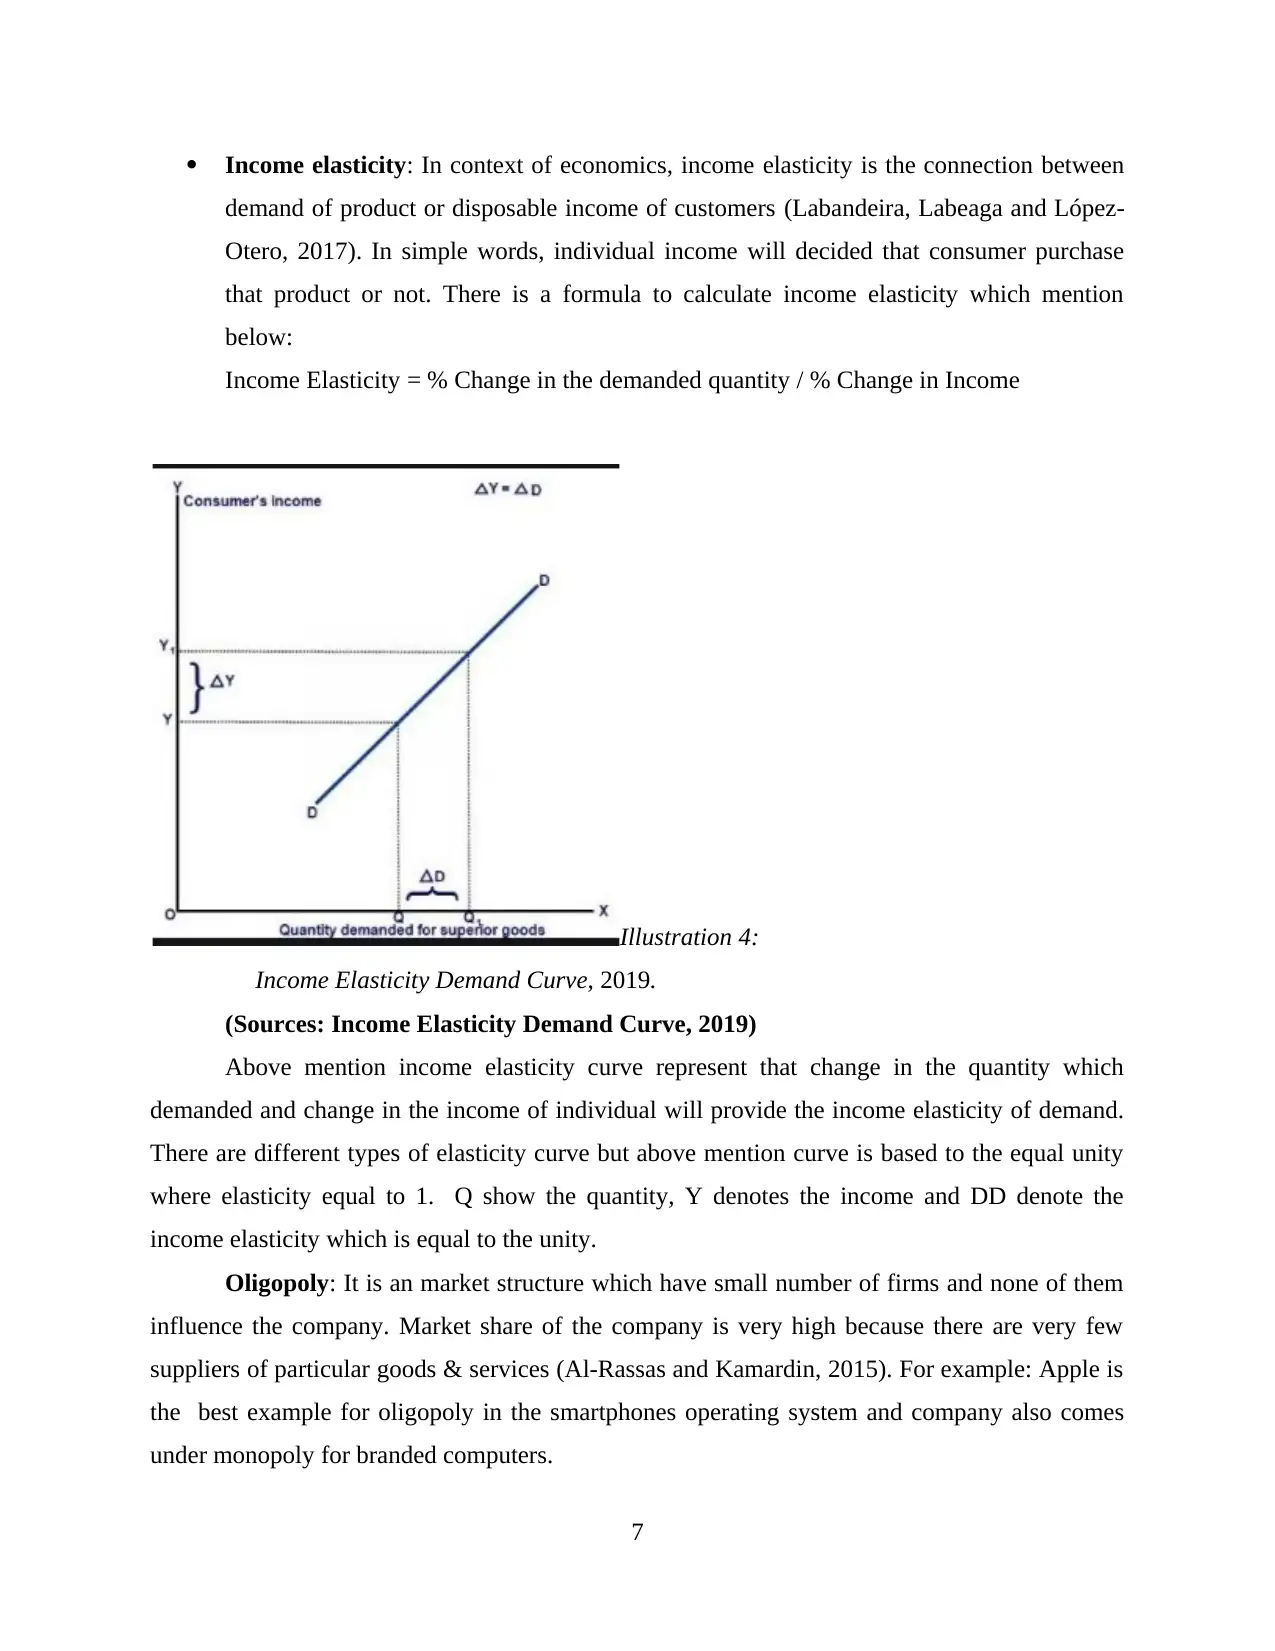
Income Elasticity = % Change in the demanded quantity / % Change in Income
Illustration 4:
Income Elasticity Demand Curve, 2019.
(Sources: Income Elasticity Demand Curve, 2019)
Above mention income elasticity curve represent that change in the quantity which
demanded and change in the income of individual will provide the income elasticity of demand.
There are different types of elasticity curve but above mention curve is based to the equal unity
where elasticity equal to 1. Q show the quantity, Y denotes the income and DD denote the
income elasticity which is equal to the unity.
Oligopoly: It is an market structure which have small number of firms and none of them
influence the company. Market share of the company is very high because there are very few
suppliers of particular goods & services (Al-Rassas and Kamardin, 2015). For example: Apple is
the best example for oligopoly in the smartphones operating system and company also comes
under monopoly for branded computers.
7
demand of product or disposable income of customers (Labandeira, Labeaga and López-
Otero, 2017). In simple words, individual income will decided that consumer purchase
that product or not. There is a formula to calculate income elasticity which mention
below:
Income Elasticity = % Change in the demanded quantity / % Change in Income
Illustration 4:
Income Elasticity Demand Curve, 2019.
(Sources: Income Elasticity Demand Curve, 2019)
Above mention income elasticity curve represent that change in the quantity which
demanded and change in the income of individual will provide the income elasticity of demand.
There are different types of elasticity curve but above mention curve is based to the equal unity
where elasticity equal to 1. Q show the quantity, Y denotes the income and DD denote the
income elasticity which is equal to the unity.
Oligopoly: It is an market structure which have small number of firms and none of them
influence the company. Market share of the company is very high because there are very few
suppliers of particular goods & services (Al-Rassas and Kamardin, 2015). For example: Apple is
the best example for oligopoly in the smartphones operating system and company also comes
under monopoly for branded computers.
7
Paraphrase This Document
Need a fresh take? Get an instant paraphrase of this document with our AI Paraphraser
Internal Audit:
Productivity: Operations management monitor the productivity of Apple company by
using various criteria such as global size, diverse activity, different standards etc. Along
with this, company use benchmarking technique for productivity of different business
units. Some of the productivity measurement criteria are as follow: Revenue per square
foot (productivity of every Apple store), Product unit per time (productivity of supply
chain management) or Milestone per time (Productivity of employees at the time of
developing product). In context of Apple, they implement various measurement tool in
order to analyse their performance in the various area. Management evaluate the supply
of their phones, employees’ productivity range, revenue of every stores by location (Mat
Zain, Zaman and Mohamed, 2015). With the help of internal audit they able to evaluate
the overall performance as well as productivity.
Business strategy: Every organization follow different strategy in order to enhance their
productivity as well as performance of individuals. In context of Apple, company follow
the various strategies such as E-commerce, marketing mix, or internet business
model. Basically, e-commerce used for shopping process through cutting the price of
product and make them available on company's sites (Business Strategy, 2019). Apply
upgrade search engine optimization technology which generate information with partner
business. Company try to make their website more effective so consumers can search and
find what they need. Apply use many internet methods to stay connected with consumers
and other competitors. B2B e-commerce used to sell compacters to other organizations
and B2C selling iPad, computers and other products (Al-Matari, Al-Swidi and Fadzil,
2014). Company have many group of customers where they focus in effective manner to
satisfy their needs & desire. Without making any strategy they are unable to perform as
well as achieve their desired goals.
8
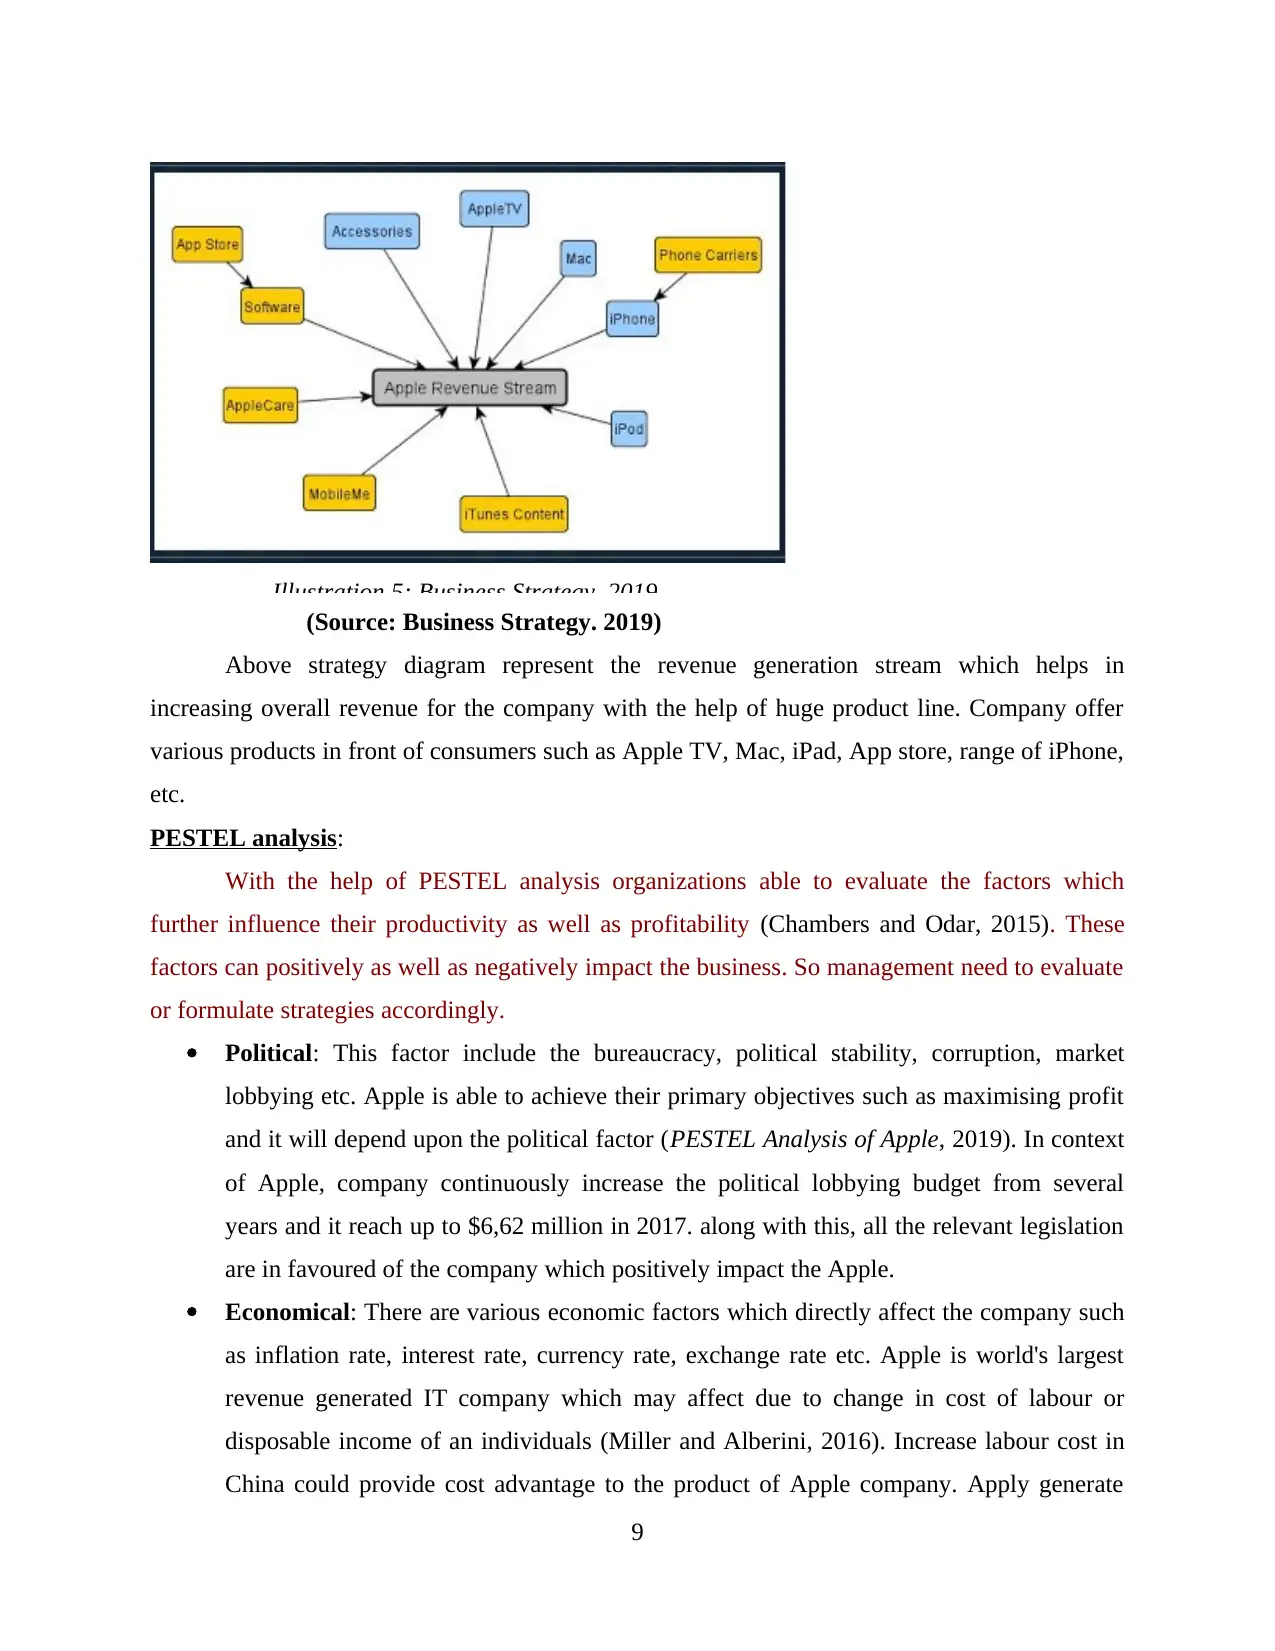
Illustration 5: Business Strategy, 2019.
(Source: Business Strategy. 2019)
Above strategy diagram represent the revenue generation stream which helps in
increasing overall revenue for the company with the help of huge product line. Company offer
various products in front of consumers such as Apple TV, Mac, iPad, App store, range of iPhone,
etc.
PESTEL analysis:
With the help of PESTEL analysis organizations able to evaluate the factors which
further influence their productivity as well as profitability (Chambers and Odar, 2015). These
factors can positively as well as negatively impact the business. So management need to evaluate
or formulate strategies accordingly.
Political: This factor include the bureaucracy, political stability, corruption, market
lobbying etc. Apple is able to achieve their primary objectives such as maximising profit
and it will depend upon the political factor (PESTEL Analysis of Apple, 2019). In context
of Apple, company continuously increase the political lobbying budget from several
years and it reach up to $6,62 million in 2017. along with this, all the relevant legislation
are in favoured of the company which positively impact the Apple.
Economical: There are various economic factors which directly affect the company such
as inflation rate, interest rate, currency rate, exchange rate etc. Apple is world's largest
revenue generated IT company which may affect due to change in cost of labour or
disposable income of an individuals (Miller and Alberini, 2016). Increase labour cost in
China could provide cost advantage to the product of Apple company. Apply generate
9
⊘ This is a preview!⊘
Do you want full access?
Subscribe today to unlock all pages.
Trusted by 1+ million students worldwide
almost 63% revenue from the international market so increase in currency exchange rate
will negatively impact the company and reduce the profit margin. Along with this,
interest rate also impact the profitability of Apply company.
Social: This factor include the current or social trend which increase the popularity of
product among the consumers. In context of Apple, popularity of smartphones became
big opportunity for business unless they provide affordable or easy to use phones in the
market (Mokhber and et.al., 2016). Apple have very close connection with the China and
other North American countries along with customers. Any political issues between US
and China can affect the brand image of Apple. Another social factor which impact the
business such as urbanization trend in the Indian or China because both country in favour
of leading brand Apple.
Technological: Change in the technology help the business to attract more customers
through providing unique features in their products and it will make them different from
others. There are various mobile manufacturing company who provide high technological
products can negatively impact the Apply company. For example: Lenovo company
maintain their position in the PC market where Apple already lost it and it will be happen
because competitive companies offer high technological product at lower prices. Now
days Apple market growing that provide huge opportunity as well as challenges for the
same (Sarsby, 2016). Biggest opportunity is that company offer different devices in the
variety which attract huge customers.
Environmental: External factors can be threat for the company because there are various
compliances which they have to follow otherwise company have to face law suits which
impact the brand image. Apple manufacture their most of the products in the China where
environmental side effects such as pollution already a big concern for the country (El-
Kassar, Elgammal and Bayoud, 2014). So it may effect the Apple company in terms of
manufacturing cost or regulations which they have to follow. Along with this, company
working on sustainability programs with the help of disposal or recycling non-working
electric devise. Global warming affect the change in climate which further impact the
supply chain management of Apply.
Legal: In this factor, company have to legal regulations otherwise they have to face
complications and it can be in term of fine which reduce the brand image of the company.
10
Paraphrase This Document
Need a fresh take? Get an instant paraphrase of this document with our AI Paraphraser
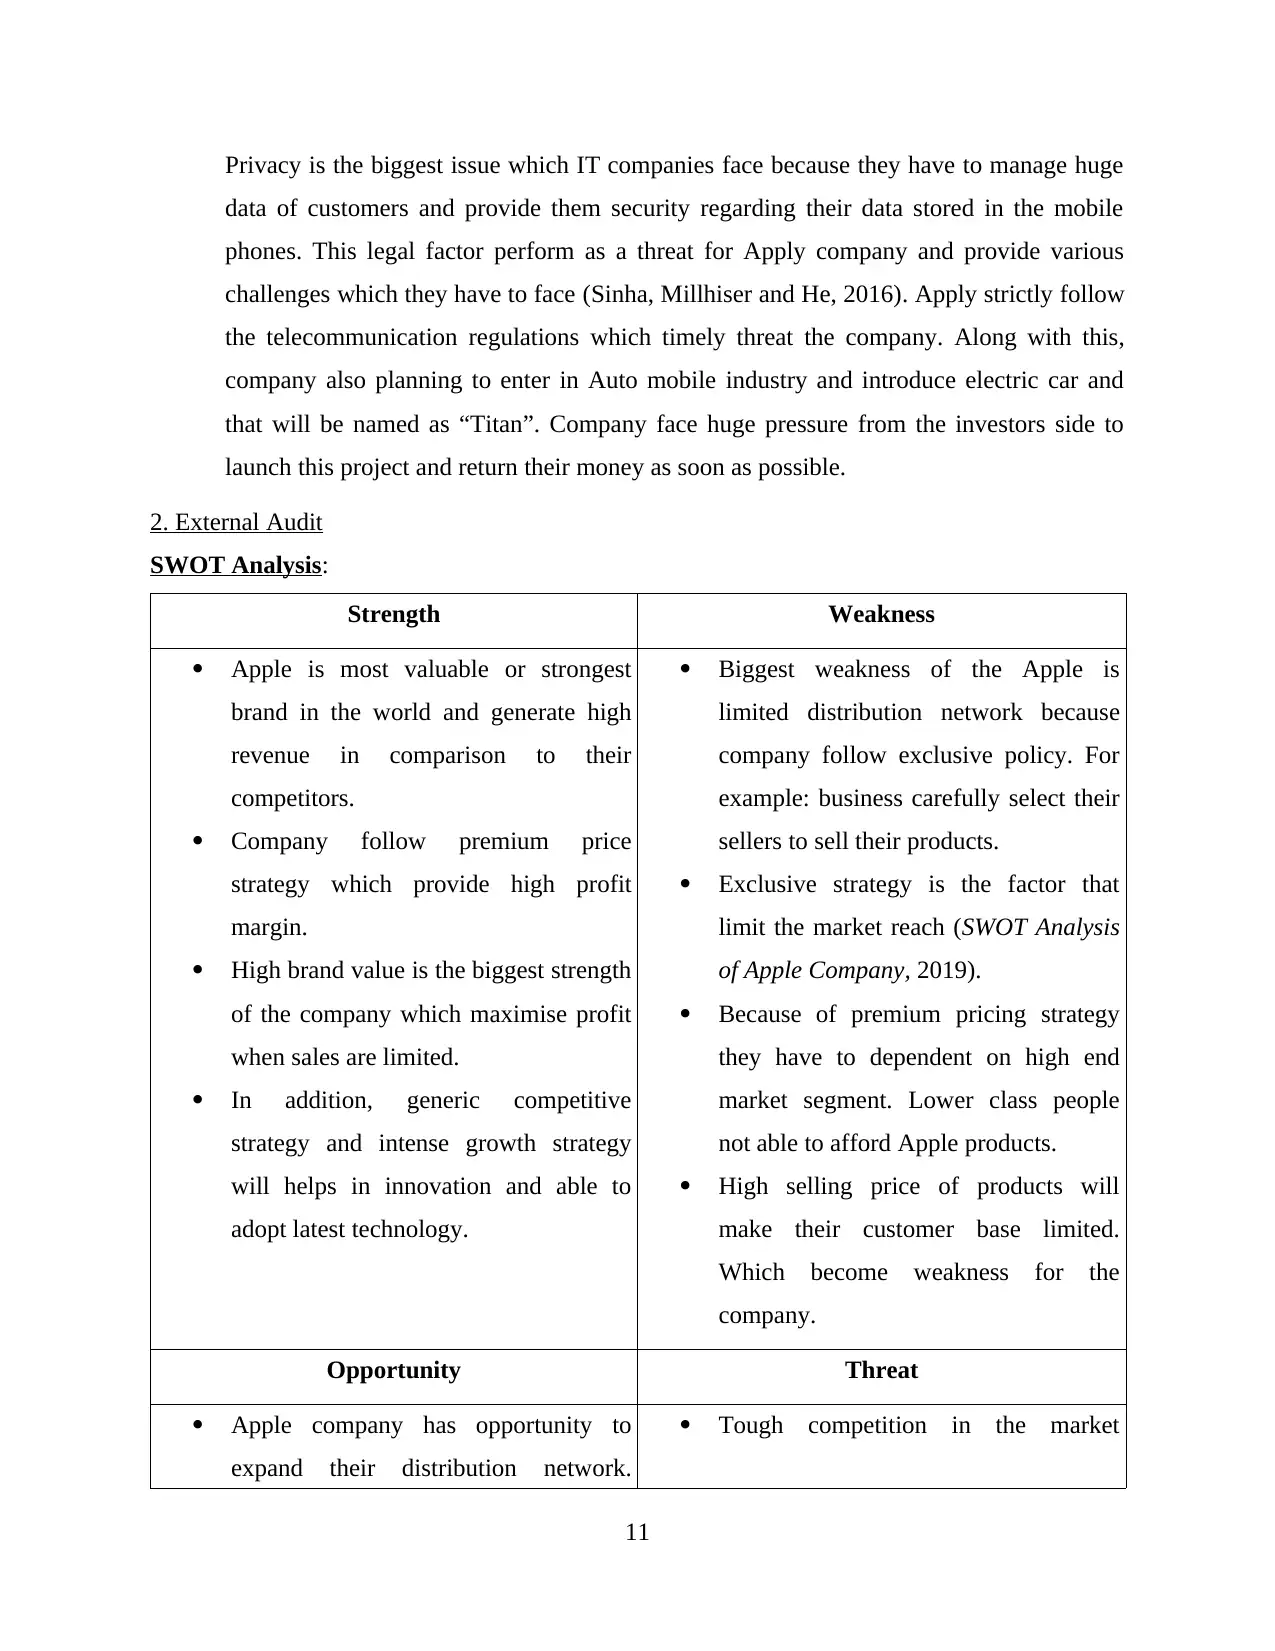
Privacy is the biggest issue which IT companies face because they have to manage huge
data of customers and provide them security regarding their data stored in the mobile
phones. This legal factor perform as a threat for Apply company and provide various
challenges which they have to face (Sinha, Millhiser and He, 2016). Apply strictly follow
the telecommunication regulations which timely threat the company. Along with this,
company also planning to enter in Auto mobile industry and introduce electric car and
that will be named as “Titan”. Company face huge pressure from the investors side to
launch this project and return their money as soon as possible.
2. External Audit
SWOT Analysis:
Strength Weakness
Apple is most valuable or strongest
brand in the world and generate high
revenue in comparison to their
competitors.
Company follow premium price
strategy which provide high profit
margin.
High brand value is the biggest strength
of the company which maximise profit
when sales are limited.
In addition, generic competitive
strategy and intense growth strategy
will helps in innovation and able to
adopt latest technology.
Biggest weakness of the Apple is
limited distribution network because
company follow exclusive policy. For
example: business carefully select their
sellers to sell their products.
Exclusive strategy is the factor that
limit the market reach (SWOT Analysis
of Apple Company, 2019).
Because of premium pricing strategy
they have to dependent on high end
market segment. Lower class people
not able to afford Apple products.
High selling price of products will
make their customer base limited.
Which become weakness for the
company.
Opportunity Threat
Apple company has opportunity to
expand their distribution network.
Tough competition in the market
11
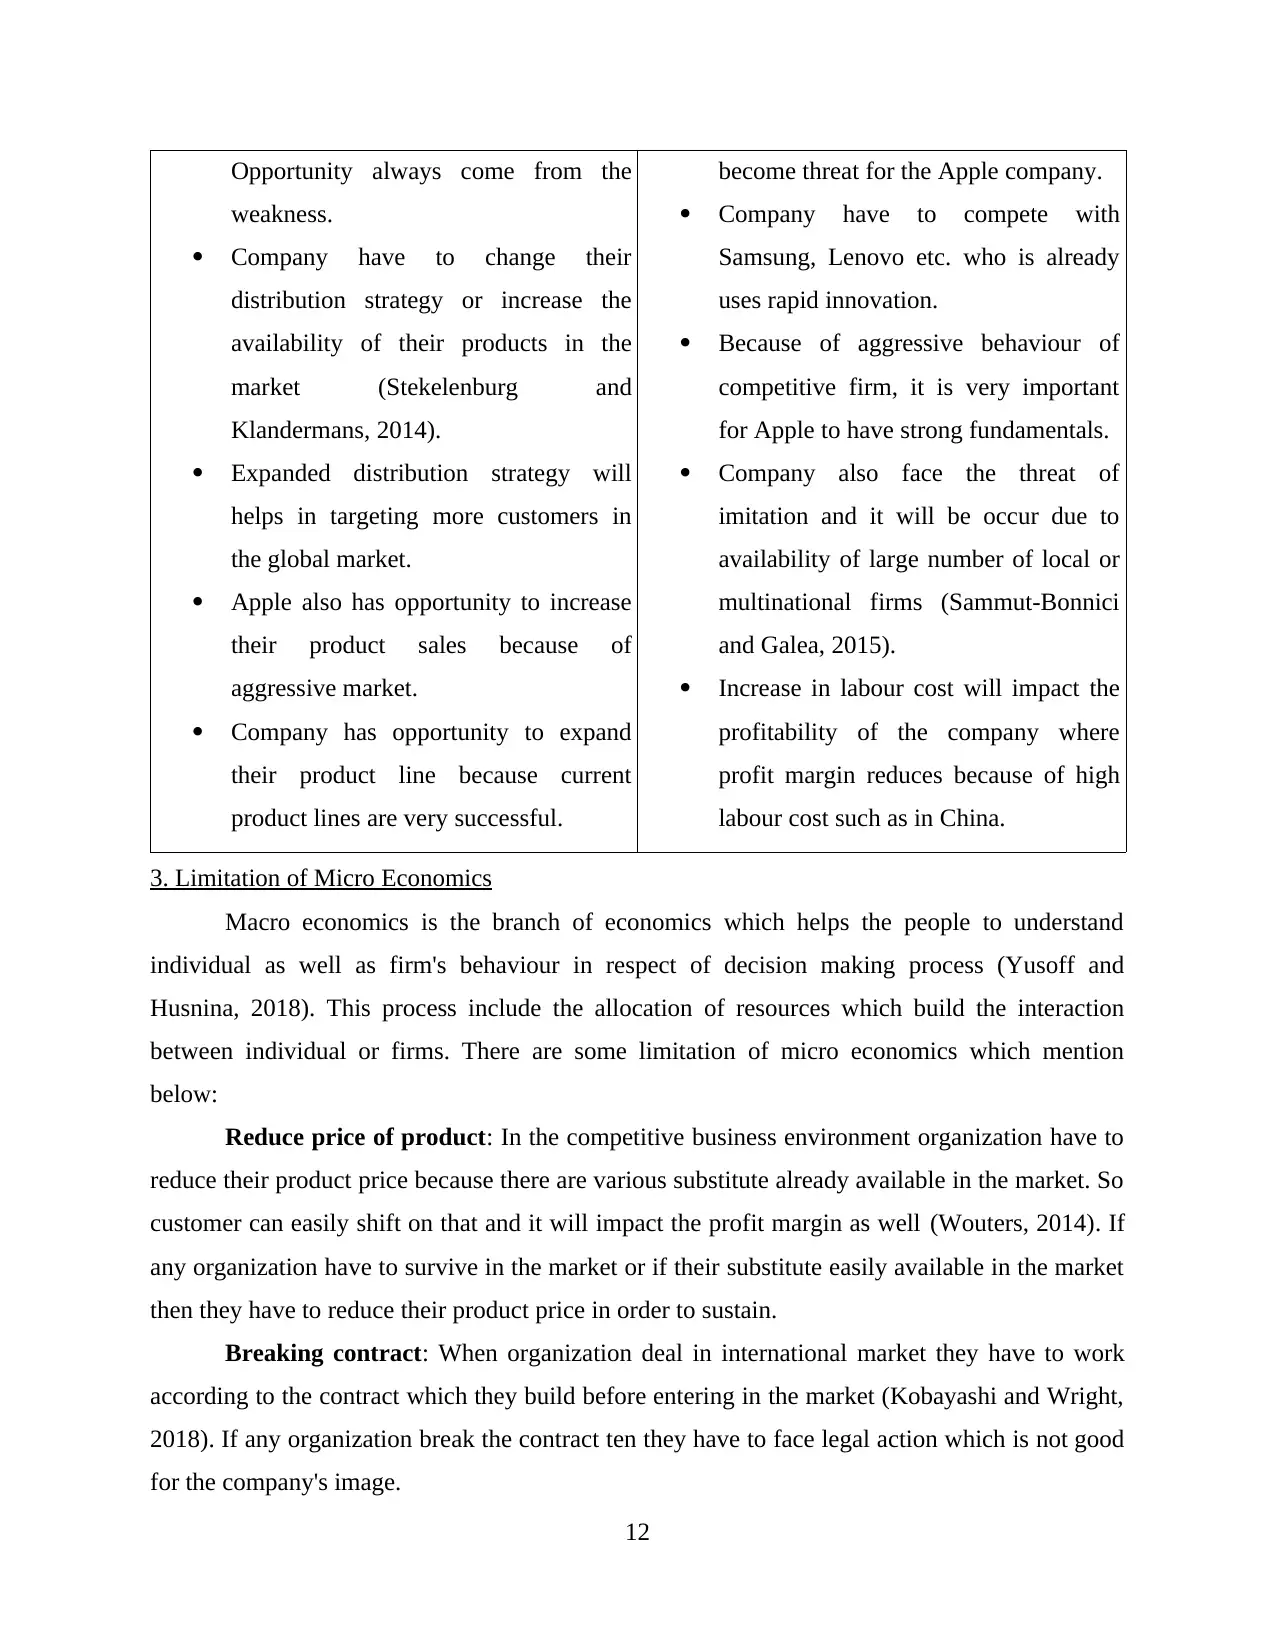
Opportunity always come from the
weakness.
Company have to change their
distribution strategy or increase the
availability of their products in the
market (Stekelenburg and
Klandermans, 2014).
Expanded distribution strategy will
helps in targeting more customers in
the global market.
Apple also has opportunity to increase
their product sales because of
aggressive market.
Company has opportunity to expand
their product line because current
product lines are very successful.
become threat for the Apple company.
Company have to compete with
Samsung, Lenovo etc. who is already
uses rapid innovation.
Because of aggressive behaviour of
competitive firm, it is very important
for Apple to have strong fundamentals.
Company also face the threat of
imitation and it will be occur due to
availability of large number of local or
multinational firms (Sammut‐Bonnici
and Galea, 2015).
Increase in labour cost will impact the
profitability of the company where
profit margin reduces because of high
labour cost such as in China.
3. Limitation of Micro Economics
Macro economics is the branch of economics which helps the people to understand
individual as well as firm's behaviour in respect of decision making process (Yusoff and
Husnina, 2018). This process include the allocation of resources which build the interaction
between individual or firms. There are some limitation of micro economics which mention
below:
Reduce price of product: In the competitive business environment organization have to
reduce their product price because there are various substitute already available in the market. So
customer can easily shift on that and it will impact the profit margin as well (Wouters, 2014). If
any organization have to survive in the market or if their substitute easily available in the market
then they have to reduce their product price in order to sustain.
Breaking contract: When organization deal in international market they have to work
according to the contract which they build before entering in the market (Kobayashi and Wright,
2018). If any organization break the contract ten they have to face legal action which is not good
for the company's image.
12
⊘ This is a preview!⊘
Do you want full access?
Subscribe today to unlock all pages.
Trusted by 1+ million students worldwide
1 out of 16
Related Documents


Your All-in-One AI-Powered Toolkit for Academic Success.
+13062052269
info@desklib.com
Available 24*7 on WhatsApp / Email
![[object Object]](/_next/static/media/star-bottom.7253800d.svg)
Unlock your academic potential
Copyright © 2020–2026 A2Z Services. All Rights Reserved. Developed and managed by ZUCOL.