Comprehensive Financial Ratio Analysis Report for Apple Inc.
VerifiedAdded on  2022/09/06
|6
|694
|16
Report
AI Summary
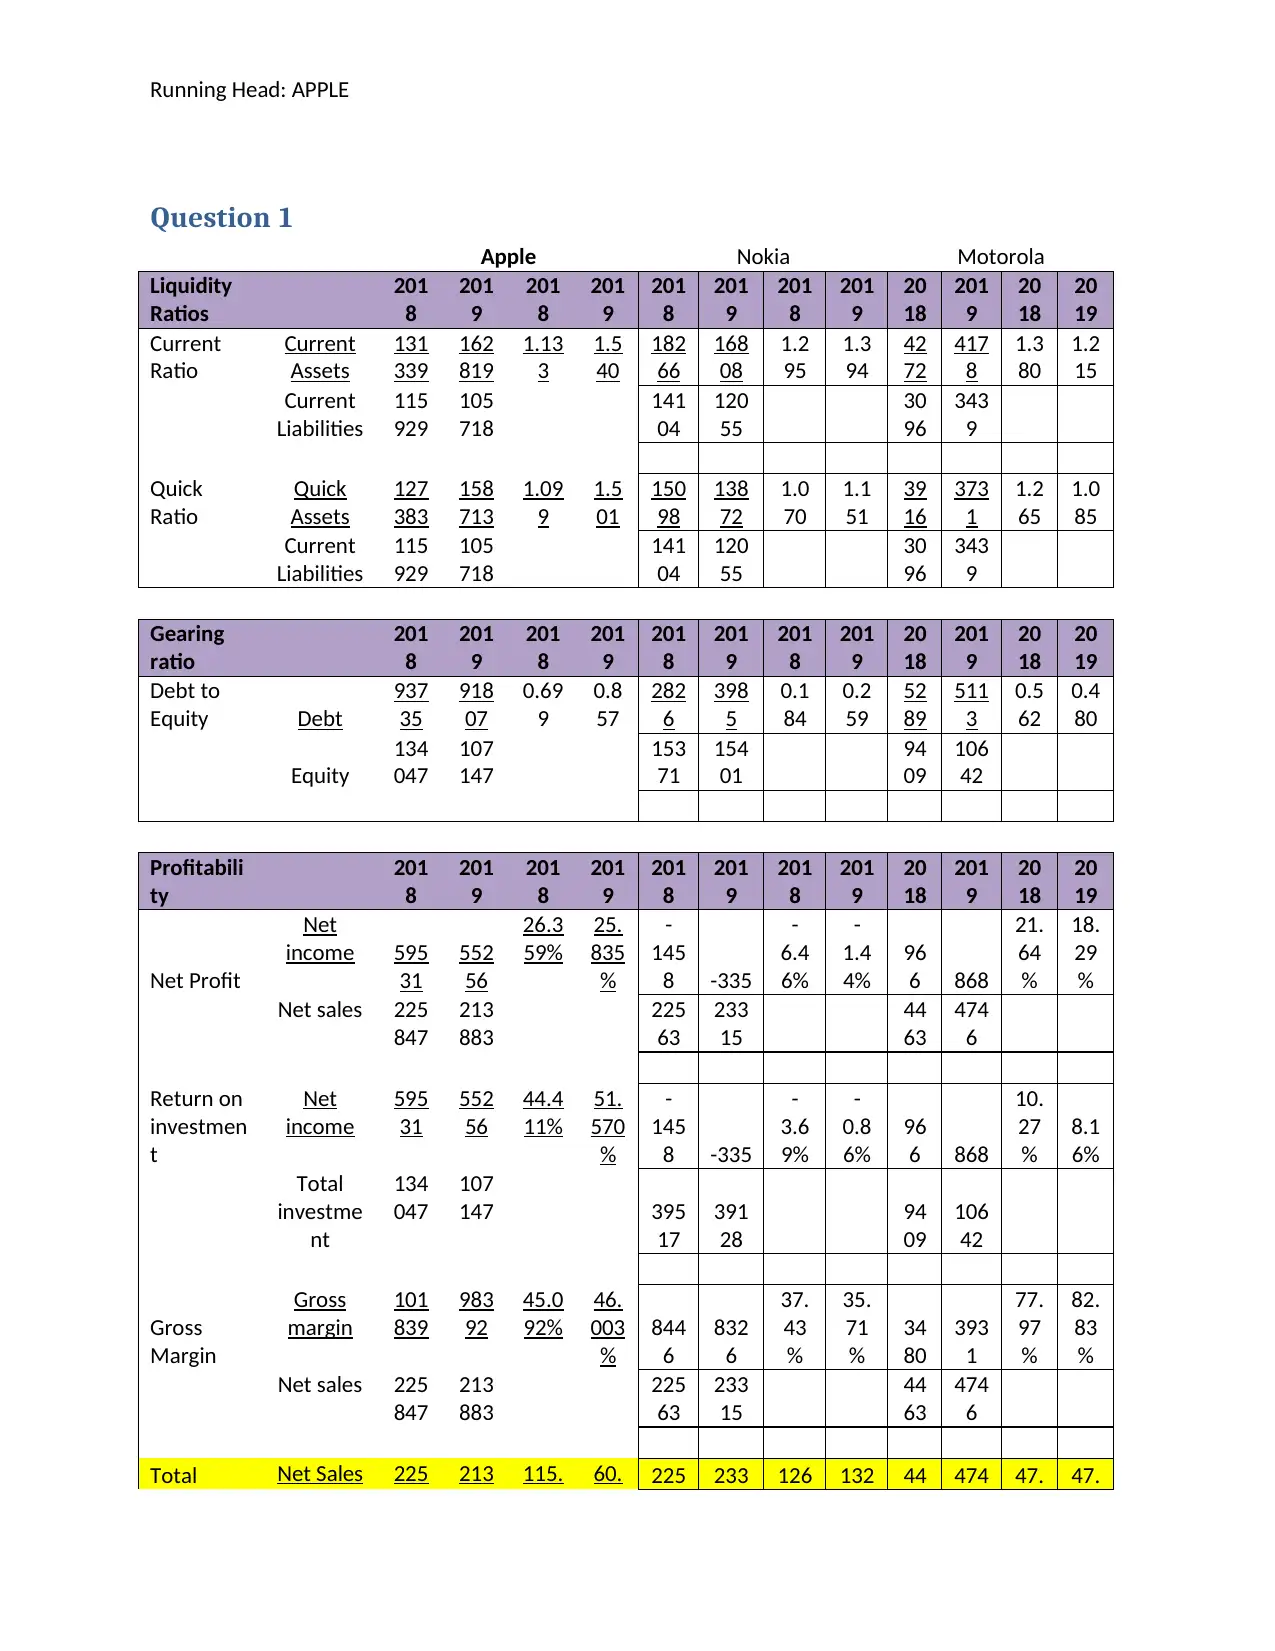
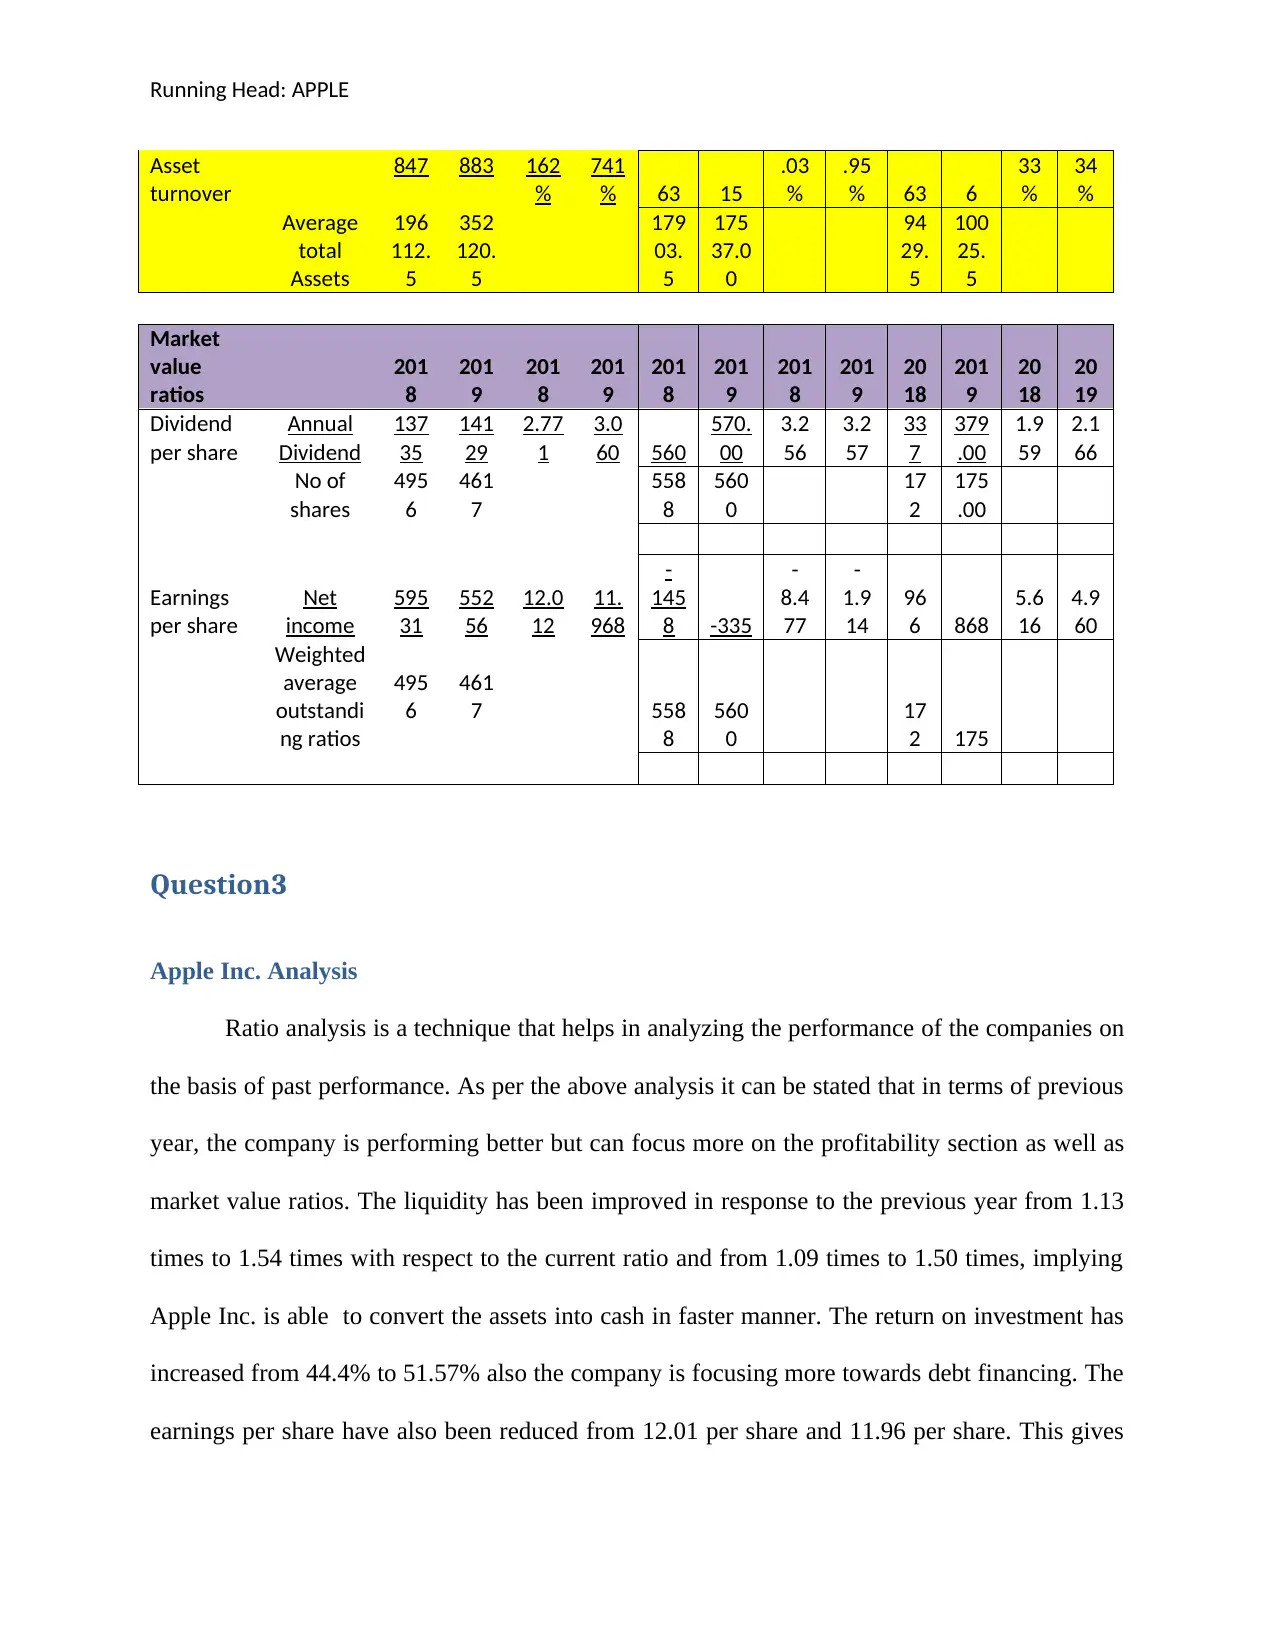
This report presents a comprehensive ratio analysis of Apple Inc.'s financial performance, comparing the current and prior years. It includes the calculation of various financial ratios such as current ratio, quick ratio, gearing ratio, gross margin, return on investment, asset turnover, dividend per share, and earnings per share. The analysis compares Apple's performance with that of its competitors. The report highlights key trends in liquidity, profitability, and market value ratios. The analysis is based on data extracted from Apple's financial statements. The report also emphasizes on the significance of ratio analysis in assessing a company's financial health and its limitations. The report also includes references to the source of data used in the analysis.

Running Head: APPLE 1
APPLE
APPLE
Paraphrase This Document
Need a fresh take? Get an instant paraphrase of this document with our AI Paraphraser

Running Head: APPLE
Contents
Question 1...................................................................................................................................................3
Question3....................................................................................................................................................4
Apple Inc. Analysis.....................................................................................................................................4
References...................................................................................................................................................5

Running Head: APPLE
Question 1
Apple Nokia Motorola
Liquidity
Ratios
201
8
201
9
201
8
201
9
201
8
201
9
201
8
201
9
20
18
201
9
20
18
20
19
Current
Ratio
Current
Assets
131
339
162
819
1.13
3
1.5
40
182
66
168
08
1.2
95
1.3
94
42
72
417
8
1.3
80
1.2
15
Current
Liabilities
115
929
105
718
141
04
120
55
30
96
343
9
Quick
Ratio
Quick
Assets
127
383
158
713
1.09
9
1.5
01
150
98
138
72
1.0
70
1.1
51
39
16
373
1
1.2
65
1.0
85
Current
Liabilities
115
929
105
718
141
04
120
55
30
96
343
9
Gearing
ratio
201
8
201
9
201
8
201
9
201
8
201
9
201
8
201
9
20
18
201
9
20
18
20
19
Debt to
Equity Debt
937
35
918
07
0.69
9
0.8
57
282
6
398
5
0.1
84
0.2
59
52
89
511
3
0.5
62
0.4
80
Equity
134
047
107
147
153
71
154
01
94
09
106
42
Profitabili
ty
201
8
201
9
201
8
201
9
201
8
201
9
201
8
201
9
20
18
201
9
20
18
20
19
Net Profit
Net
income 595
31
552
56
26.3
59%
25.
835
%
-
145
8 -335
-
6.4
6%
-
1.4
4%
96
6 868
21.
64
%
18.
29
%
Net sales 225
847
213
883
225
63
233
15
44
63
474
6
Return on
investmen
t
Net
income
595
31
552
56
44.4
11%
51.
570
%
-
145
8 -335
-
3.6
9%
-
0.8
6%
96
6 868
10.
27
%
8.1
6%
Total
investme
nt
134
047
107
147 395
17
391
28
94
09
106
42
Gross
Margin
Gross
margin
101
839
983
92
45.0
92%
46.
003
%
844
6
832
6
37.
43
%
35.
71
%
34
80
393
1
77.
97
%
82.
83
%
Net sales 225
847
213
883
225
63
233
15
44
63
474
6
Total Net Sales 225 213 115. 60. 225 233 126 132 44 474 47. 47.
⊘ This is a preview!⊘
Do you want full access?
Subscribe today to unlock all pages.

Trusted by 1+ million students worldwide

Running Head: APPLE
Asset
turnover
847 883 162
%
741
% 63 15
.03
%
.95
% 63 6
33
%
34
%
Average
total
Assets
196
112.
5
352
120.
5
179
03.
5
175
37.0
0
94
29.
5
100
25.
5
Market
value
ratios
201
8
201
9
201
8
201
9
201
8
201
9
201
8
201
9
20
18
201
9
20
18
20
19
Dividend
per share
Annual
Dividend
137
35
141
29
2.77
1
3.0
60 560
570.
00
3.2
56
3.2
57
33
7
379
.00
1.9
59
2.1
66
No of
shares
495
6
461
7
558
8
560
0
17
2
175
.00
Earnings
per share
Net
income
595
31
552
56
12.0
12
11.
968
-
145
8 -335
-
8.4
77
-
1.9
14
96
6 868
5.6
16
4.9
60
Weighted
average
outstandi
ng ratios
495
6
461
7 558
8
560
0
17
2 175
Question3
Apple Inc. Analysis
Ratio analysis is a technique that helps in analyzing the performance of the companies on
the basis of past performance. As per the above analysis it can be stated that in terms of previous
year, the company is performing better but can focus more on the profitability section as well as
market value ratios. The liquidity has been improved in response to the previous year from 1.13
times to 1.54 times with respect to the current ratio and from 1.09 times to 1.50 times, implying
Apple Inc. is able to convert the assets into cash in faster manner. The return on investment has
increased from 44.4% to 51.57% also the company is focusing more towards debt financing. The
earnings per share have also been reduced from 12.01 per share and 11.96 per share. This gives
Paraphrase This Document
Need a fresh take? Get an instant paraphrase of this document with our AI Paraphraser

Running Head: APPLE
the mixed results and states that liquidity is improving and profitability shall be focused more
(Svynarenko, Zhang & Kim, 2019).
The ratios that are significant from the point of view of industry are return on equity and
dividend per share. The biggest strength of ratio analysis is that it can analyze the profitability,
liquidity, and solvency and gearing ratio at the same time, however ratio lacks in delivering the
entire information and its impact with respect to other players playing in the same industry. In
order to figure out more about the company, it can be available in the section of notes to
accounts in FORM 10-K or else in the director’s report (Kim & Im, 2017).

Running Head: APPLE
References
Kim, J., & Im, C. (2017). Study on corporate social responsibility (CSR): Focus on tax
avoidance and financial ratio analysis. Sustainability, 9(10), 1710.
Svynarenko, R., Zhang, Q., & Kim, H. (2019). The financial burden of cancer: financial ratio
analysis. Journal of Family and Economic Issues, 40(2), 165-179.
⊘ This is a preview!⊘
Do you want full access?
Subscribe today to unlock all pages.

Trusted by 1+ million students worldwide
1 out of 6
Related Documents

Your All-in-One AI-Powered Toolkit for Academic Success.
 +13062052269
info@desklib.com
Available 24*7 on WhatsApp / Email
Unlock your academic potential
Copyright © 2020–2025 A2Z Services. All Rights Reserved. Developed and managed by ZUCOL.