Comparative Financial Analysis of Apple and Samsung Companies
VerifiedAdded on 2022/09/28
|20
|2927
|23
Project
AI Summary
This project presents a comprehensive comparative analysis of the financial performance of Apple and Samsung, two of the world's leading technology companies. The paper examines their business models, management accounting systems, and strategic decision-making processes to understand how each company manages its vast consumer base. The analysis includes a detailed comparison of their financial statements, focusing on key metrics such as earnings growth, revenue growth, profitability, and market share. The study reveals that while Apple demonstrates superior financial performance in several areas, Samsung excels in smartphone market share. The project also explores the contrasting approaches of Apple's design-focused and outsourcing-based model versus Samsung's vertically integrated model. The conclusion highlights Apple's stronger economic outlook, emphasizing the significance of effective cost management and unique business strategies. The paper includes an executive summary, detailed financial data in the appendices, and follows APA format, fulfilling the requirements of a final research project for an MBA course in managerial accounting.
Running head: FINANCIAL PERFORMANCE & ANALYSIS OF APPLE & SAMSUNG 1
Financial Performance & Analysis of Apple & Samsung
Name
Institutional Affiliation
Financial Performance & Analysis of Apple & Samsung
Name
Institutional Affiliation
Paraphrase This Document
Need a fresh take? Get an instant paraphrase of this document with our AI Paraphraser
FINANCIAL PERFORMANCE & ANALYSIS OF APPLE & SAMSUNG 2
FINANCIAL PERFORMANCE & ANALYSIS OF APPLE & SAMSUNG
Executive Summary
This paper compares Samsung and Apple Companies based on their financial
performance and financial analysis to showcase how each deals with and manages their
enormous consumer base using management accounting and strategic decision-making focus.
The analysis revealed that Apple has financially performed better than Samsung in terms of
profitability, earning growth as well as revenue growth. However, in Samsung has performed
well in terms of smartphone market share. The business models used by Apple seems to be much
beneficial and unique as compared to that of Samsung hence the differences in successes. While
Samsung spends much time and efforts in R&D, Apple has saved a lot of time and money which
would otherwise be spent in R&D. The general conclusion is that Apple’s economic outlook
remains quite promising going into the future than Samsung.
FINANCIAL PERFORMANCE & ANALYSIS OF APPLE & SAMSUNG 3
Table of Contents
Executive Summary.........................................................................................................................2
Title:.................................................................................................................................................5
Thesis:..............................................................................................................................................5
Introduction:....................................................................................................................................5
Comparison: Apple versus Samsung...............................................................................................5
1. Business Model Compared.......................................................................................................5
2. Management Account System Compared................................................................................7
3. Financial Performance and Financial Analysis Compared......................................................8
Similarities................................................................................................................................8
Differences................................................................................................................................8
Conclusion.....................................................................................................................................12
References......................................................................................................................................14
Appendices....................................................................................................................................16
Appendix 1: Apple Leads in earnings, revenue and profitability growth..................................16
Appendix 2: Apple Financial Summary:....................................................................................16
Appendix 3: Apple Income Statement.......................................................................................17
Appendix 4: Apple Balance sheet..............................................................................................17
Appendix 5: Apple Cash Flow Statement..................................................................................18
Appendix 7: Samsung Financial summary.................................................................................18
⊘ This is a preview!⊘
Do you want full access?
Subscribe today to unlock all pages.
Trusted by 1+ million students worldwide
FINANCIAL PERFORMANCE & ANALYSIS OF APPLE & SAMSUNG 4
Appendix 8: Samsung Income Statement..................................................................................19
Appendix 9: Samsung Balance Sheet.........................................................................................19
Appendix 10: Samsung Cash Flow Statement...........................................................................20
Paraphrase This Document
Need a fresh take? Get an instant paraphrase of this document with our AI Paraphraser

FINANCIAL PERFORMANCE & ANALYSIS OF APPLE & SAMSUNG 5
Title:
Financial performance and financial analysis of Apple and Samsung
Thesis:
The paper presents a comprehensive comparative analysis of Apple and Samsung’s
financial statements to showcase how the address and manage their enormous customer base
through management accounting (MA) and strategic decision-making practices.
Introduction:
Samsung Electronics and Apple Inc, electronic device remain among the global biggest
technological innovations corporations presently. Samsung’s case provides a novel paradigm on
how top-to-bottom incorporated corporations functions in the contemporary world. Technologies
have increasingly been adjusting how market are functioning. They have shaped how top-to-
bottom incorporated companies like Samsung functions. Whereas Samsung is controlling much
its value store, it, also, delegate certain of its stores to another. Such a business design permits
Samsung to develop on its proficiencies and simultaneously, lower deal costs thereby fulfilling
the requirements of an extremely influential technological innovation industry/market. The
current study entails the financial analysis of Apple and its rival, Samsung and shows the unique
differences and similarities in how they deal with their consumer bases to create a sustained
competitive edge.
Comparison: Apple versus Samsung
1. Business Model Compared
Apple: The business model of Apple is design, integration alongside outsourcing. From
Apple’s target marketing, research as well as product design, it remains an increasingly focused
FINANCIAL PERFORMANCE & ANALYSIS OF APPLE & SAMSUNG 6
firm compared to Samsung. It is further substantially profitable than Samsung and it is successful
in design alongside integration, and no trivial extent of risk (Nicolás Marín Ximénez & J. Sanz,
2014). All Apple products encompass programs which work effectively with one another,
however, not with any of Apple’s rivals’ products that makes Apple’s customers to keep
purchasing its products and hard to switch to Samsung (Chang, Kim & Joo, 2013). Almost 75%
revenue of Apple arise from its iPhone line, which makes it single product-reliant. Apple is to
surpass cost of research and development by outsourcing hardware constituent assembly and
product, and hence Apple’s CapEx is looking profoundly distinguished from that of Samsung.
This expands Apple’s margin and enhance AAPL stock, and remains one of the central rationale
for Apple’s ability to exponentially grow. Apple never races to be first; but it let other rival firms
like Samsung to consume much time and effort on R&D as well as early market development
prior to swooping in and enhancing everything (Chen & Ann, 2016).
Samsung: It is using vertical integration alongside product volume type of business
model. It is operating like several Asian manufacturers like NEC and Sony with emphasis on
flood of products alongside vertical integration. Samsung remains in many markets including
smartphones, flat panels, sensors, batteries, cameras, LED-lights, gaming systems, cellphone
carriers, tablets, appliances alongside medical electronics. Samsung initially engaged in stiff
competition with and in most instances defeated, Japanese technologies firms in the ‘80s and
‘90s before competing with Apple. Samsung spends a fortune on R&D alongside capital
spending (CapEx) which is paying off in its low-and mid-end segments, however, Apple is
serving high-end product segments. Samsung depends on its vertical integration as a central
sustained competitive edge whereas Apple continues to import components worth billions of
dollars from its competitors annually, Samsung remains indebted to no one. It is never a
⊘ This is a preview!⊘
Do you want full access?
Subscribe today to unlock all pages.
Trusted by 1+ million students worldwide
FINANCIAL PERFORMANCE & ANALYSIS OF APPLE & SAMSUNG 7
enchanted formula, Nokia stood nearly as integrated previously before getting flattened by
Samsung and Apple, however, Samsung is control certain logistical certainty than Apple (Yun,
Lee & Aoshima, 2019).
2. Management Account System Compared
Apple: Activity Based Accounting: Apple uses ABC in its product valuing through
activity-based management. ABC gives Apple’s management essential info which is used in
making decision and planning on financial product pricing (control). ABC also helps Apple to
select best line of its production which usable by different products. Apple has effective costing
method since it surges manufacturing overhead costs and restricts their association with direct
labor inputs alongside machines working hours and also help diversify customer tastes and
products (Haslam, Tsitsianis, Andersson & Yin 2013). It also helps Apple control production rate
of distinguished products and help Apple to monitor operation cost from production process
commencement to the point the products hit final consumer. The MAP (minimum advertised
cost) remains useful in Apple’s retail strategy as it has helped Apple to restrict its retailers never
to advertise its products below some minimum cost (Rasheed, Nawaz & Abbas, 2012).
The main measures embraced by Apple boots profitability encompass cost management
(via ABC); transfer pricing as well as responsibility/sustainability accounting. Nonetheless, other
criteria exist that account for Apple’s success. Apple small sizes remains a boost to its success.
R&D expenses remains low as opposed to Samsung. Apple solely emphasize on extremely few
products at a point and hence able to control its expense on R&D unlike Samsung. Apple’s
workforce volume stays low relative to Samsung and hence controls its expense on SG&A (Tsai
& Chang, 2013). Apple’s profit margin remain far higher because it is charging premium prices
for all its products… Apple offshoring decision is generating huge gains via the provision of tax
Paraphrase This Document
Need a fresh take? Get an instant paraphrase of this document with our AI Paraphraser
FINANCIAL PERFORMANCE & ANALYSIS OF APPLE & SAMSUNG 8
shields over cash-flows, nonetheless, Apple’s suppliers relations with Foxconn, is slowly
worsening (Gardere, Shari & Maman, 2018). Apple’s RDI idea remains great for projects
including trivial group of individuals, however, as it expands, Apple shall face a shared corporate
problem such as goal incongruence, moral hazard, free rider problem, horizon problem,
alongside incentives to shirk. Apple must take precautions prior to making high volume
expansion.
Samsung: The Company has significant benefited from the use of target costing by
increasingly appealing to consumers. Samsung has both high-end flagship and budget-friendlier
phones fitted with advanced features. Samsung consumes a significant share of its budget
advertising and marketing and in corporate social responsibilities. Sales promotional programs
are fundamental marketing techniques in Samsung (Omair, Amin & Farooq, 2014). Samsung
has ensured DM&C in all its markets and marketing subsidiaries. Samsung is aiming at
delivering budget-friendly products to its customers through experienced workforce (Lee, Kim
and Park 2015).
3. Financial Performance and Financial Analysis Compared
Similarities
Both Samsung and Apple have same balance sheet, cash flow statement and income
statement formats yet different items and values. See appendices (2 to 10) for detailed analysis.
Differences
EPS: Earning per share is higher in Samsung than in Apple because Apple has high
shares outstanding up to $900M relative to Samsung’s $149M. Apple also has extremely low
common stockholders’ equity of nearly $35M as opposed Samsung’s $897M hence making
FINANCIAL PERFORMANCE & ANALYSIS OF APPLE & SAMSUNG 9
Apple’s cost per share to decrease and investors shall choose investing in Samsung instead Apple
to get higher ROI.
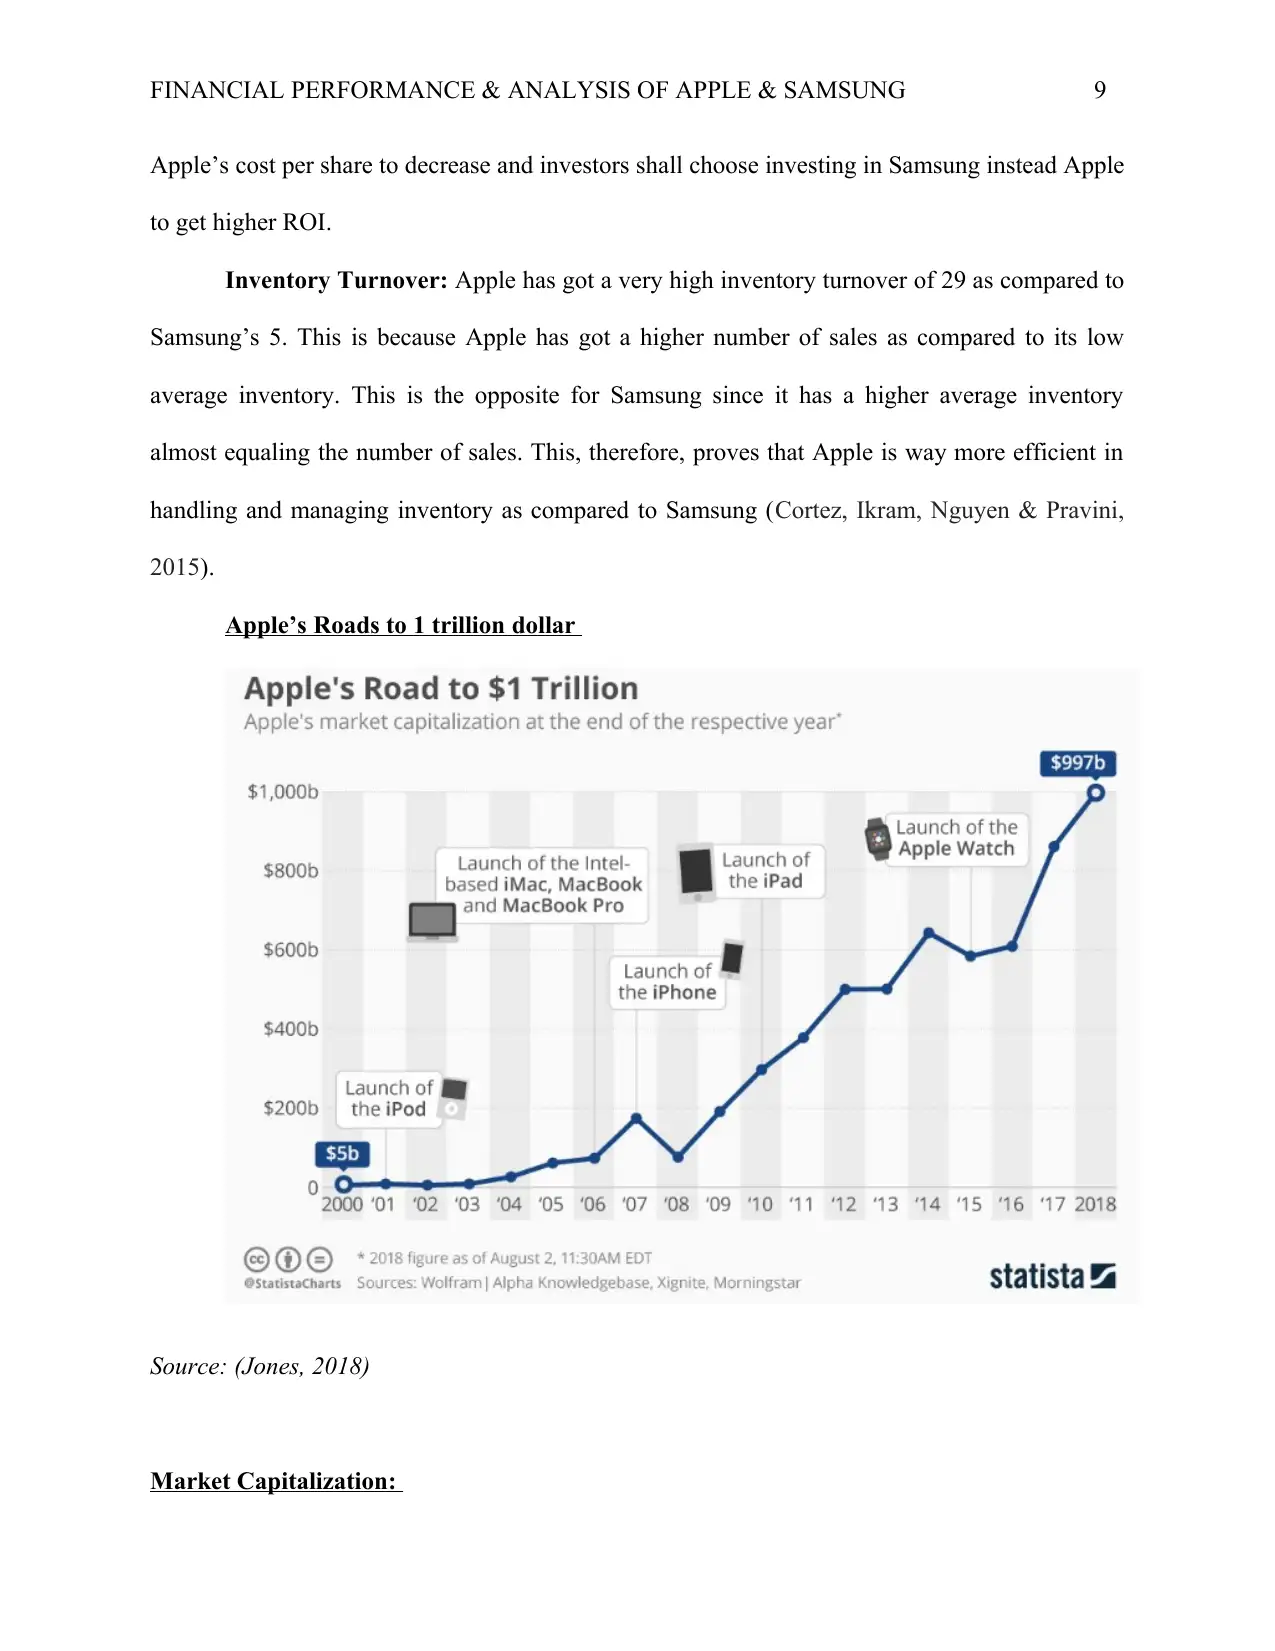
Inventory Turnover: Apple has got a very high inventory turnover of 29 as compared to
Samsung’s 5. This is because Apple has got a higher number of sales as compared to its low
average inventory. This is the opposite for Samsung since it has a higher average inventory
almost equaling the number of sales. This, therefore, proves that Apple is way more efficient in
handling and managing inventory as compared to Samsung (Cortez, Ikram, Nguyen & Pravini,
2015).
Apple’s Roads to 1 trillion dollar
Source: (Jones, 2018)
Market Capitalization:
Apple’s cost per share to decrease and investors shall choose investing in Samsung instead Apple
to get higher ROI.
Inventory Turnover: Apple has got a very high inventory turnover of 29 as compared to
Samsung’s 5. This is because Apple has got a higher number of sales as compared to its low
average inventory. This is the opposite for Samsung since it has a higher average inventory
almost equaling the number of sales. This, therefore, proves that Apple is way more efficient in
handling and managing inventory as compared to Samsung (Cortez, Ikram, Nguyen & Pravini,
2015).
Apple’s Roads to 1 trillion dollar
Source: (Jones, 2018)
Market Capitalization:
⊘ This is a preview!⊘
Do you want full access?
Subscribe today to unlock all pages.
Trusted by 1+ million students worldwide
FINANCIAL PERFORMANCE & ANALYSIS OF APPLE & SAMSUNG 10
Samsung has a worldwide market of 314.65 trillion South Korean Won that translates to
about 282 billion dollars (Jones, 2018). The share opened at the price of SKW 46,550 or 41.74
USD on 26th September 2018 (Jones, 2018). The stock has been on a consistent surge nearly each
half-year when Samsung declares its financial statements. On the other hand, Apple has a market
cap of 1.07 trillion dollars and it was the 1st US-based firm to hit a valuation of one trillion dollar
in August 2018 (Jones, 2018).
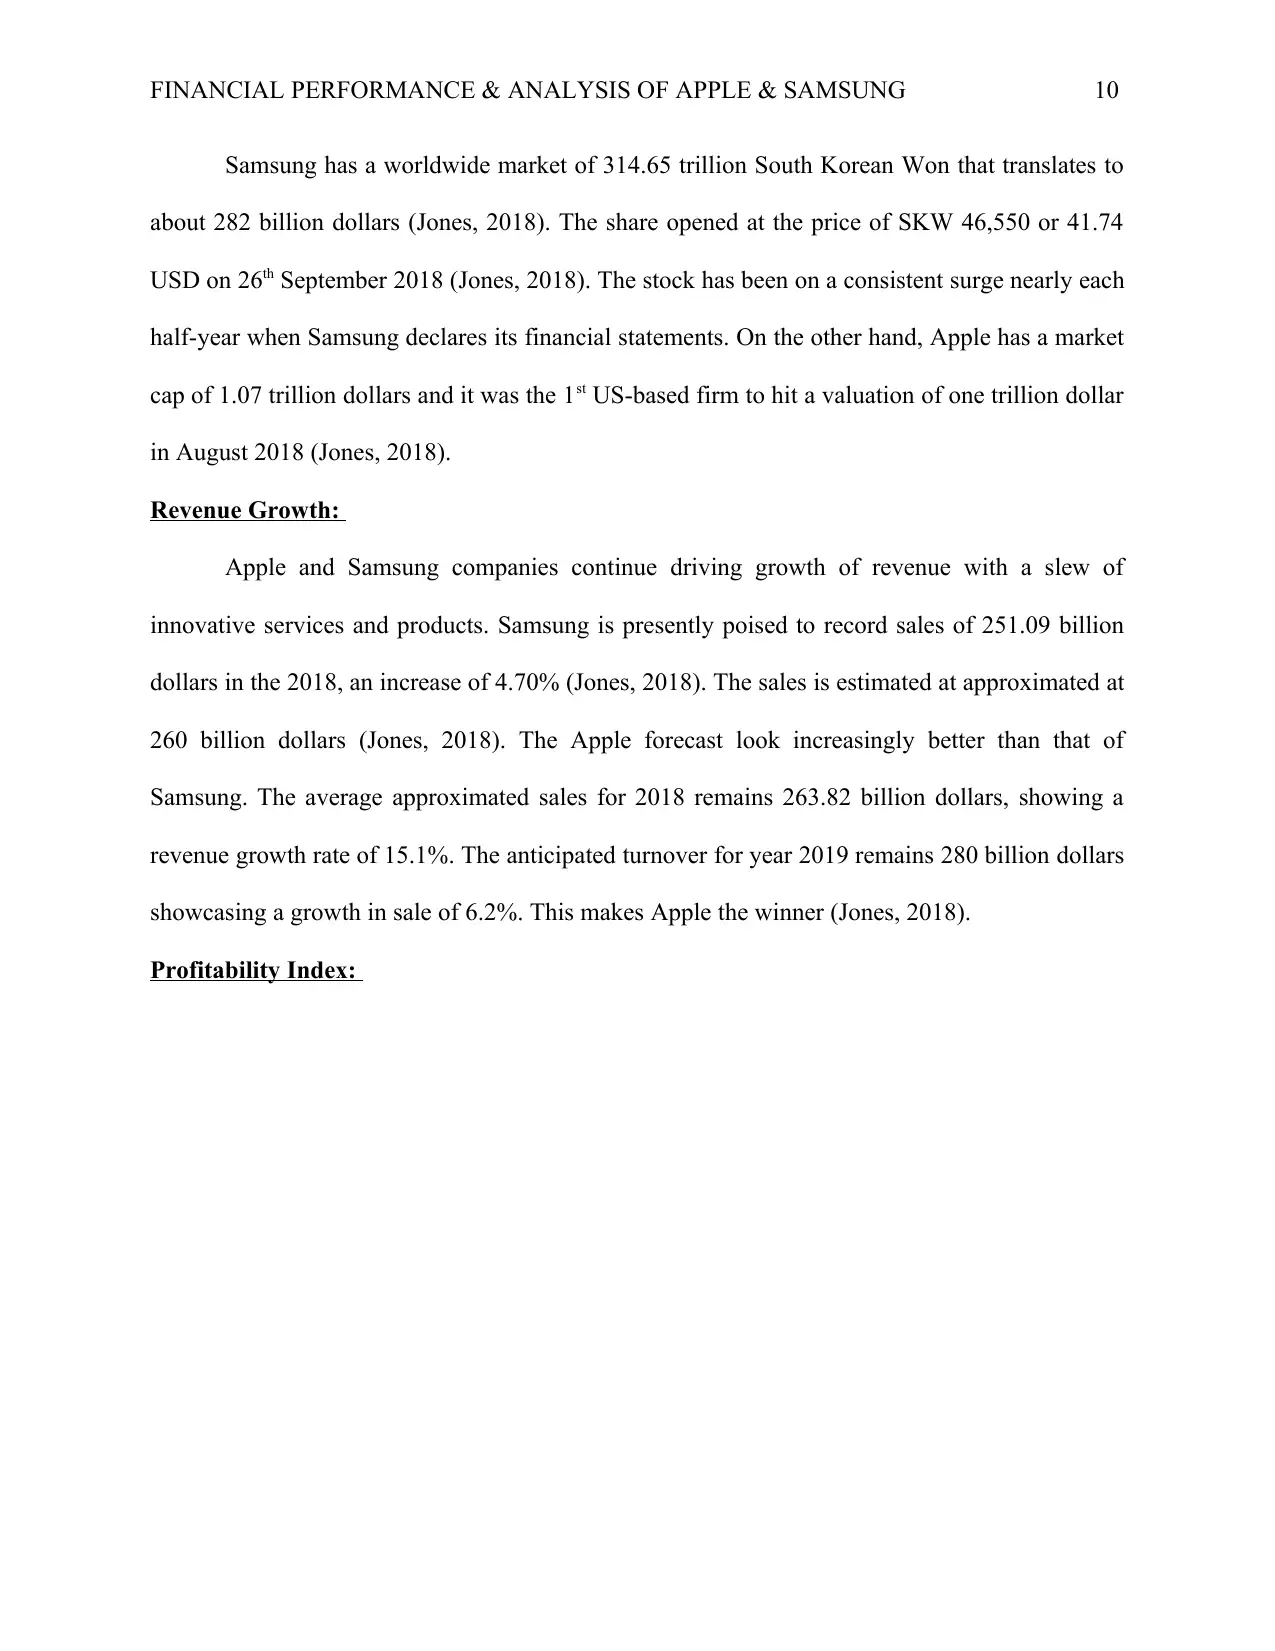
Revenue Growth:
Apple and Samsung companies continue driving growth of revenue with a slew of
innovative services and products. Samsung is presently poised to record sales of 251.09 billion
dollars in the 2018, an increase of 4.70% (Jones, 2018). The sales is estimated at approximated at
260 billion dollars (Jones, 2018). The Apple forecast look increasingly better than that of
Samsung. The average approximated sales for 2018 remains 263.82 billion dollars, showing a
revenue growth rate of 15.1%. The anticipated turnover for year 2019 remains 280 billion dollars
showcasing a growth in sale of 6.2%. This makes Apple the winner (Jones, 2018).
Profitability Index:
Samsung has a worldwide market of 314.65 trillion South Korean Won that translates to
about 282 billion dollars (Jones, 2018). The share opened at the price of SKW 46,550 or 41.74
USD on 26th September 2018 (Jones, 2018). The stock has been on a consistent surge nearly each
half-year when Samsung declares its financial statements. On the other hand, Apple has a market
cap of 1.07 trillion dollars and it was the 1st US-based firm to hit a valuation of one trillion dollar
in August 2018 (Jones, 2018).
Revenue Growth:
Apple and Samsung companies continue driving growth of revenue with a slew of
innovative services and products. Samsung is presently poised to record sales of 251.09 billion
dollars in the 2018, an increase of 4.70% (Jones, 2018). The sales is estimated at approximated at
260 billion dollars (Jones, 2018). The Apple forecast look increasingly better than that of
Samsung. The average approximated sales for 2018 remains 263.82 billion dollars, showing a
revenue growth rate of 15.1%. The anticipated turnover for year 2019 remains 280 billion dollars
showcasing a growth in sale of 6.2%. This makes Apple the winner (Jones, 2018).
Profitability Index:
Paraphrase This Document
Need a fresh take? Get an instant paraphrase of this document with our AI Paraphraser
FINANCIAL PERFORMANCE & ANALYSIS OF APPLE & SAMSUNG 11
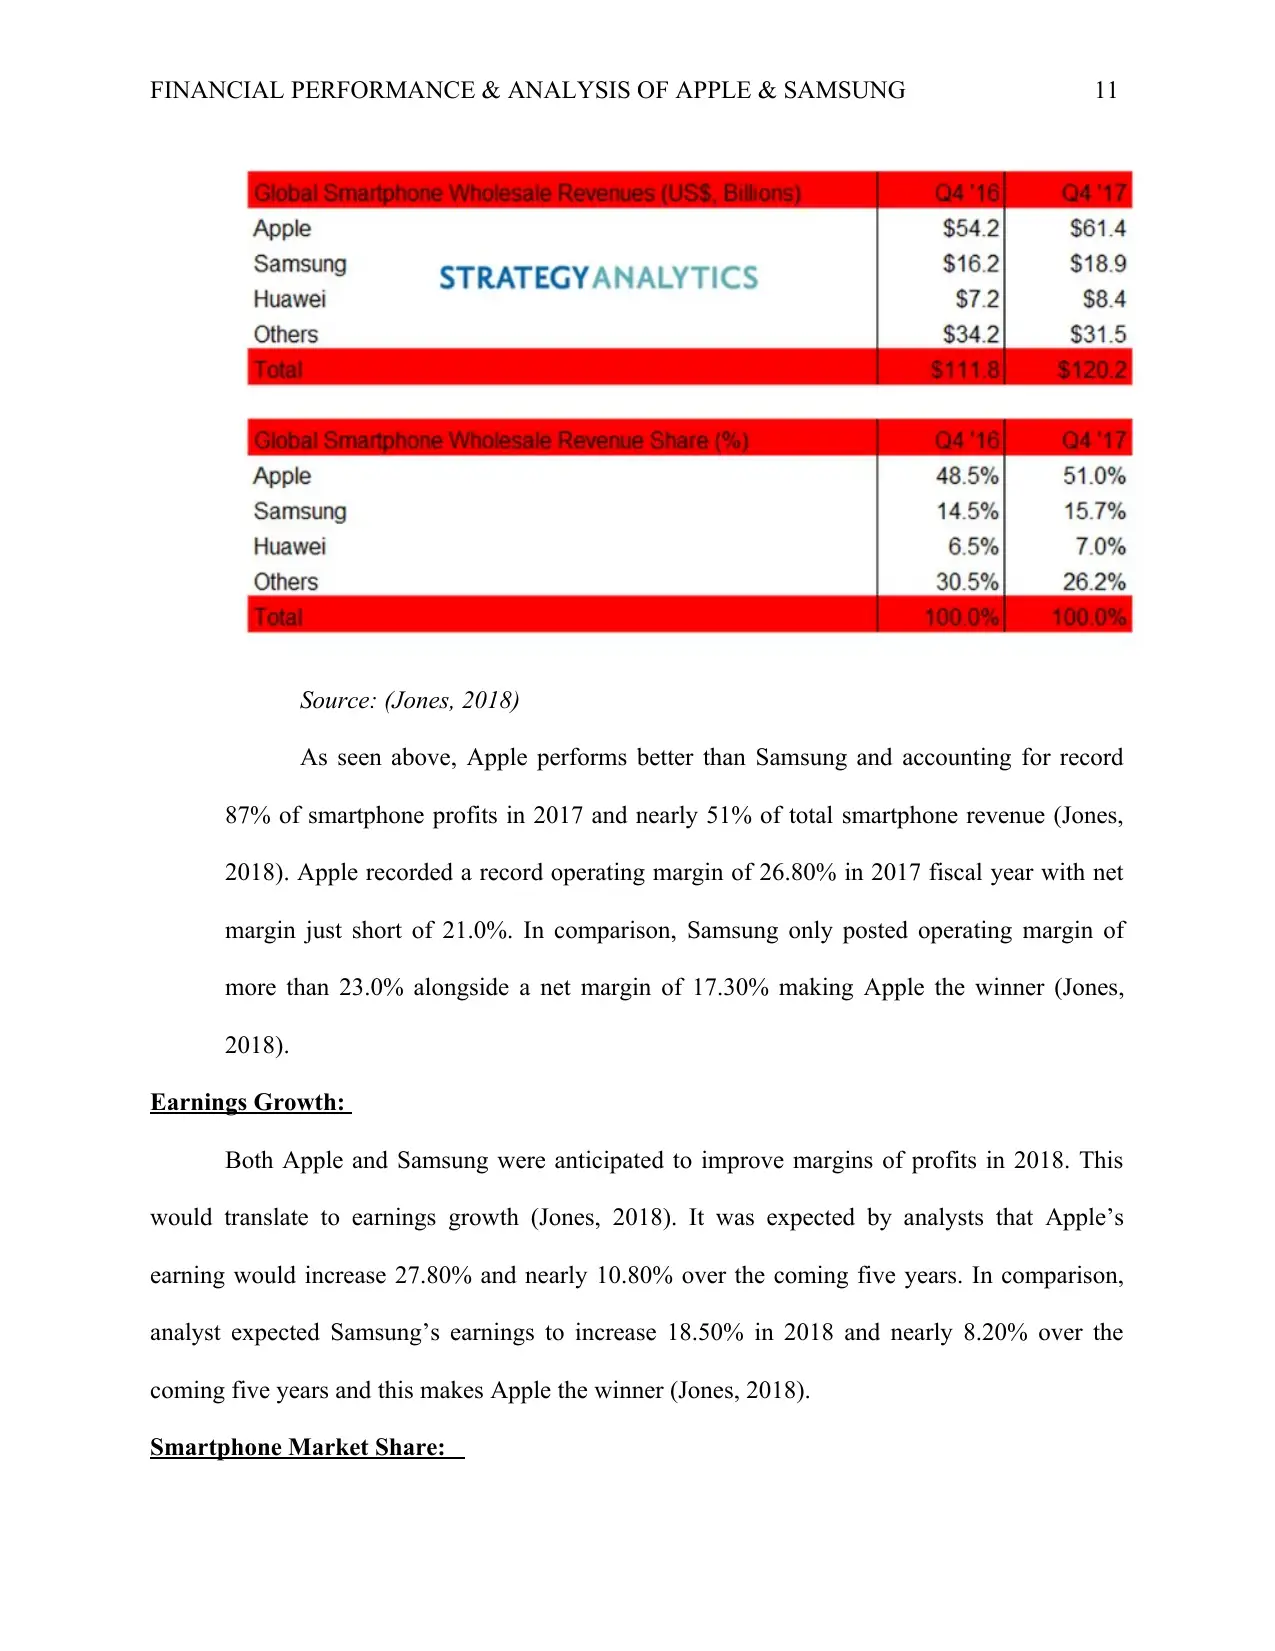
Source: (Jones, 2018)
As seen above, Apple performs better than Samsung and accounting for record
87% of smartphone profits in 2017 and nearly 51% of total smartphone revenue (Jones,
2018). Apple recorded a record operating margin of 26.80% in 2017 fiscal year with net
margin just short of 21.0%. In comparison, Samsung only posted operating margin of
more than 23.0% alongside a net margin of 17.30% making Apple the winner (Jones,
2018).
Earnings Growth:
Both Apple and Samsung were anticipated to improve margins of profits in 2018. This
would translate to earnings growth (Jones, 2018). It was expected by analysts that Apple’s
earning would increase 27.80% and nearly 10.80% over the coming five years. In comparison,
analyst expected Samsung’s earnings to increase 18.50% in 2018 and nearly 8.20% over the
coming five years and this makes Apple the winner (Jones, 2018).
Smartphone Market Share:
FINANCIAL PERFORMANCE & ANALYSIS OF APPLE & SAMSUNG 12
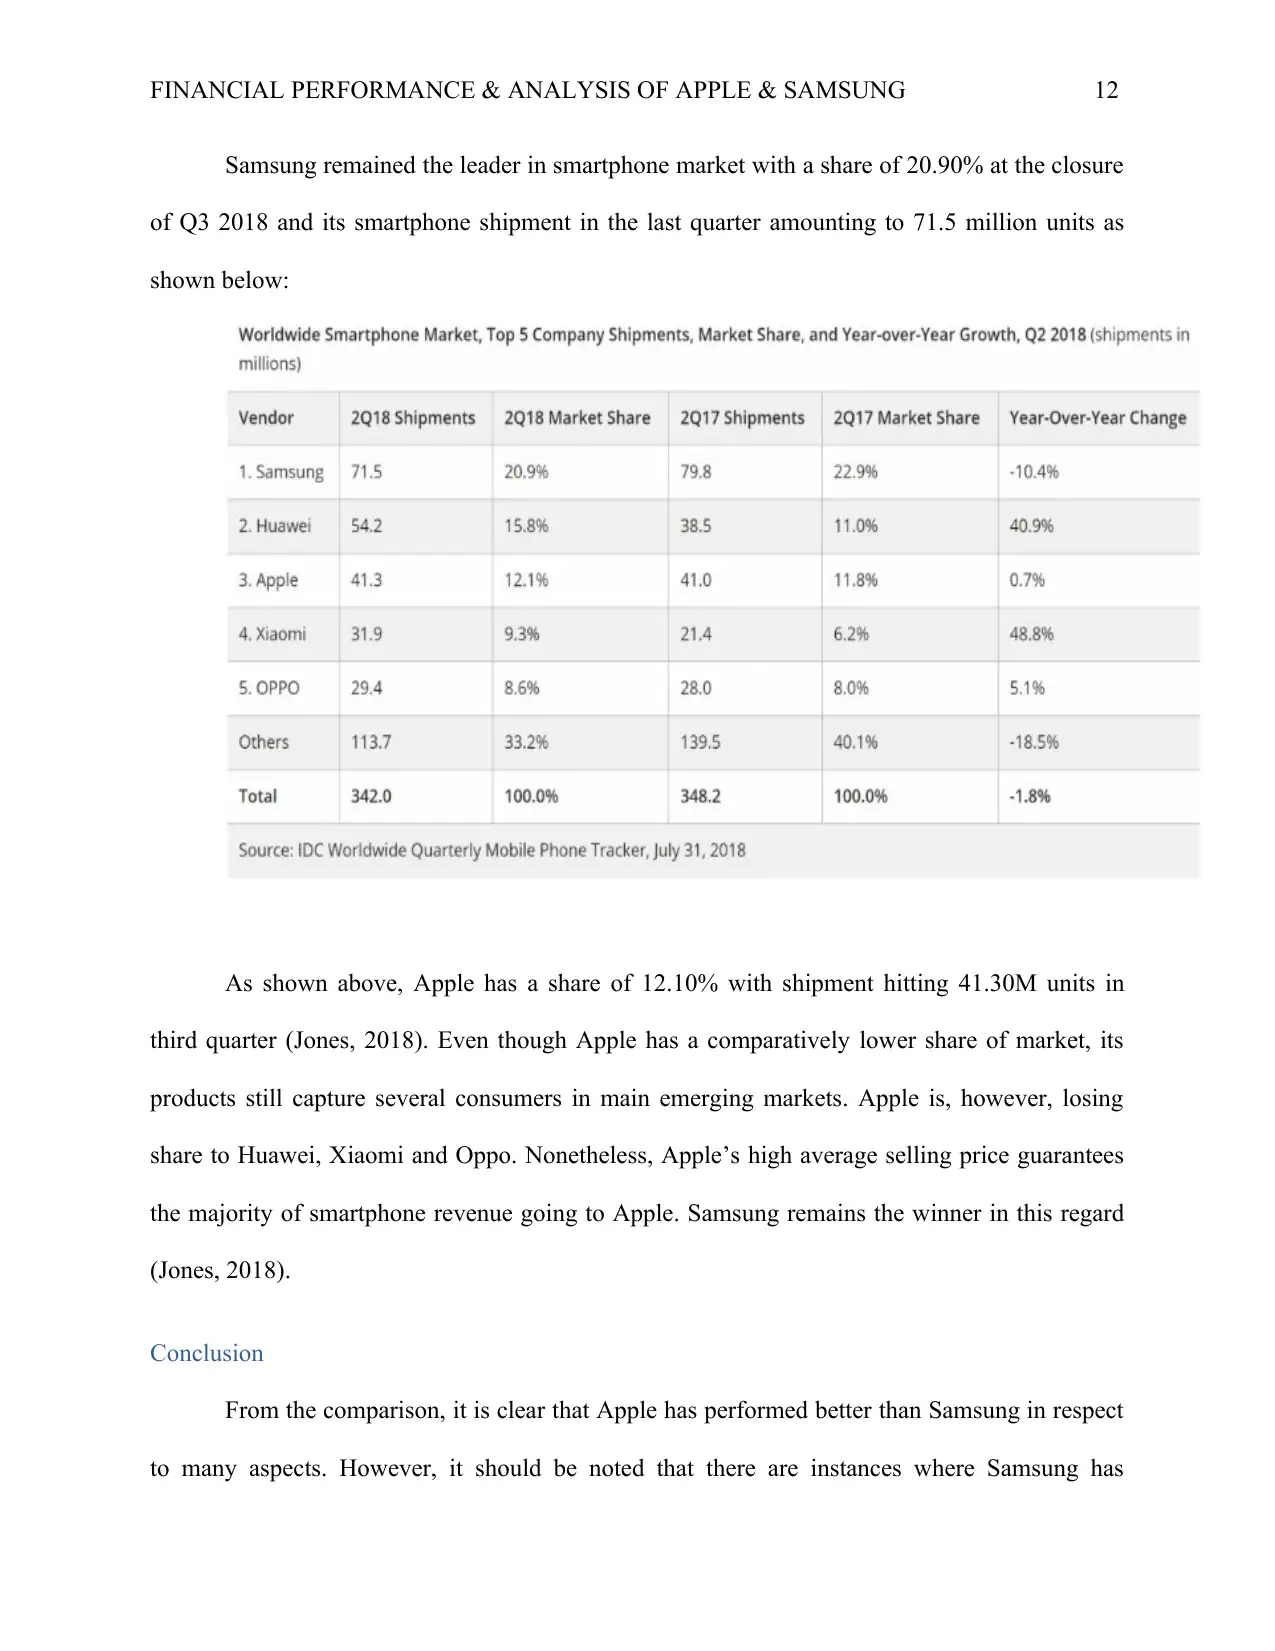
Samsung remained the leader in smartphone market with a share of 20.90% at the closure
of Q3 2018 and its smartphone shipment in the last quarter amounting to 71.5 million units as
shown below:
As shown above, Apple has a share of 12.10% with shipment hitting 41.30M units in
third quarter (Jones, 2018). Even though Apple has a comparatively lower share of market, its
products still capture several consumers in main emerging markets. Apple is, however, losing
share to Huawei, Xiaomi and Oppo. Nonetheless, Apple’s high average selling price guarantees
the majority of smartphone revenue going to Apple. Samsung remains the winner in this regard
(Jones, 2018).
Conclusion
From the comparison, it is clear that Apple has performed better than Samsung in respect
to many aspects. However, it should be noted that there are instances where Samsung has
⊘ This is a preview!⊘
Do you want full access?
Subscribe today to unlock all pages.
Trusted by 1+ million students worldwide
1 out of 20
Related Documents


Your All-in-One AI-Powered Toolkit for Academic Success.
+13062052269
info@desklib.com
Available 24*7 on WhatsApp / Email
![[object Object]](/_next/static/media/star-bottom.7253800d.svg)
Unlock your academic potential
Copyright © 2020–2026 A2Z Services. All Rights Reserved. Developed and managed by ZUCOL.