Detailed Financial Analysis: Apple and Samsung, LSC Malta MBA
VerifiedAdded on 2023/06/10
|22
|5581
|121
Report
AI Summary
This report provides a comprehensive financial analysis and comparison of Apple and Samsung, two major players in the telecommunications and hi-tech industry, covering the period from 2014 to 2017. It employs various financial tools, including ratio analysis, horizontal analysis, and vertical analysis, to critically compare and contrast the financial performance and financial positions of both companies. The analysis covers aspects such as net sales, cost of sales, gross profit, operating profit, and various assets and liabilities. Additionally, the report delves into the Corporate Social Responsibility (CSR) initiatives of both Samsung and Apple, examining their efforts in areas like employee health and safety, gender equality, recycling, waste reduction, carbon emissions, sustainable sourcing, and energy and water consumption. The study aims to identify the financial strengths and weaknesses of each company, providing valuable insights for investors and stakeholders.
Financial Analysis Management and Enterprise
Samsung and Apple
7 / 2 4 / 2 0 1 8
Samsung and Apple
7 / 2 4 / 2 0 1 8
Paraphrase This Document
Need a fresh take? Get an instant paraphrase of this document with our AI Paraphraser
FINANCIAL ANALYSIS OF APPLE AND SAMSUNG 1
Table of Contents
Introduction................................................................................................................................2
Profile- Samsung....................................................................................................................2
Mission of Samsung...........................................................................................................3
Vision of Samsung.............................................................................................................3
Profile- Apple.........................................................................................................................3
Vision of Apple..................................................................................................................4
Mission of Apple................................................................................................................4
Question 1..............................................................................................................................4
Financial Analysis and Comparison of Apple and Samsung.................................................4
Financial Analysis of Samsung..........................................................................................4
Financial Analysis of Apple...............................................................................................8
Comparative Chart...........................................................................................................13
Question 2............................................................................................................................14
Corporate Social Responsibility of Samsung.......................................................................14
Health and Safety of Employee at Samsung....................................................................14
Minorities and Gender Equality at Samsung...................................................................15
Recycling and Waste Reduction by Samsung..................................................................15
Carbon Emissions.............................................................................................................16
Consumption of Water by Samsung................................................................................16
Samsung and Sustainable Sourcing.................................................................................17
Corporate Social Responsibility of Apple............................................................................17
Minorities and Gender Equality in Apple........................................................................17
Apple’s Energy Consumption..........................................................................................17
Consumption of water by Apple......................................................................................18
Conclusion................................................................................................................................19
References................................................................................................................................20
FINANCIAL ANALYSIS OF APPLE AND SAMSUNG 2
Introduction
The study of the financial statements is essential for the investors and stakeholders of the
company such as lender and government. The investors continuously observe the
performance of the company to recognize its capabilities and future opportunities by
assessing the financial statements (Fridson and Alvarez, 2011). Financial analysis is the
process of evaluating budgets, projects, and businesses to determine their performance.
Generally, financial analysis is used to study whether a firm is steady, lucrative, or wealthy to
do financial investment (Gibson, 2010). This report highlights the evaluation of the financial
performance of two competitors of electronic industry i.e. Samsung and Apple; this will be
done with the help of ratio analysis, horizontal and vertical analysis of both the companies. It
will also highlight the programs and initiatives of Corporate Social Responsibilities of
Samsung and Apple Company.
Profile- Samsung
Samsung is the South Korean Company and operating as the biggest producer of electronic
devices in the whole world. It specializes in creating a broad range of industrial and consumer
electronics, comprising digital media devices, memory chips, integrated systems, appliances,
and semiconductors. Today, Samsung has become the most famous brand in offering advance
technology (Samsung, 2018). Lee Byung-Chull started the company as the trading store in
1938. He commenced his business operations in Taegu, Korea, trading noodles and other
merchandises created in and nearby cities and distributing them to China. After the war in
Korea, Lee expanded his business operations into textiles and initiated the biggest mill of
wool. He majorly focused on industrialization with the objective of supporting his nation in
redeveloping after the war. During this period, the business was profited from the new
protective strategies adopted by the government of Korea, whose purpose was to assist big
⊘ This is a preview!⊘
Do you want full access?
Subscribe today to unlock all pages.
Trusted by 1+ million students worldwide
FINANCIAL ANALYSIS OF APPLE AND SAMSUNG 3
local conglomerates by protecting them from rivalry and offering them easy funding
(Samsung, 2018).
Mission of Samsung
The mission of Samsung is to apply their technology and talent to making superior services
and products that add to the enhanced global society (Jurevicius, 2013).
Vision of Samsung
“Inspire the World, Create the Future”- The Samsung’s vision 2020 is very important for
their commitment towards making an enhanced world, which is full of wealthier digital
experiences, by innovative products and technology. The objective of the vision is to be an
adored brand, an admired company, and an innovative company (Samsung, 2018).
Profile- Apple
Apple is an American company, which majorly deals in the manufacturing of personal
computers, computer software, and computer peripherals. The headquarter of the company is
located in California. Apple Inc. has its origin in the enduring dream of Stephen G. Wozniak
to create his own computer (Apple, 2018). It was a dream that suddenly became possible in
1975, with the entrance of the first successful microcomputer, i.e. the Altair 8800, which
arrived as a set and used the newly designed microprocessor chip. In 1976, Wozniak was the
engineering intern in the Hewlett-Packard Company, showed the least interest in his creation,
Wozniak then along with this classmate Steven P. Jobs, shifted his operations of production
to the family garage Jobs and the start-up of Silicon Valley garage was born and the
company was named as Apple (Aljafari, 2016).
Paraphrase This Document
Need a fresh take? Get an instant paraphrase of this document with our AI Paraphraser
FINANCIAL ANALYSIS OF APPLE AND SAMSUNG 4
Vision of Apple
The vision reflects that the firm understands that they are the face of the earth to create
valuable products and services. They are regularly concentrating on innovations. They
believe in offering simple solutions rather than complex (Center Forics, 2016).
Mission of Apple
Apple Company creates Macs that is considered the best personal computers all around the
globe, along with iWork, OS X, professional software, and iLife. Cited firm is the leader in
the digital music revolution by the virtue of its products like iPods, iTunes etc. This firm has
again invented the cell phone devices with its innovative iPhone and App store and is
describing the future of computer devices and mobile phone (Rowland, 2017).
Question 1
Financial Analysis and Comparison of Apple and Samsung
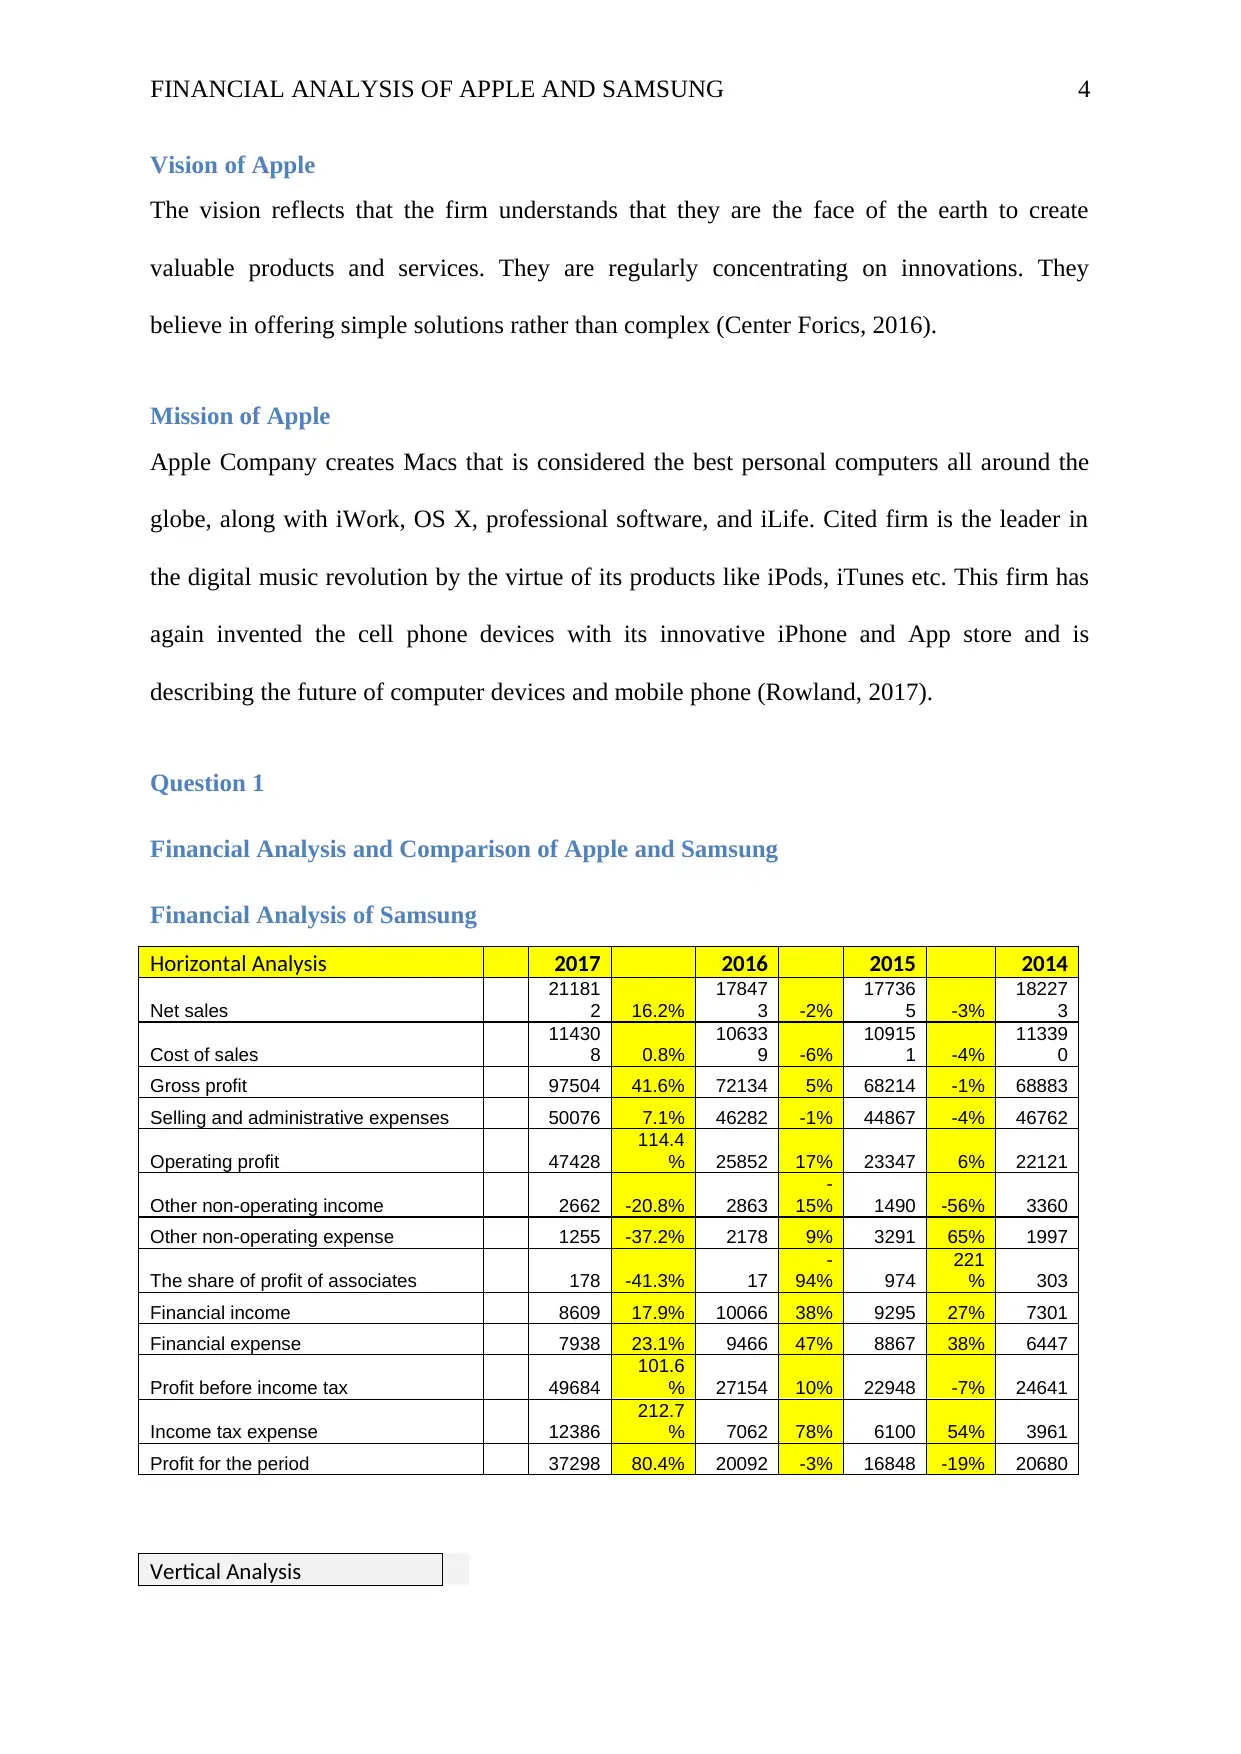
Financial Analysis of Samsung
Horizontal Analysis 2017 2016 2015 2014
Net sales
21181
2 16.2%
17847
3 -2%
17736
5 -3%
18227
3
Cost of sales
11430
8 0.8%
10633
9 -6%
10915
1 -4%
11339
0
Gross profit 97504 41.6% 72134 5% 68214 -1% 68883
Selling and administrative expenses 50076 7.1% 46282 -1% 44867 -4% 46762
Operating profit 47428
114.4
% 25852 17% 23347 6% 22121
Other non-operating income 2662 -20.8% 2863
-
15% 1490 -56% 3360
Other non-operating expense 1255 -37.2% 2178 9% 3291 65% 1997
The share of profit of associates 178 -41.3% 17
-
94% 974
221
% 303
Financial income 8609 17.9% 10066 38% 9295 27% 7301
Financial expense 7938 23.1% 9466 47% 8867 38% 6447
Profit before income tax 49684
101.6
% 27154 10% 22948 -7% 24641
Income tax expense 12386
212.7
% 7062 78% 6100 54% 3961
Profit for the period 37298 80.4% 20092 -3% 16848 -19% 20680
Vertical Analysis
Vision of Apple
The vision reflects that the firm understands that they are the face of the earth to create
valuable products and services. They are regularly concentrating on innovations. They
believe in offering simple solutions rather than complex (Center Forics, 2016).
Mission of Apple
Apple Company creates Macs that is considered the best personal computers all around the
globe, along with iWork, OS X, professional software, and iLife. Cited firm is the leader in
the digital music revolution by the virtue of its products like iPods, iTunes etc. This firm has
again invented the cell phone devices with its innovative iPhone and App store and is
describing the future of computer devices and mobile phone (Rowland, 2017).
Question 1
Financial Analysis and Comparison of Apple and Samsung
Financial Analysis of Samsung
Horizontal Analysis 2017 2016 2015 2014
Net sales
21181
2 16.2%
17847
3 -2%
17736
5 -3%
18227
3
Cost of sales
11430
8 0.8%
10633
9 -6%
10915
1 -4%
11339
0
Gross profit 97504 41.6% 72134 5% 68214 -1% 68883
Selling and administrative expenses 50076 7.1% 46282 -1% 44867 -4% 46762
Operating profit 47428
114.4
% 25852 17% 23347 6% 22121
Other non-operating income 2662 -20.8% 2863
-
15% 1490 -56% 3360
Other non-operating expense 1255 -37.2% 2178 9% 3291 65% 1997
The share of profit of associates 178 -41.3% 17
-
94% 974
221
% 303
Financial income 8609 17.9% 10066 38% 9295 27% 7301
Financial expense 7938 23.1% 9466 47% 8867 38% 6447
Profit before income tax 49684
101.6
% 27154 10% 22948 -7% 24641
Income tax expense 12386
212.7
% 7062 78% 6100 54% 3961
Profit for the period 37298 80.4% 20092 -3% 16848 -19% 20680
Vertical Analysis
FINANCIAL ANALYSIS OF APPLE AND SAMSUNG 5
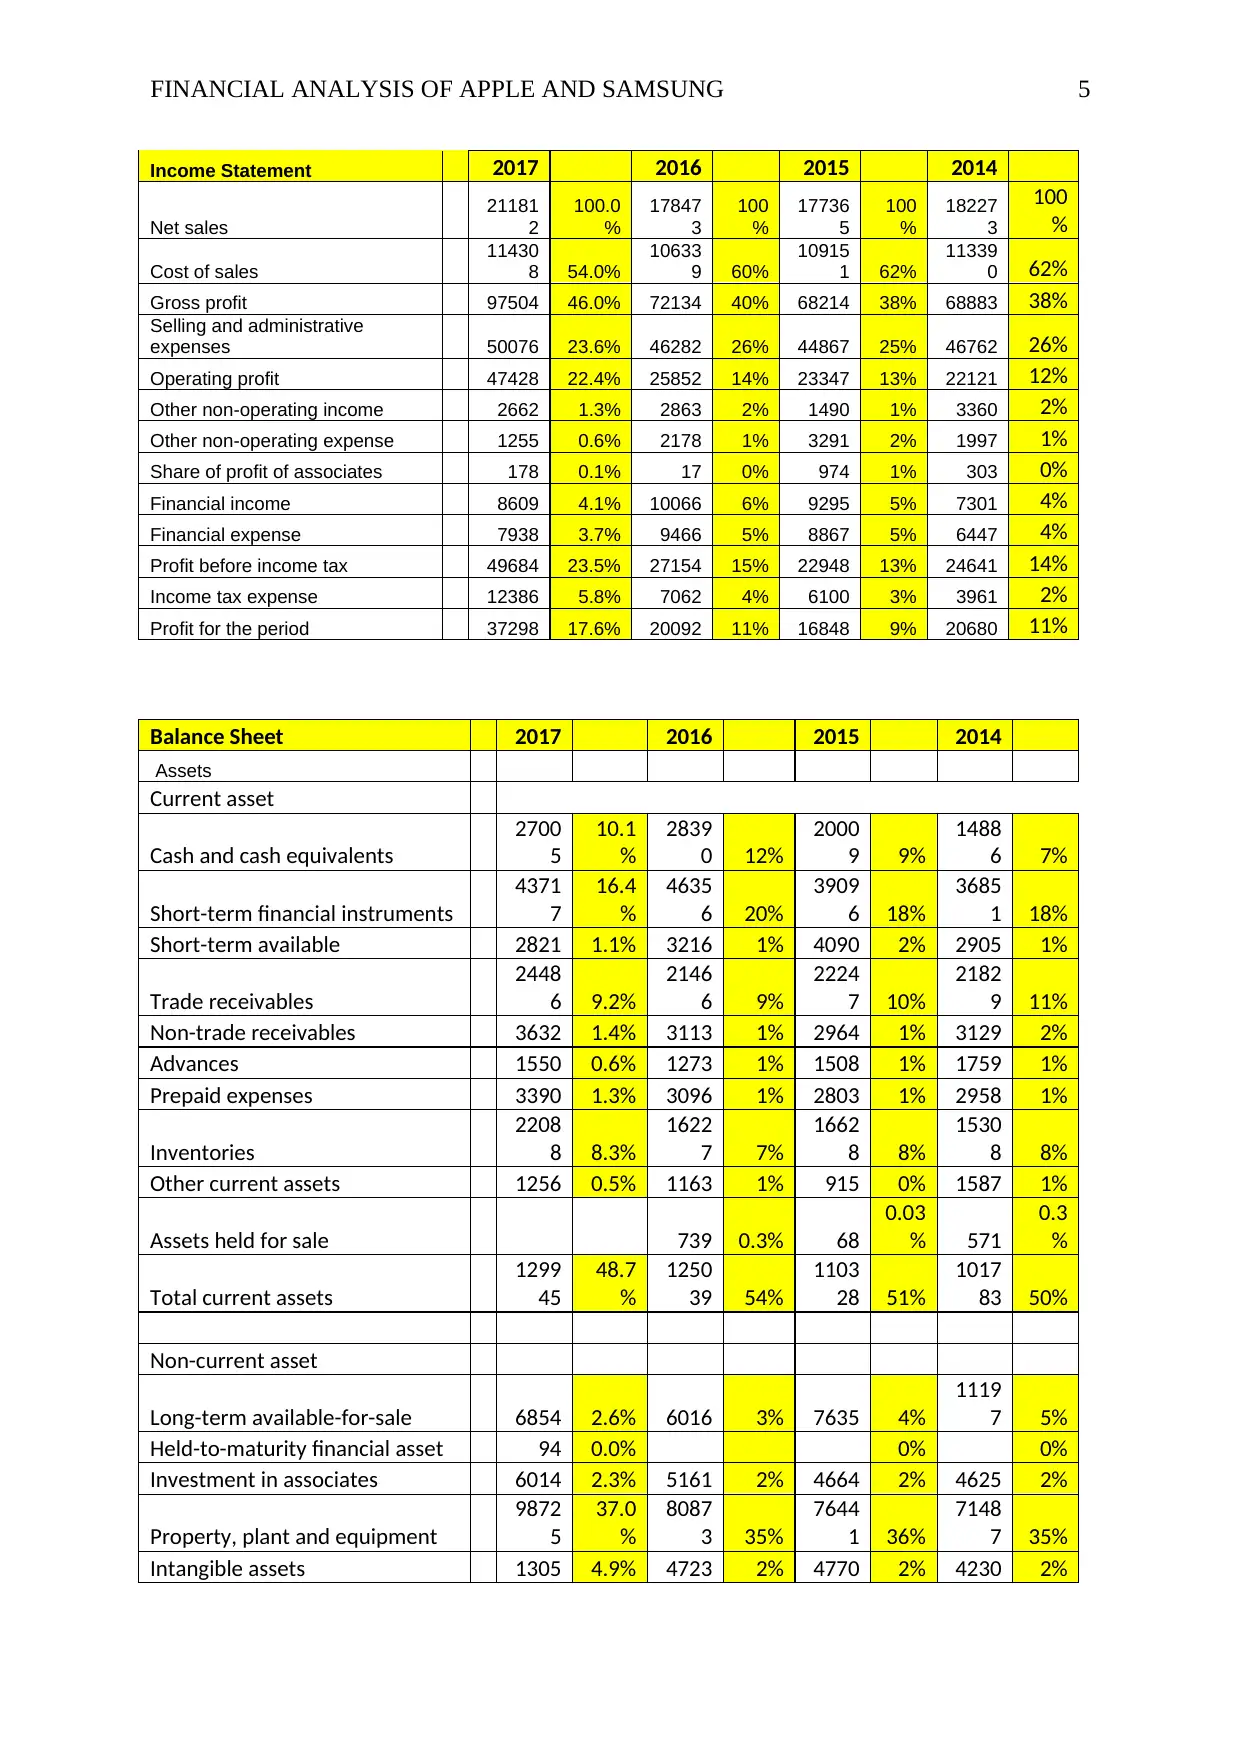
Income Statement 2017 2016 2015 2014
Net sales
21181
2
100.0
%
17847
3
100
%
17736
5
100
%
18227
3
100
%
Cost of sales
11430
8 54.0%
10633
9 60%
10915
1 62%
11339
0 62%
Gross profit 97504 46.0% 72134 40% 68214 38% 68883 38%
Selling and administrative
expenses 50076 23.6% 46282 26% 44867 25% 46762 26%
Operating profit 47428 22.4% 25852 14% 23347 13% 22121 12%
Other non-operating income 2662 1.3% 2863 2% 1490 1% 3360 2%
Other non-operating expense 1255 0.6% 2178 1% 3291 2% 1997 1%
Share of profit of associates 178 0.1% 17 0% 974 1% 303 0%
Financial income 8609 4.1% 10066 6% 9295 5% 7301 4%
Financial expense 7938 3.7% 9466 5% 8867 5% 6447 4%
Profit before income tax 49684 23.5% 27154 15% 22948 13% 24641 14%
Income tax expense 12386 5.8% 7062 4% 6100 3% 3961 2%
Profit for the period 37298 17.6% 20092 11% 16848 9% 20680 11%
Balance Sheet 2017 2016 2015 2014
Assets
Current asset
Cash and cash equivalents
2700
5
10.1
%
2839
0 12%
2000
9 9%
1488
6 7%
Short-term financial instruments
4371
7
16.4
%
4635
6 20%
3909
6 18%
3685
1 18%
Short-term available 2821 1.1% 3216 1% 4090 2% 2905 1%
Trade receivables
2448
6 9.2%
2146
6 9%
2224
7 10%
2182
9 11%
Non-trade receivables 3632 1.4% 3113 1% 2964 1% 3129 2%
Advances 1550 0.6% 1273 1% 1508 1% 1759 1%
Prepaid expenses 3390 1.3% 3096 1% 2803 1% 2958 1%
Inventories
2208
8 8.3%
1622
7 7%
1662
8 8%
1530
8 8%
Other current assets 1256 0.5% 1163 1% 915 0% 1587 1%
Assets held for sale 739 0.3% 68
0.03
% 571
0.3
%
Total current assets
1299
45
48.7
%
1250
39 54%
1103
28 51%
1017
83 50%
Non-current asset
Long-term available-for-sale 6854 2.6% 6016 3% 7635 4%
1119
7 5%
Held-to-maturity financial asset 94 0.0% 0% 0%
Investment in associates 6014 2.3% 5161 2% 4664 2% 4625 2%
Property, plant and equipment
9872
5
37.0
%
8087
3 35%
7644
1 36%
7148
7 35%
Intangible assets 1305 4.9% 4723 2% 4770 2% 4230 2%
⊘ This is a preview!⊘
Do you want full access?
Subscribe today to unlock all pages.
Trusted by 1+ million students worldwide
FINANCIAL ANALYSIS OF APPLE AND SAMSUNG 6
0
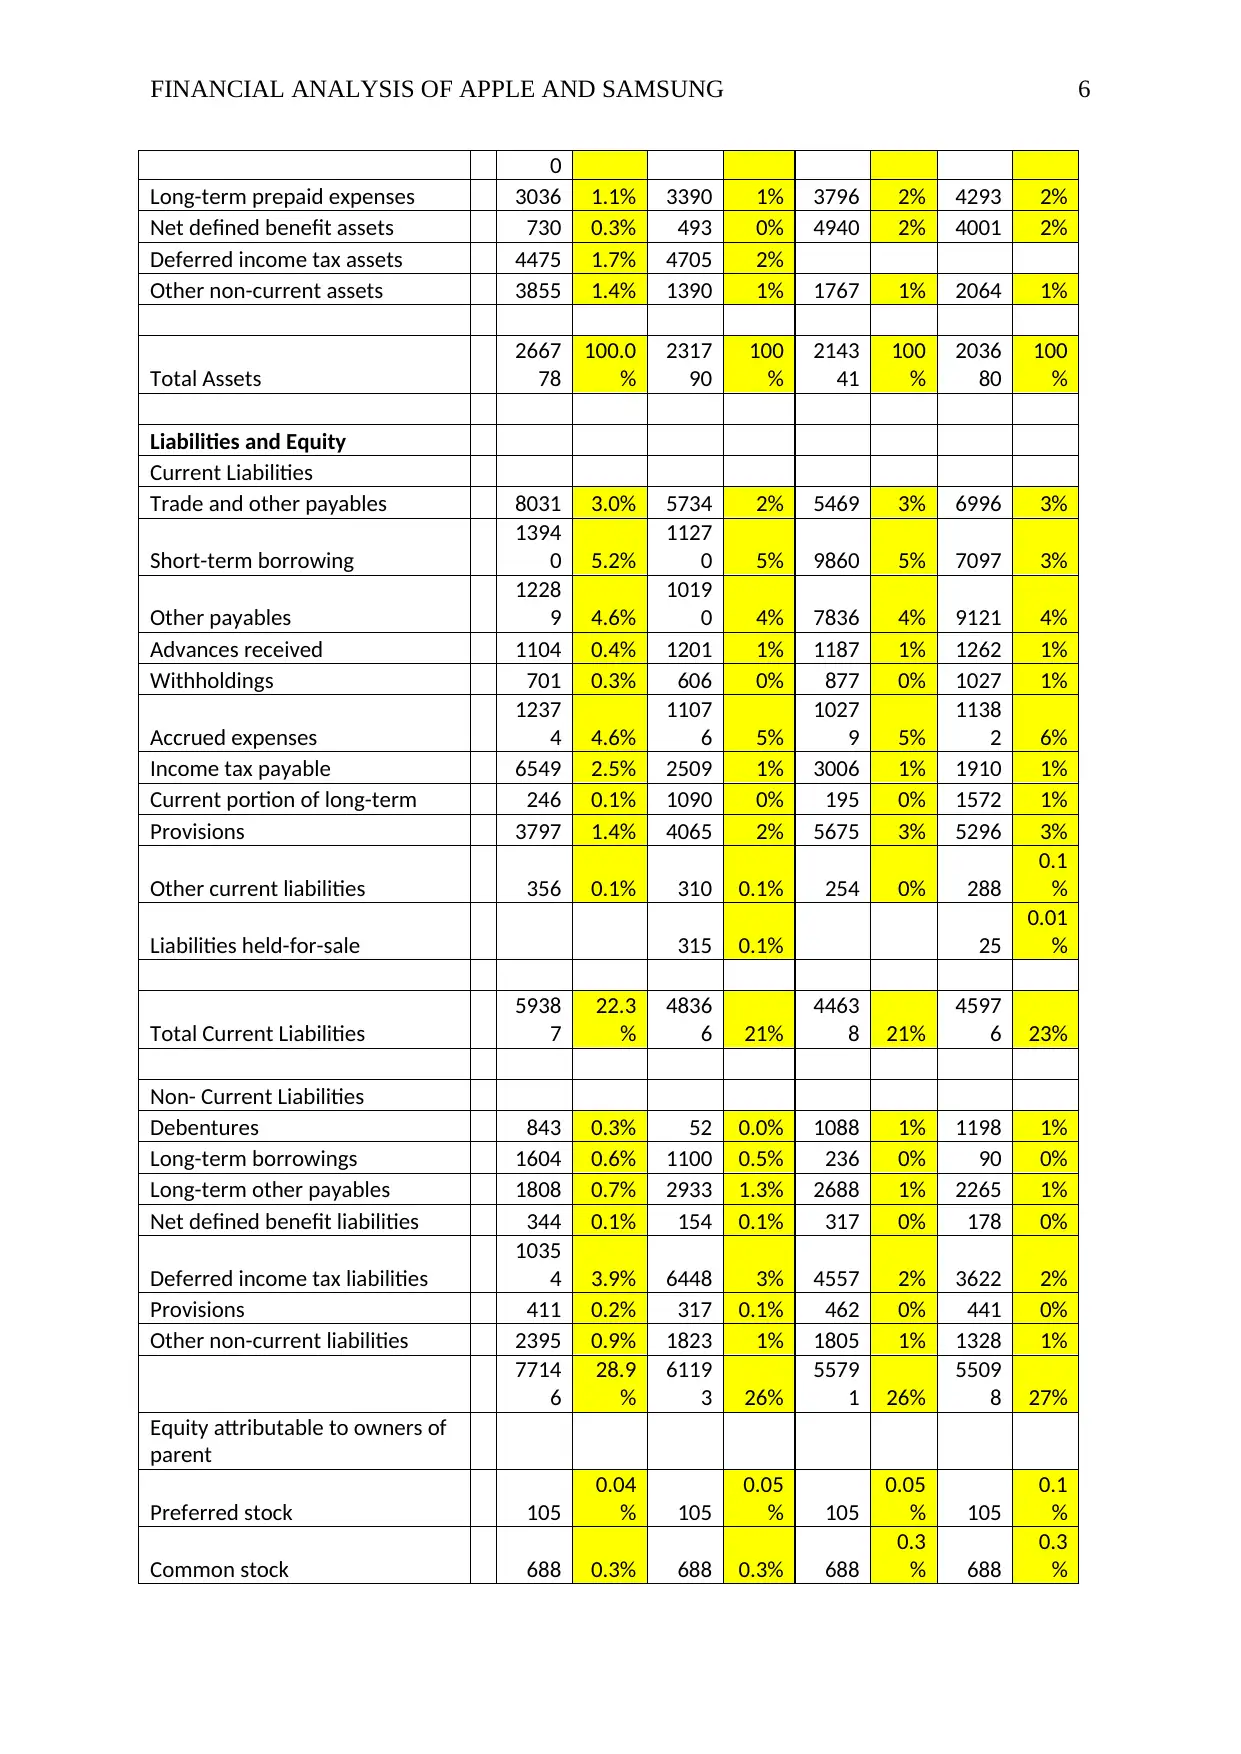
Long-term prepaid expenses 3036 1.1% 3390 1% 3796 2% 4293 2%
Net defined benefit assets 730 0.3% 493 0% 4940 2% 4001 2%
Deferred income tax assets 4475 1.7% 4705 2%
Other non-current assets 3855 1.4% 1390 1% 1767 1% 2064 1%
Total Assets
2667
78
100.0
%
2317
90
100
%
2143
41
100
%
2036
80
100
%
Liabilities and Equity
Current Liabilities
Trade and other payables 8031 3.0% 5734 2% 5469 3% 6996 3%
Short-term borrowing
1394
0 5.2%
1127
0 5% 9860 5% 7097 3%
Other payables
1228
9 4.6%
1019
0 4% 7836 4% 9121 4%
Advances received 1104 0.4% 1201 1% 1187 1% 1262 1%
Withholdings 701 0.3% 606 0% 877 0% 1027 1%
Accrued expenses
1237
4 4.6%
1107
6 5%
1027
9 5%
1138
2 6%
Income tax payable 6549 2.5% 2509 1% 3006 1% 1910 1%
Current portion of long-term 246 0.1% 1090 0% 195 0% 1572 1%
Provisions 3797 1.4% 4065 2% 5675 3% 5296 3%
Other current liabilities 356 0.1% 310 0.1% 254 0% 288
0.1
%
Liabilities held-for-sale 315 0.1% 25
0.01
%
Total Current Liabilities
5938
7
22.3
%
4836
6 21%
4463
8 21%
4597
6 23%
Non- Current Liabilities
Debentures 843 0.3% 52 0.0% 1088 1% 1198 1%
Long-term borrowings 1604 0.6% 1100 0.5% 236 0% 90 0%
Long-term other payables 1808 0.7% 2933 1.3% 2688 1% 2265 1%
Net defined benefit liabilities 344 0.1% 154 0.1% 317 0% 178 0%
Deferred income tax liabilities
1035
4 3.9% 6448 3% 4557 2% 3622 2%
Provisions 411 0.2% 317 0.1% 462 0% 441 0%
Other non-current liabilities 2395 0.9% 1823 1% 1805 1% 1328 1%
7714
6
28.9
%
6119
3 26%
5579
1 26%
5509
8 27%
Equity attributable to owners of
parent
Preferred stock 105
0.04
% 105
0.05
% 105
0.05
% 105
0.1
%
Common stock 688 0.3% 688 0.3% 688
0.3
% 688
0.3
%
0
Long-term prepaid expenses 3036 1.1% 3390 1% 3796 2% 4293 2%
Net defined benefit assets 730 0.3% 493 0% 4940 2% 4001 2%
Deferred income tax assets 4475 1.7% 4705 2%
Other non-current assets 3855 1.4% 1390 1% 1767 1% 2064 1%
Total Assets
2667
78
100.0
%
2317
90
100
%
2143
41
100
%
2036
80
100
%
Liabilities and Equity
Current Liabilities
Trade and other payables 8031 3.0% 5734 2% 5469 3% 6996 3%
Short-term borrowing
1394
0 5.2%
1127
0 5% 9860 5% 7097 3%
Other payables
1228
9 4.6%
1019
0 4% 7836 4% 9121 4%
Advances received 1104 0.4% 1201 1% 1187 1% 1262 1%
Withholdings 701 0.3% 606 0% 877 0% 1027 1%
Accrued expenses
1237
4 4.6%
1107
6 5%
1027
9 5%
1138
2 6%
Income tax payable 6549 2.5% 2509 1% 3006 1% 1910 1%
Current portion of long-term 246 0.1% 1090 0% 195 0% 1572 1%
Provisions 3797 1.4% 4065 2% 5675 3% 5296 3%
Other current liabilities 356 0.1% 310 0.1% 254 0% 288
0.1
%
Liabilities held-for-sale 315 0.1% 25
0.01
%
Total Current Liabilities
5938
7
22.3
%
4836
6 21%
4463
8 21%
4597
6 23%
Non- Current Liabilities
Debentures 843 0.3% 52 0.0% 1088 1% 1198 1%
Long-term borrowings 1604 0.6% 1100 0.5% 236 0% 90 0%
Long-term other payables 1808 0.7% 2933 1.3% 2688 1% 2265 1%
Net defined benefit liabilities 344 0.1% 154 0.1% 317 0% 178 0%
Deferred income tax liabilities
1035
4 3.9% 6448 3% 4557 2% 3622 2%
Provisions 411 0.2% 317 0.1% 462 0% 441 0%
Other non-current liabilities 2395 0.9% 1823 1% 1805 1% 1328 1%
7714
6
28.9
%
6119
3 26%
5579
1 26%
5509
8 27%
Equity attributable to owners of
parent
Preferred stock 105
0.04
% 105
0.05
% 105
0.05
% 105
0.1
%
Common stock 688 0.3% 688 0.3% 688
0.3
% 688
0.3
%
Paraphrase This Document
Need a fresh take? Get an instant paraphrase of this document with our AI Paraphraser
FINANCIAL ANALYSIS OF APPLE AND SAMSUNG 7
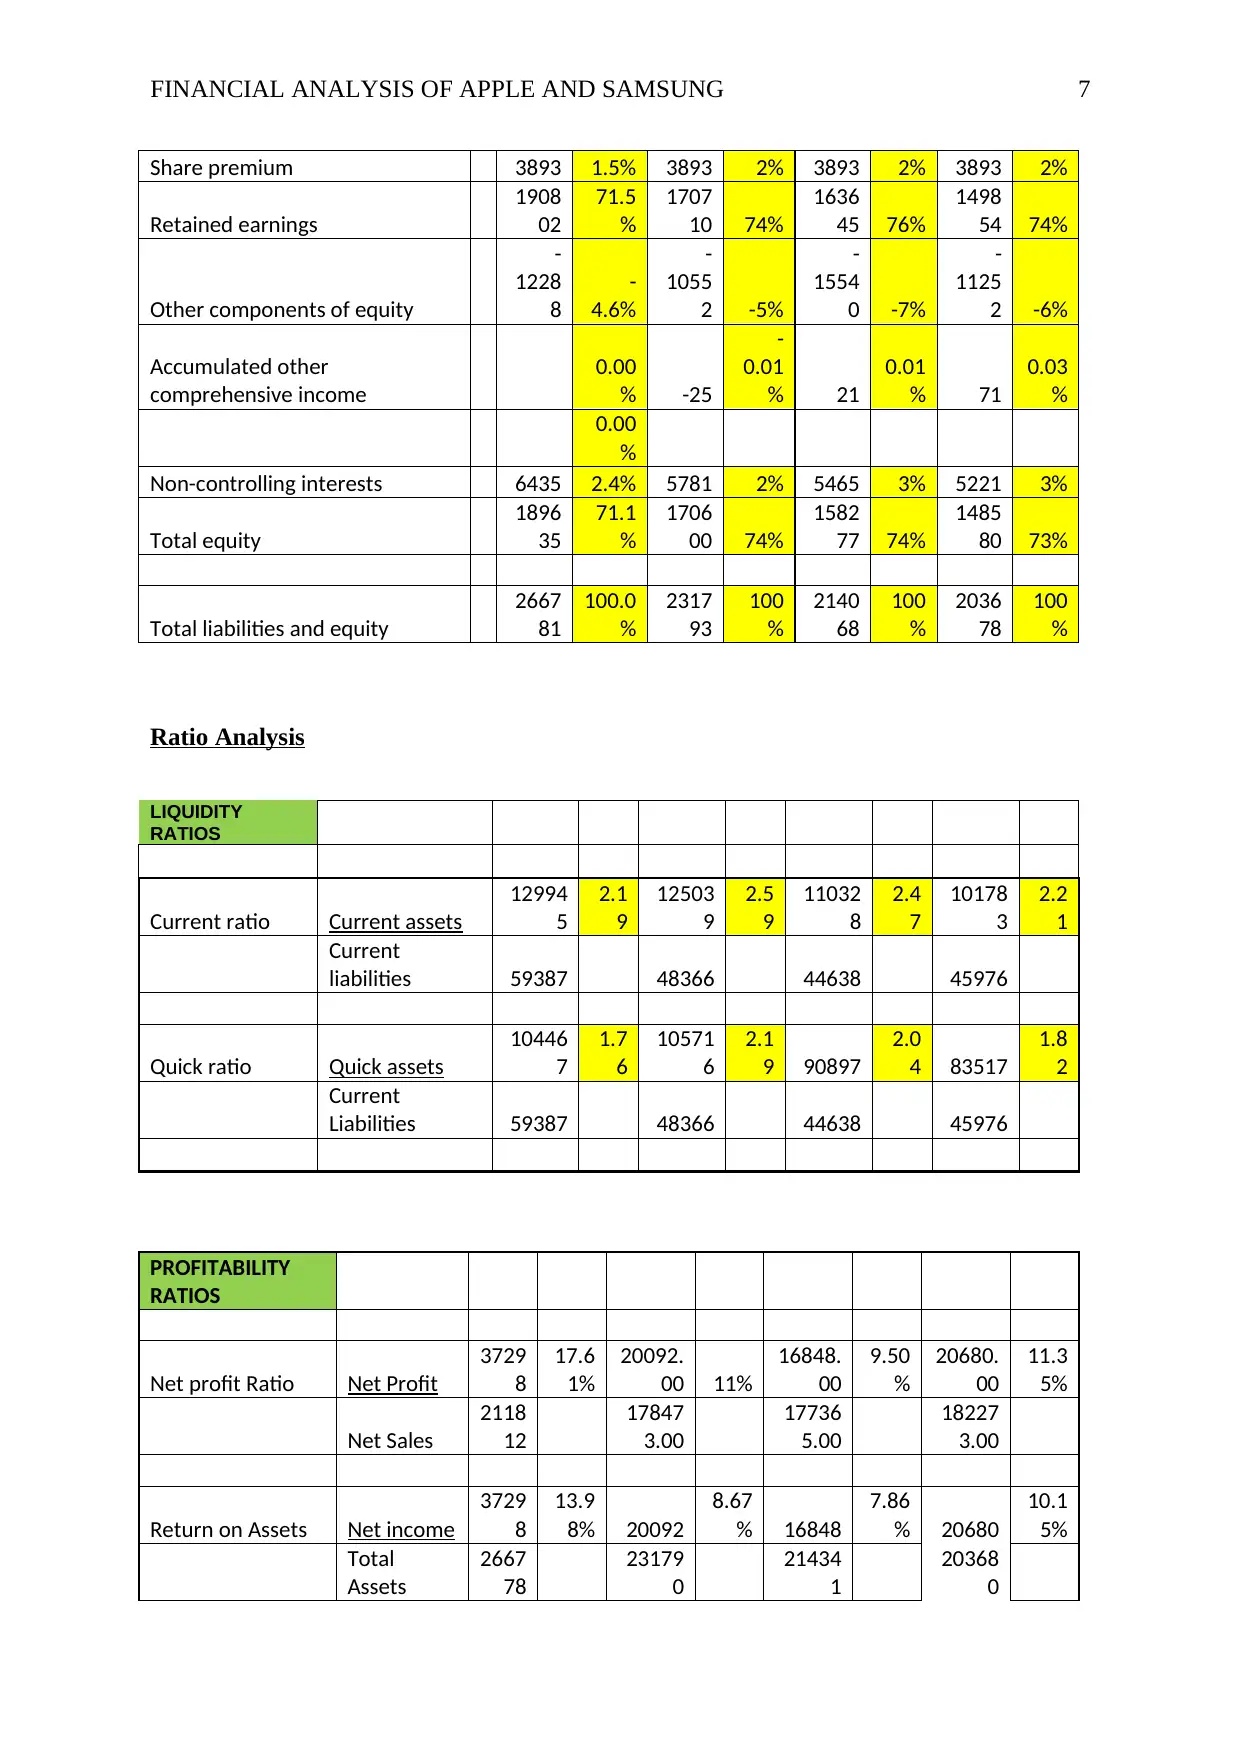
Share premium 3893 1.5% 3893 2% 3893 2% 3893 2%
Retained earnings
1908
02
71.5
%
1707
10 74%
1636
45 76%
1498
54 74%
Other components of equity
-
1228
8
-
4.6%
-
1055
2 -5%
-
1554
0 -7%
-
1125
2 -6%
Accumulated other
comprehensive income
0.00
% -25
-
0.01
% 21
0.01
% 71
0.03
%
0.00
%
Non-controlling interests 6435 2.4% 5781 2% 5465 3% 5221 3%
Total equity
1896
35
71.1
%
1706
00 74%
1582
77 74%
1485
80 73%
Total liabilities and equity
2667
81
100.0
%
2317
93
100
%
2140
68
100
%
2036
78
100
%
Ratio Analysis
LIQUIDITY
RATIOS
Current ratio Current assets
12994
5
2.1
9
12503
9
2.5
9
11032
8
2.4
7
10178
3
2.2
1
Current
liabilities 59387 48366 44638 45976
Quick ratio Quick assets
10446
7
1.7
6
10571
6
2.1
9 90897
2.0
4 83517
1.8
2
Current
Liabilities 59387 48366 44638 45976
PROFITABILITY
RATIOS
Net profit Ratio Net Profit
3729
8
17.6
1%
20092.
00 11%
16848.
00
9.50
%
20680.
00
11.3
5%
Net Sales
2118
12
17847
3.00
17736
5.00
18227
3.00
Return on Assets Net income
3729
8
13.9
8% 20092
8.67
% 16848
7.86
% 20680
10.1
5%
Total
Assets
2667
78
23179
0
21434
1
20368
0
FINANCIAL ANALYSIS OF APPLE AND SAMSUNG 8
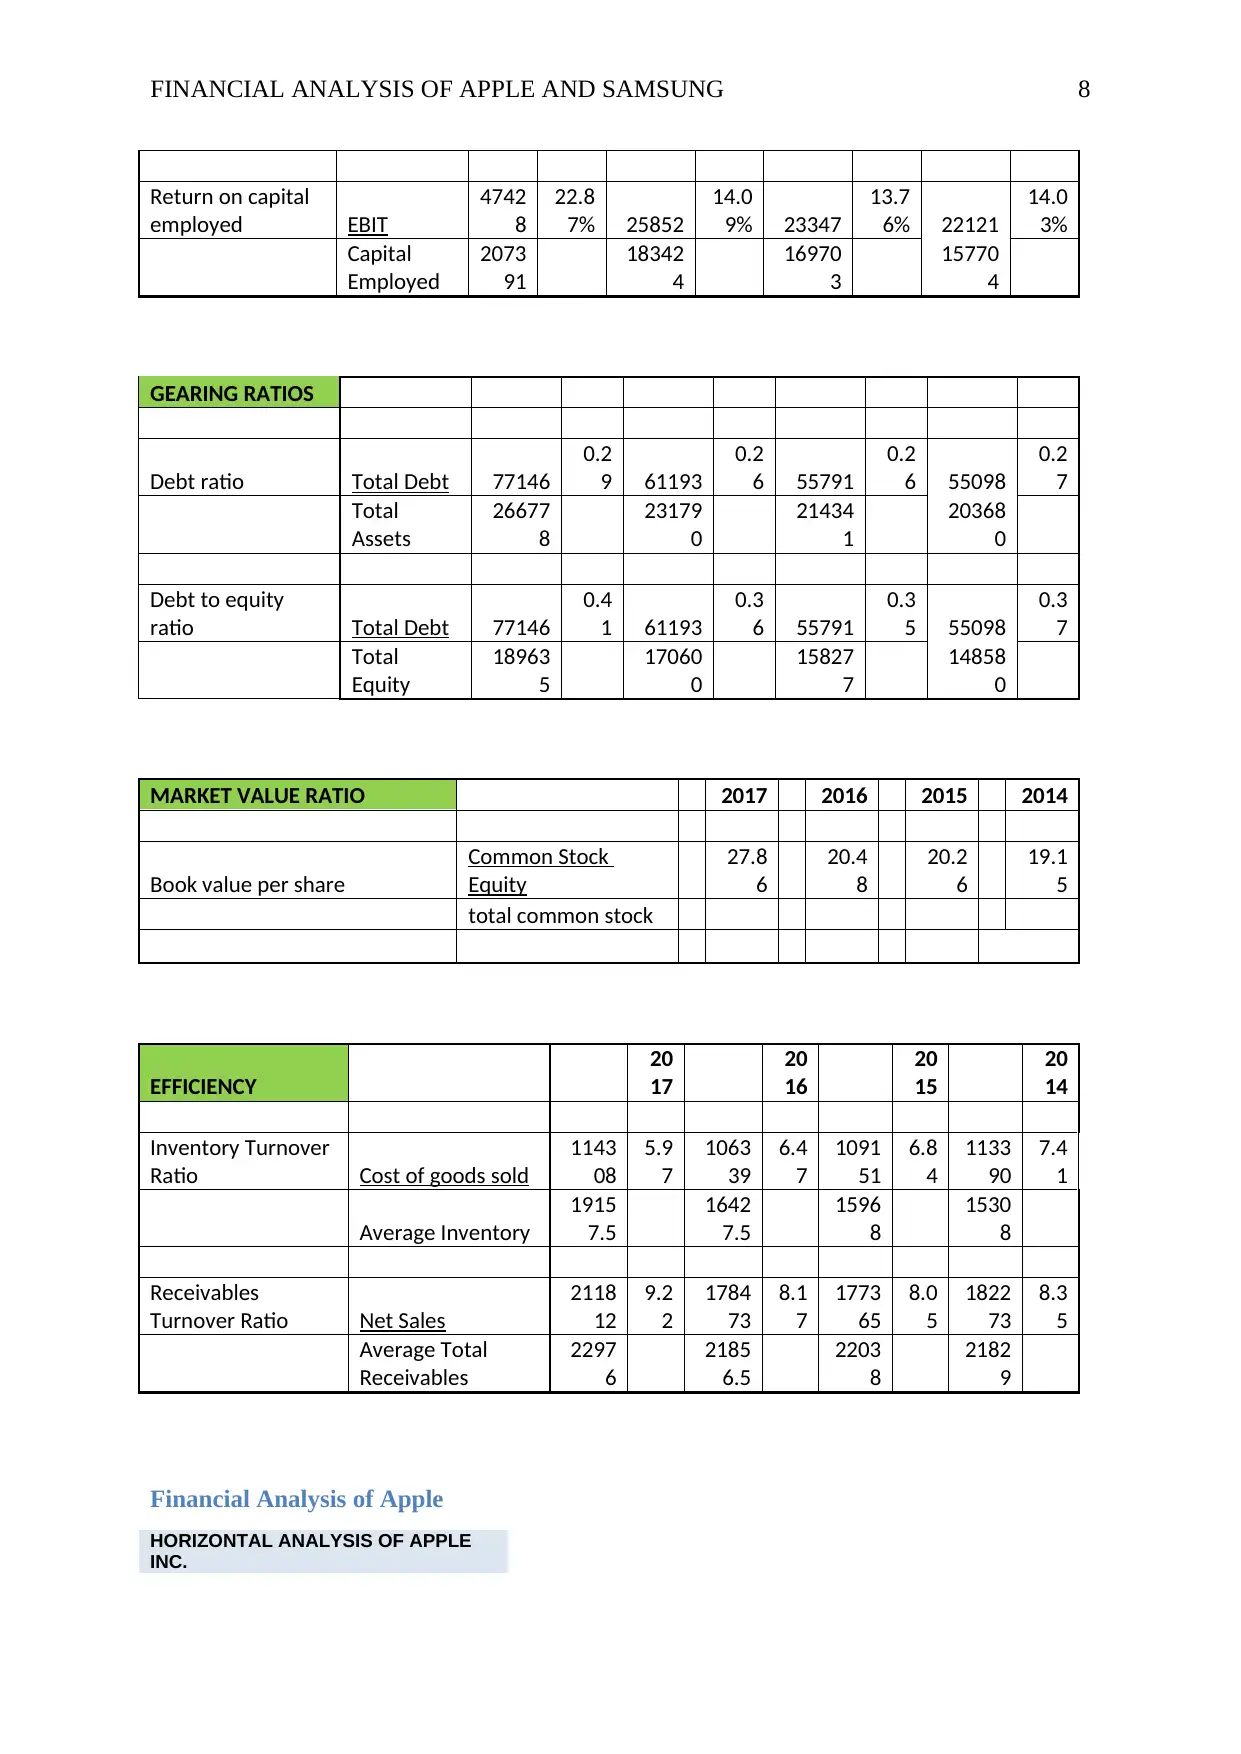
Return on capital
employed EBIT
4742
8
22.8
7% 25852
14.0
9% 23347
13.7
6% 22121
14.0
3%
Capital
Employed
2073
91
18342
4
16970
3
15770
4
GEARING RATIOS
Debt ratio Total Debt 77146
0.2
9 61193
0.2
6 55791
0.2
6 55098
0.2
7
Total
Assets
26677
8
23179
0
21434
1
20368
0
Debt to equity
ratio Total Debt 77146
0.4
1 61193
0.3
6 55791
0.3
5 55098
0.3
7
Total
Equity
18963
5
17060
0
15827
7
14858
0
MARKET VALUE RATIO 2017 2016 2015 2014
Book value per share
Common Stock
Equity
27.8
6
20.4
8
20.2
6
19.1
5
total common stock
EFFICIENCY
20
17
20
16
20
15
20
14
Inventory Turnover
Ratio Cost of goods sold
1143
08
5.9
7
1063
39
6.4
7
1091
51
6.8
4
1133
90
7.4
1
Average Inventory
1915
7.5
1642
7.5
1596
8
1530
8
Receivables
Turnover Ratio Net Sales
2118
12
9.2
2
1784
73
8.1
7
1773
65
8.0
5
1822
73
8.3
5
Average Total
Receivables
2297
6
2185
6.5
2203
8
2182
9
Financial Analysis of Apple
HORIZONTAL ANALYSIS OF APPLE
INC.
⊘ This is a preview!⊘
Do you want full access?
Subscribe today to unlock all pages.
Trusted by 1+ million students worldwide
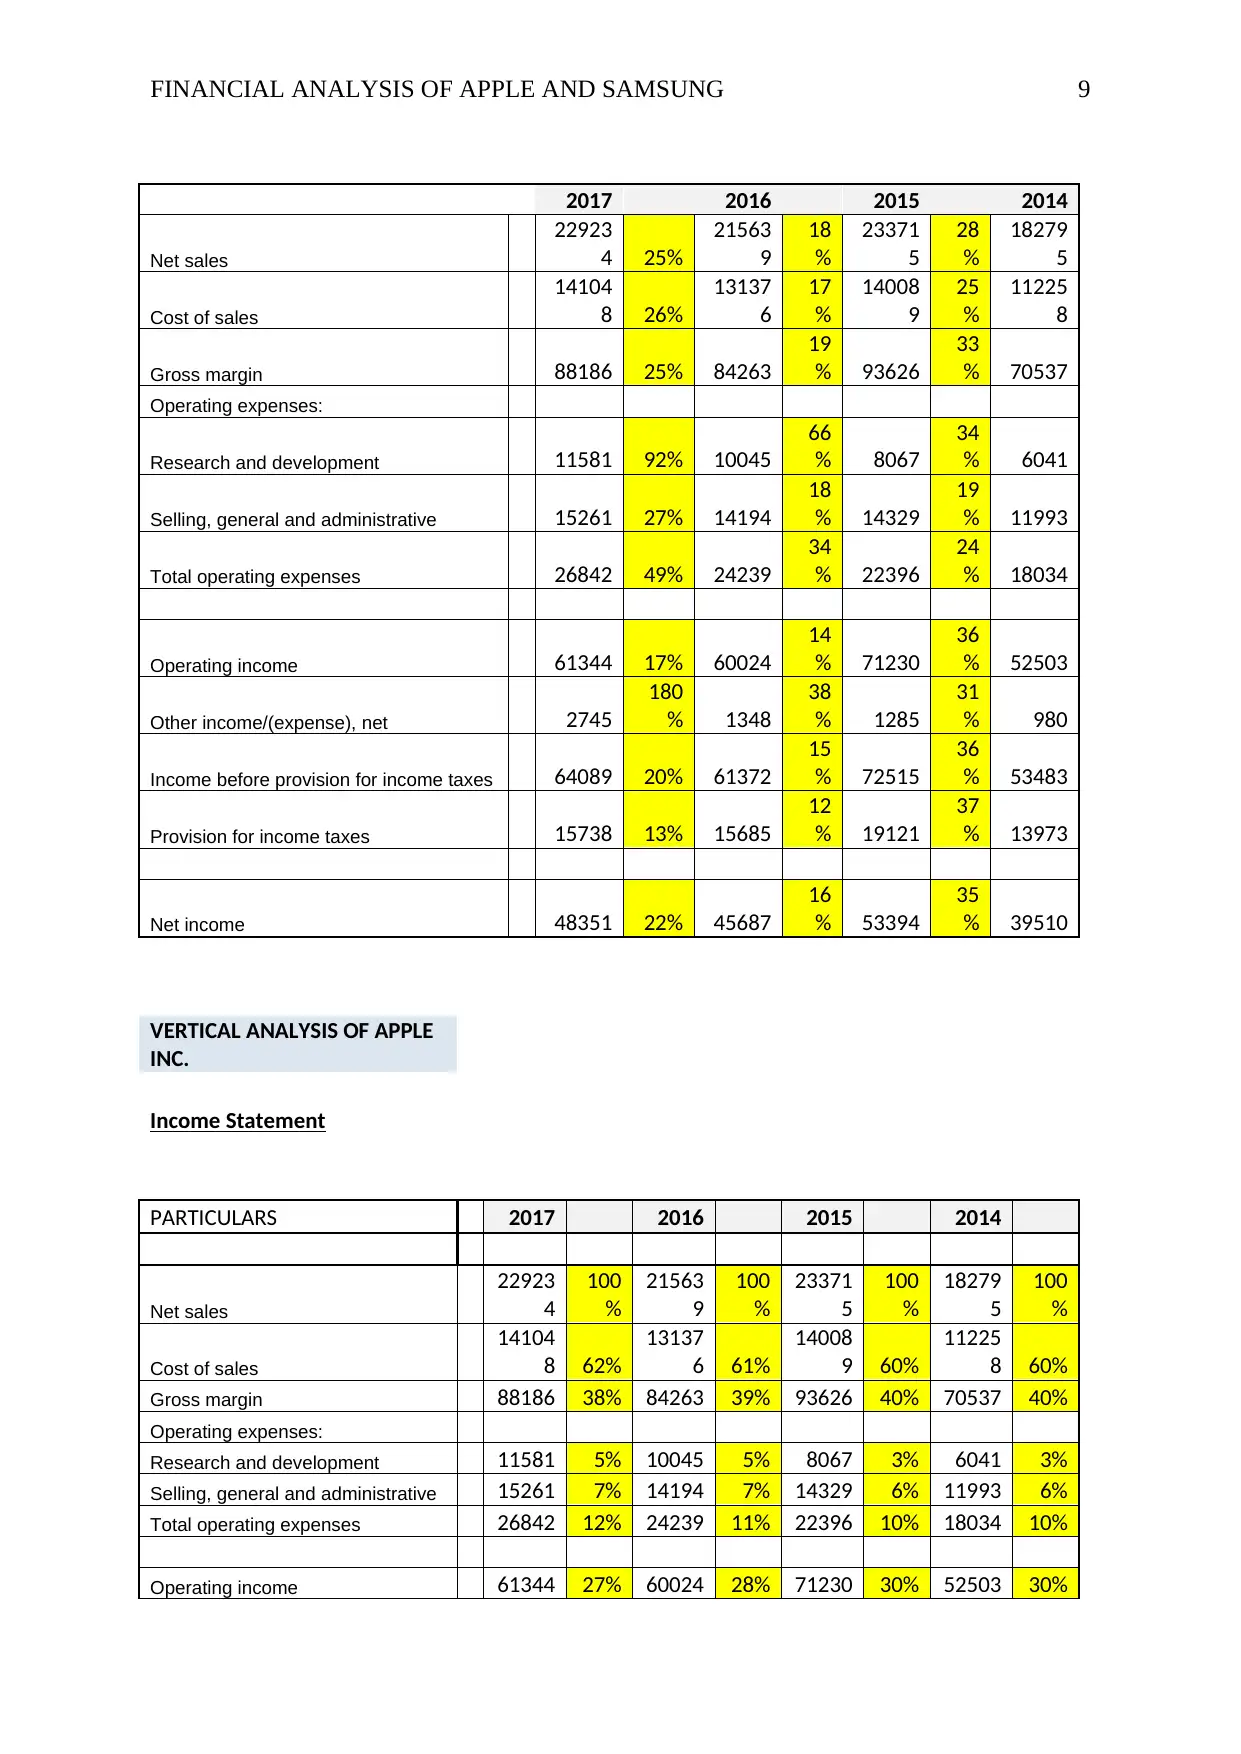
FINANCIAL ANALYSIS OF APPLE AND SAMSUNG 9
2017 2016 2015 2014
Net sales
22923
4 25%
21563
9
18
%
23371
5
28
%
18279
5
Cost of sales
14104
8 26%
13137
6
17
%
14008
9
25
%
11225
8
Gross margin 88186 25% 84263
19
% 93626
33
% 70537
Operating expenses:
Research and development 11581 92% 10045
66
% 8067
34
% 6041
Selling, general and administrative 15261 27% 14194
18
% 14329
19
% 11993
Total operating expenses 26842 49% 24239
34
% 22396
24
% 18034
Operating income 61344 17% 60024
14
% 71230
36
% 52503
Other income/(expense), net 2745
180
% 1348
38
% 1285
31
% 980
Income before provision for income taxes 64089 20% 61372
15
% 72515
36
% 53483
Provision for income taxes 15738 13% 15685
12
% 19121
37
% 13973
Net income 48351 22% 45687
16
% 53394
35
% 39510
VERTICAL ANALYSIS OF APPLE
INC.
Income Statement
PARTICULARS 2017 2016 2015 2014
Net sales
22923
4
100
%
21563
9
100
%
23371
5
100
%
18279
5
100
%
Cost of sales
14104
8 62%
13137
6 61%
14008
9 60%
11225
8 60%
Gross margin 88186 38% 84263 39% 93626 40% 70537 40%
Operating expenses:
Research and development 11581 5% 10045 5% 8067 3% 6041 3%
Selling, general and administrative 15261 7% 14194 7% 14329 6% 11993 6%
Total operating expenses 26842 12% 24239 11% 22396 10% 18034 10%
Operating income 61344 27% 60024 28% 71230 30% 52503 30%
Paraphrase This Document
Need a fresh take? Get an instant paraphrase of this document with our AI Paraphraser
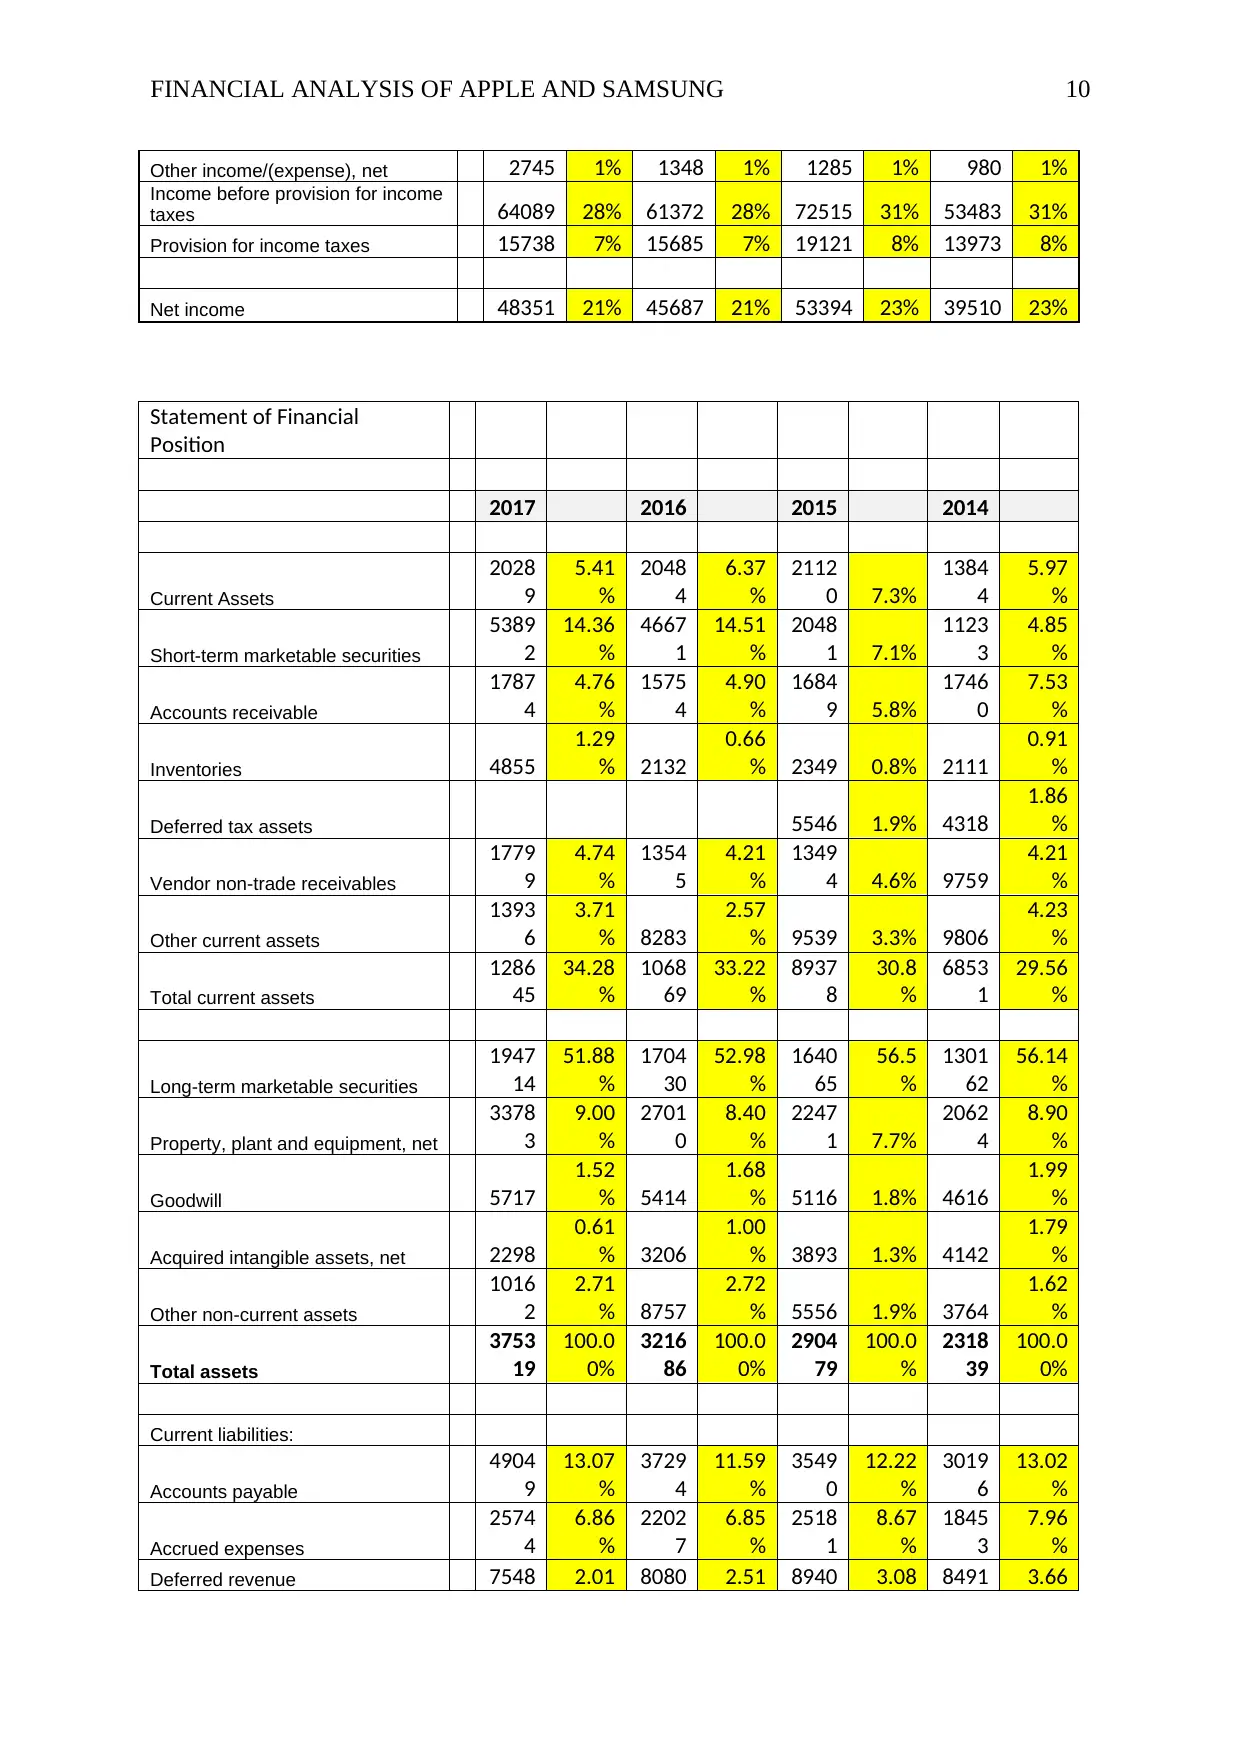
FINANCIAL ANALYSIS OF APPLE AND SAMSUNG 10
Other income/(expense), net 2745 1% 1348 1% 1285 1% 980 1%
Income before provision for income
taxes 64089 28% 61372 28% 72515 31% 53483 31%
Provision for income taxes 15738 7% 15685 7% 19121 8% 13973 8%
Net income 48351 21% 45687 21% 53394 23% 39510 23%
Statement of Financial
Position
2017 2016 2015 2014
Current Assets
2028
9
5.41
%
2048
4
6.37
%
2112
0 7.3%
1384
4
5.97
%
Short-term marketable securities
5389
2
14.36
%
4667
1
14.51
%
2048
1 7.1%
1123
3
4.85
%
Accounts receivable
1787
4
4.76
%
1575
4
4.90
%
1684
9 5.8%
1746
0
7.53
%
Inventories 4855
1.29
% 2132
0.66
% 2349 0.8% 2111
0.91
%
Deferred tax assets 5546 1.9% 4318
1.86
%
Vendor non-trade receivables
1779
9
4.74
%
1354
5
4.21
%
1349
4 4.6% 9759
4.21
%
Other current assets
1393
6
3.71
% 8283
2.57
% 9539 3.3% 9806
4.23
%
Total current assets
1286
45
34.28
%
1068
69
33.22
%
8937
8
30.8
%
6853
1
29.56
%
Long-term marketable securities
1947
14
51.88
%
1704
30
52.98
%
1640
65
56.5
%
1301
62
56.14
%
Property, plant and equipment, net
3378
3
9.00
%
2701
0
8.40
%
2247
1 7.7%
2062
4
8.90
%
Goodwill 5717
1.52
% 5414
1.68
% 5116 1.8% 4616
1.99
%
Acquired intangible assets, net 2298
0.61
% 3206
1.00
% 3893 1.3% 4142
1.79
%
Other non-current assets
1016
2
2.71
% 8757
2.72
% 5556 1.9% 3764
1.62
%
Total assets
3753
19
100.0
0%
3216
86
100.0
0%
2904
79
100.0
%
2318
39
100.0
0%
Current liabilities:
Accounts payable
4904
9
13.07
%
3729
4
11.59
%
3549
0
12.22
%
3019
6
13.02
%
Accrued expenses
2574
4
6.86
%
2202
7
6.85
%
2518
1
8.67
%
1845
3
7.96
%
Deferred revenue 7548 2.01 8080 2.51 8940 3.08 8491 3.66
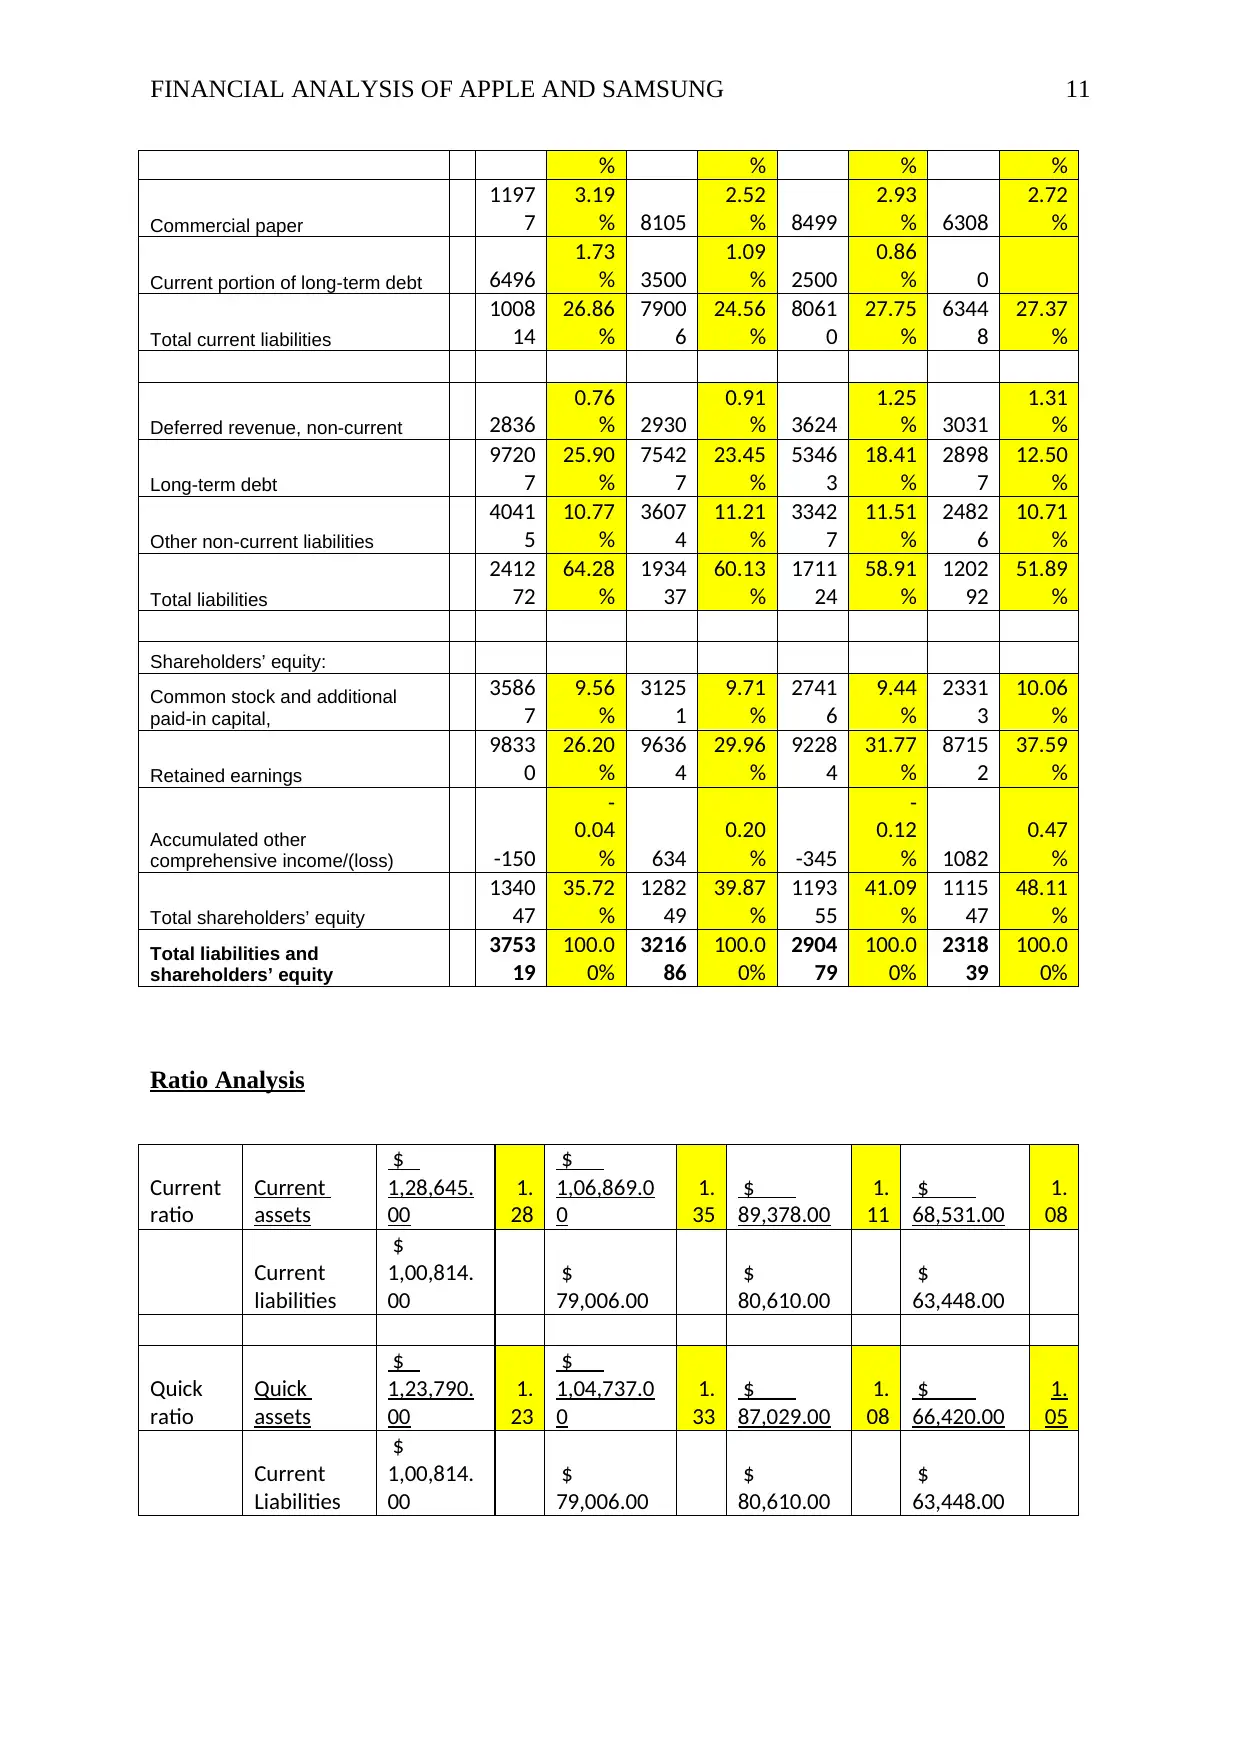
FINANCIAL ANALYSIS OF APPLE AND SAMSUNG 11
% % % %
Commercial paper
1197
7
3.19
% 8105
2.52
% 8499
2.93
% 6308
2.72
%
Current portion of long-term debt 6496
1.73
% 3500
1.09
% 2500
0.86
% 0
Total current liabilities
1008
14
26.86
%
7900
6
24.56
%
8061
0
27.75
%
6344
8
27.37
%
Deferred revenue, non-current 2836
0.76
% 2930
0.91
% 3624
1.25
% 3031
1.31
%
Long-term debt
9720
7
25.90
%
7542
7
23.45
%
5346
3
18.41
%
2898
7
12.50
%
Other non-current liabilities
4041
5
10.77
%
3607
4
11.21
%
3342
7
11.51
%
2482
6
10.71
%
Total liabilities
2412
72
64.28
%
1934
37
60.13
%
1711
24
58.91
%
1202
92
51.89
%
Shareholders’ equity:
Common stock and additional
paid-in capital,
3586
7
9.56
%
3125
1
9.71
%
2741
6
9.44
%
2331
3
10.06
%
Retained earnings
9833
0
26.20
%
9636
4
29.96
%
9228
4
31.77
%
8715
2
37.59
%
Accumulated other
comprehensive income/(loss) -150
-
0.04
% 634
0.20
% -345
-
0.12
% 1082
0.47
%
Total shareholders’ equity
1340
47
35.72
%
1282
49
39.87
%
1193
55
41.09
%
1115
47
48.11
%
Total liabilities and
shareholders’ equity
3753
19
100.0
0%
3216
86
100.0
0%
2904
79
100.0
0%
2318
39
100.0
0%
Ratio Analysis
Current
ratio
Current
assets
$
1,28,645.
00
1.
28
$
1,06,869.0
0
1.
35
$
89,378.00
1.
11
$
68,531.00
1.
08
Current
liabilities
$
1,00,814.
00
$
79,006.00
$
80,610.00
$
63,448.00
Quick
ratio
Quick
assets
$
1,23,790.
00
1.
23
$
1,04,737.0
0
1.
33
$
87,029.00
1.
08
$
66,420.00
1.
05
Current
Liabilities
$
1,00,814.
00
$
79,006.00
$
80,610.00
$
63,448.00
⊘ This is a preview!⊘
Do you want full access?
Subscribe today to unlock all pages.
Trusted by 1+ million students worldwide
1 out of 22
Related Documents


Your All-in-One AI-Powered Toolkit for Academic Success.
+13062052269
info@desklib.com
Available 24*7 on WhatsApp / Email
![[object Object]](/_next/static/media/star-bottom.7253800d.svg)
Unlock your academic potential
Copyright © 2020–2026 A2Z Services. All Rights Reserved. Developed and managed by ZUCOL.