Comparative Financial Analysis of Apple and Samsung (2014-2017)
VerifiedAdded on 2021/01/02
|38
|3940
|89
Report
AI Summary
This report provides a comprehensive financial analysis comparing the performance of Apple and Samsung from 2014 to 2017. The analysis employs ratio analysis, horizontal, and vertical analysis techniques to assess profitability and financial health. The report includes detailed financial ratios for both companies, enabling a critical comparison of their performance over the four-year period. In addition to financial data, the report also examines the Corporate Social Responsibility (CSR) sections of both companies, providing insights into their social and ethical practices. The findings of the analysis are interpreted to determine the better-performing firm, offering a clear understanding of their financial strengths and weaknesses. The report is designed to provide a clear and concise overview of each company's financial position and performance.

FAME
Paraphrase This Document
Need a fresh take? Get an instant paraphrase of this document with our AI Paraphraser
Table of Contents
INTRODUCTION...........................................................................................................................1
MAIN BODY...................................................................................................................................1
1. Critically comparing and contrasting financial performance of Samsung and Apple for last
four years.....................................................................................................................................1
.....................................................................................................................................................3
.....................................................................................................................................................4
2. Analysing CSR sections of companies and commenting on findings...................................15
CONCLUSION..............................................................................................................................16
REFERENCES..............................................................................................................................18
APPENDIXES...............................................................................................................................19
INTRODUCTION
Financial management and information have significant role in assessing overall financial
position in effective manner. Present report deals with Apple and Samsung both are tech-giants
and comparison of financial performance of companies will be undertaken in the report. For
accomplishing this, widely used technique, ratio analysis will be applied for assessing
performance over four years starting from 2014-2017. Moreover, vertical and horizontal analysis
for both companies will be applied for same period. Apart from it, CSR sections of companies
will be analysed and explained in report. Thus, overall financial performance of organisations
will be assessed and interpreted and better performing firm will be analysed.
MAIN BODY
1. Critically comparing and contrasting financial performance of Samsung and Apple for last
four years
Financial Ratios of Samsung and Apple are listed below-
Profitability Ratios
Samsung Apple
Particulars Formula 2017 2016 2015 2014 2017 2016 2015 2014
Profitability
Ratios
Net profit
3729788
4
1959426
0 1684802 20679181 48351 45687 53394 39510
Gross profit
9750423
4
7034542
8 68214765 68882866 88186 84263 93626 70537
Sales Revenue
2118118
87
1740479
40 177365404 182273479 229234 215639 233715 182795
Gross profit
margin
Gross
profit/Sal
es
revenue 0.46 0.4 0.38 0.37 0.38 0.39 0.4 0.38
1
⊘ This is a preview!⊘
Do you want full access?
Subscribe today to unlock all pages.
Trusted by 1+ million students worldwide
Net profit margin
Net
profit/Sal
es
revenue 0.17 0.11 0.09 0.11 0.21 0.21 0.22 0.21
2
Net
profit/Sal
es
revenue 0.17 0.11 0.09 0.11 0.21 0.21 0.22 0.21
2
Paraphrase This Document
Need a fresh take? Get an instant paraphrase of this document with our AI Paraphraser
Illustration 1: Gross profit ratio
Illustration 2: Net profit ratio
3
Illustration 2: Net profit ratio
3
Interpretation-
It can be interpreted from above graphs that profitability ratios are being computed for
both companies. Gross profit is one of the important profitability measure which is carried out by
deducting cost of goods manufactured from sales revenue. It can be analysed that Apple had
gross profit ratio of 0.38 in 2014 which reached to 0.40 in 2015. This clearly shows that firm is
able to reduce expenses on sales and thus, ratio is improved. Moreover, in 2016, it was reduced
and come to 0.39 and further to 0.38 in 2017. It shows that ratio is steady over last four years. On
the other hand, Samsung had ratio of 0.37 in 2014. While, in next year, 0.38 was attained and
0.40 in 2016. In 2017, gross profit ratio had reached record high of 0.46 (Annual report of
Samsung. 2017). This shows that firm is able to initiate reduction upon its expenses in the best
manner possible.
Net profit is calculated which shows operational and non-operational expenditures which
are deducted from gross profit to arrive at net income. Taxes and interest are accounted for and
subtracted from profit and as a result, it is also known as PAT (Profit After Tax). It can be
assessed that Samsung had net profit ratio of 0.11 in 2014, reached to 0.09 in 2015. It reached to
0.11 in 2016 and increased to 0.17 in next period. This shows that it has initiated good control
over the expenses in order to ascertain good quantum of profits in the best manner possible.
Apple had ratio of 0.21 in 2014 which increased in 2015 to 0.22 showing that it had good
position in comparison to Samsung in following two years. On the other hand, it can be analysed
that in 2016 and 2017, ratio was 0.21.
It can be assessed that in accordance to gross profit ratio, Samsung has more of it as it is
able to control its expenses in a better manner. On the other hand, net profit ratio of Apple is
good as overall expenditures are being controlled in a better manner. This shows that collectively
Apple has good profitability position as all expenses are being controlled and monitored from
time-to-time leading to have profitable position in effective manner (Annual report of Apple.
2017). It is required that Samsung should control its manufacturing and interest expenses so that
higher profits may be attained in a better manner. This will be beneficial for the firm in long run
and rivalries will be outreached with ease. Hence, profitability ratios shows financial health of
company which is required to ascertained in a better way.
Liquidity Ratios
4
⊘ This is a preview!⊘
Do you want full access?
Subscribe today to unlock all pages.
Trusted by 1+ million students worldwide
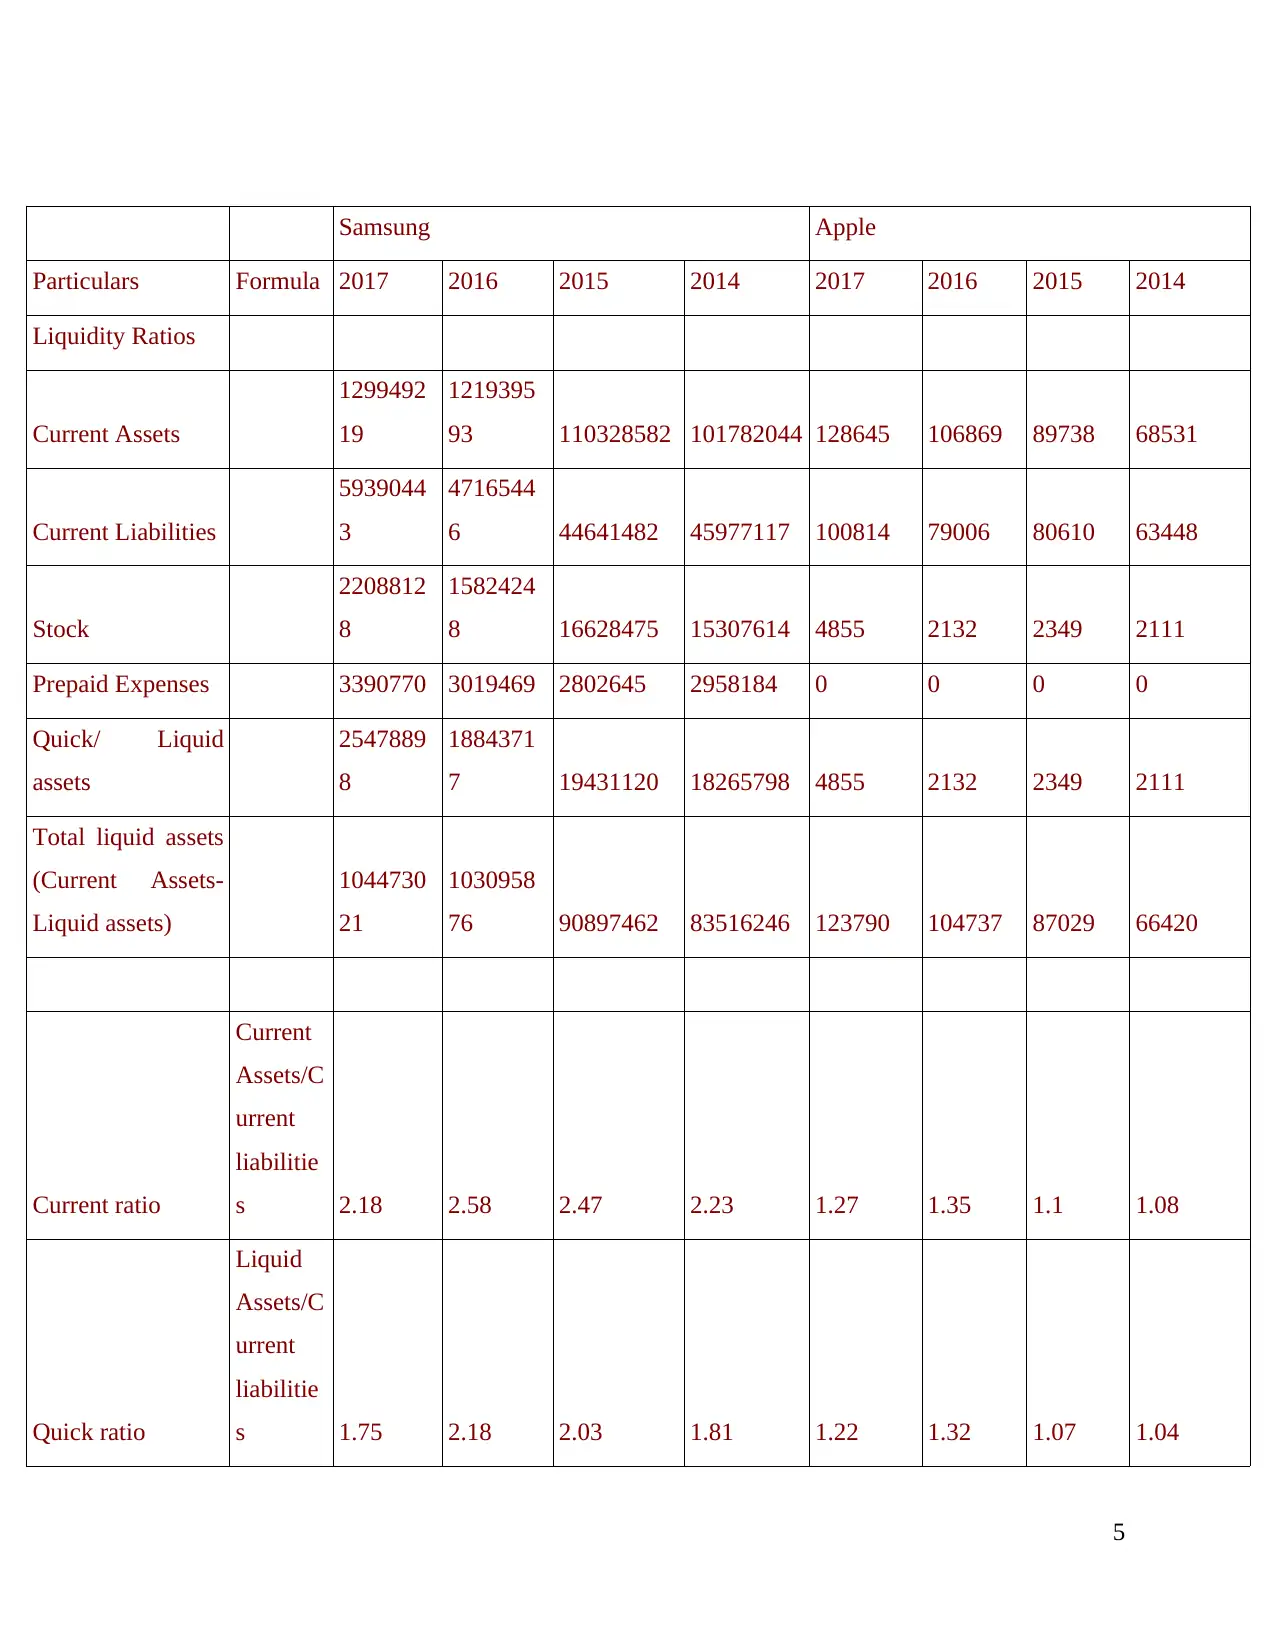
Samsung Apple
Particulars Formula 2017 2016 2015 2014 2017 2016 2015 2014
Liquidity Ratios
Current Assets
1299492
19
1219395
93 110328582 101782044 128645 106869 89738 68531
Current Liabilities
5939044
3
4716544
6 44641482 45977117 100814 79006 80610 63448
Stock
2208812
8
1582424
8 16628475 15307614 4855 2132 2349 2111
Prepaid Expenses 3390770 3019469 2802645 2958184 0 0 0 0
Quick/ Liquid
assets
2547889
8
1884371
7 19431120 18265798 4855 2132 2349 2111
Total liquid assets
(Current Assets-
Liquid assets)
1044730
21
1030958
76 90897462 83516246 123790 104737 87029 66420
Current ratio
Current
Assets/C
urrent
liabilitie
s 2.18 2.58 2.47 2.23 1.27 1.35 1.1 1.08
Quick ratio
Liquid
Assets/C
urrent
liabilitie
s 1.75 2.18 2.03 1.81 1.22 1.32 1.07 1.04
5
Paraphrase This Document
Need a fresh take? Get an instant paraphrase of this document with our AI Paraphraser
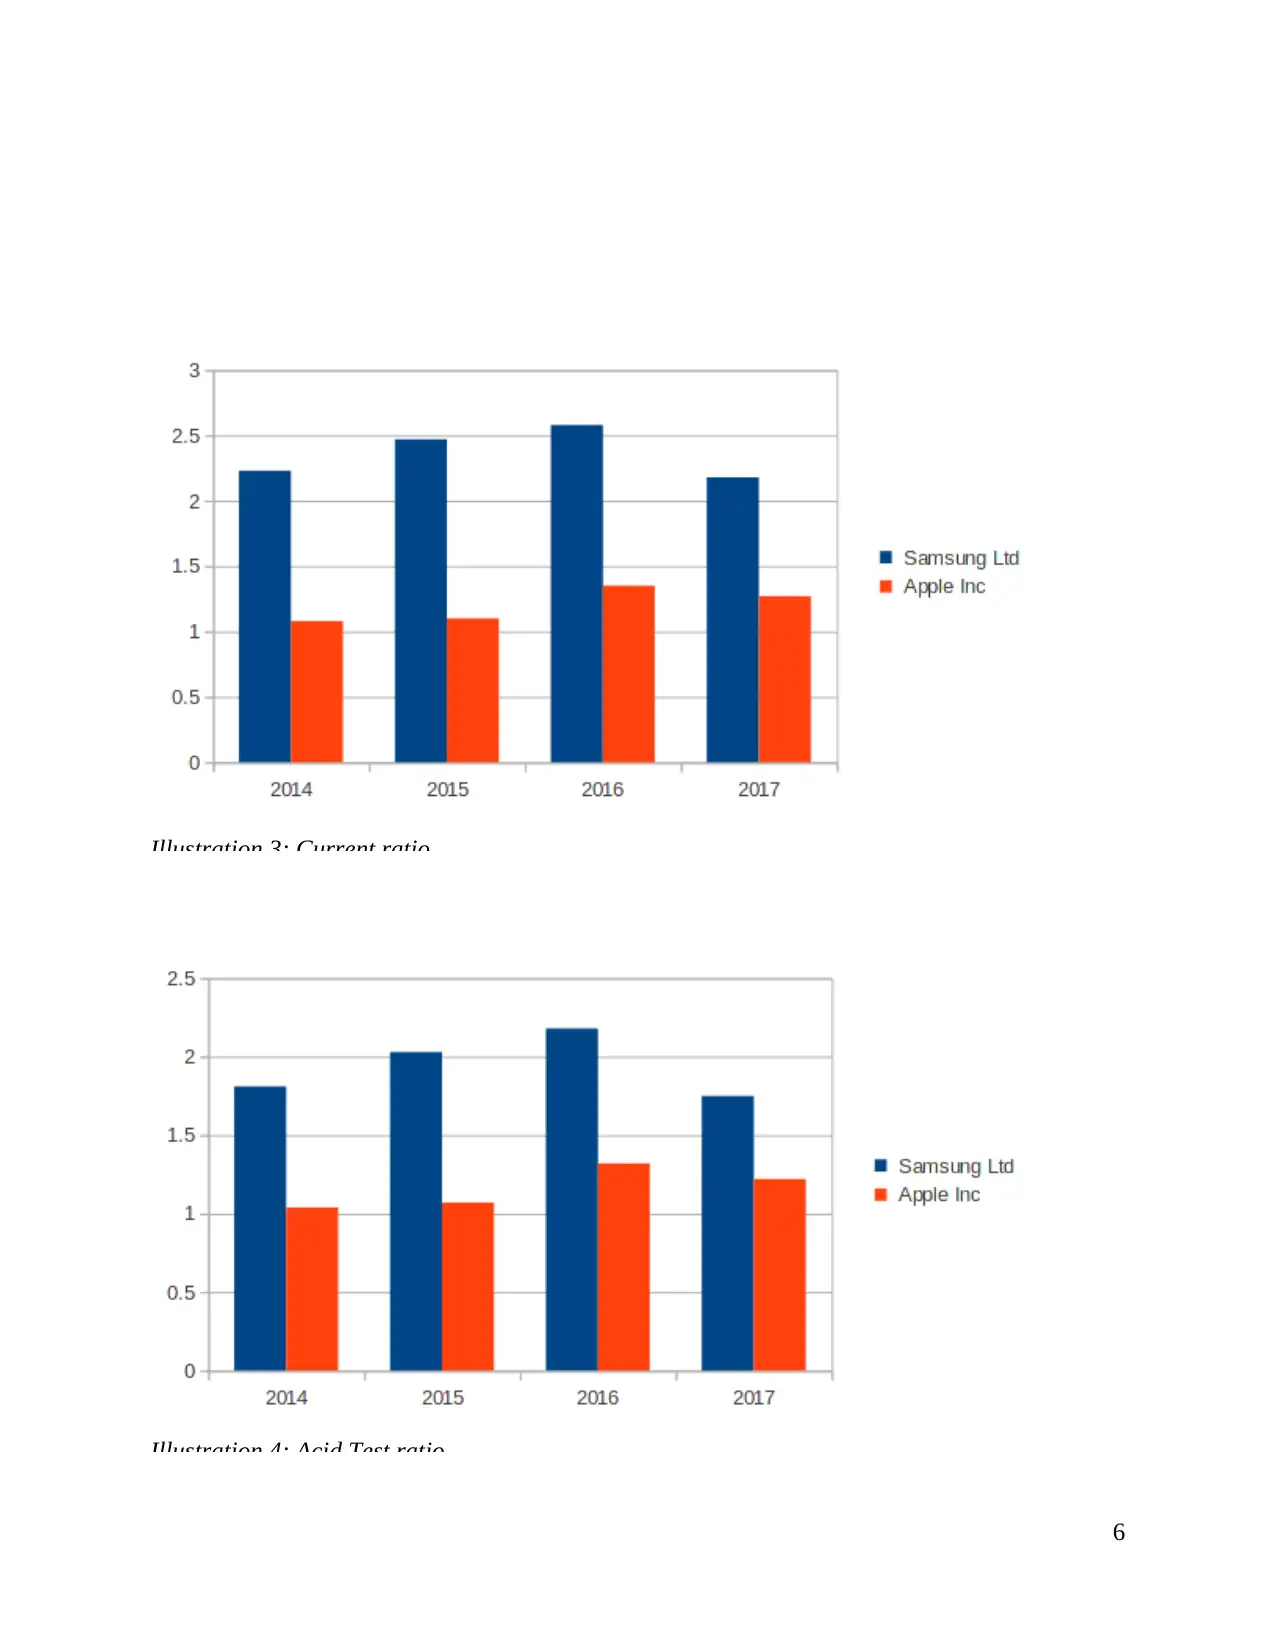
Illustration 3: Current ratio
Illustration 4: Acid Test ratio
6
Illustration 4: Acid Test ratio
6
Interpretation-
The above graphs show liquidity position of Apple and Samsung for last four years quite
effectively. The pictorial representation provides clarity as to whether which firm has better
liquidity position over the years. The current ratio has been calculated. It is useful measurement
of carrying out whether firm could meet its short-term liabilities to the concerned parties within
stipulated time or not. In simple words, it shows how current assets can be quickly converted into
cash and cash equivalents to pay-off liabilities to parties. Suppliers, creditors of materials are of
main concern of assessing this ratio. The ideal current ratio turns out to be 2:1 meaning for
meeting every one liability, there are two current assets. Thus, ensuring that short-term
obligations are paid off within one year and no shortcomings are arrived at.
Samsung had current ratio of 2.23 in 2014 which is highly effective as it is showing that
for one liability, current assets of 2.23 are available being favourable for firm. It can be assessed
that in 2015, ratio was 2.47 and reached to 2.58 in 2016. However, it decreased in 2017 to 2.18,
thus, requires to quickly convert assets to cash for enhancing liquidity position. Apple had ratio
of 1.08 in 2014 which shows that firm would face difficulties in meeting obligations. It further
reached to 1.1 in 2015 and increased to 1.35 and 1.27 in 2016 and 2017 respectively. This shows
that firm needs to enhance its current ratio else it will have to face repercussions of the same.
Acid Test ratio is another important ratio for assessing liquidity position in the best way
possible. It shows how efficiently firm has liquidity position in terms of its extreme quick assets.
Here, quick assets or liquid assets is arrived by deducting inventory and prepaid expenses if any
from current assets. The resultant shows liquid assets of company in effective manner. It can be
analysed that ideal ratio is 1:1 which means for every single asset, one liability should be present
for converting into cash and meeting obligations. It can be assessed that Samsung had quick ratio
of 1.81 in 2014 which increased to 2.03 in next year.
The ratio further increased to 2.18 and 1.75 in 2016 and 2017 respectively. It can be
assessed that Samsung has more than ideal ratio which is good but it is required to utilise quick
assets judiciously. Apple had ratio of 1.04 in 2014, maximised to 1.07 in 2015. Furthermore,
quick ratio reached to 1.32 and 1.22 in next two years respectively. This shows that Apple also
7
⊘ This is a preview!⊘
Do you want full access?
Subscribe today to unlock all pages.
Trusted by 1+ million students worldwide
has good liquidity position as per ideal ratio. However, by referring to overall liquidity position
of both companies, Samsung has better position.
Efficiency Ratios
Samsung Apple
Particulars Formula 2017 2016 2015 2014 2017 2016 2015 2014
Efficiency Ratios
Cost of Goods
manufactured
1143076
53 103702512
10915063
9 113390613 141048 131376 140089 112258
Stock
2208812
8 15824248 16628475 15307614 4855 2132 2349 2111
Total assets
2667831
76 226044667
21407188
3 203679800 375319 321686 290479 231839
Sales Revenue
2118118
87 174047940
17736540
4 182273479 229234 215639 233715 182795
Inventory turnover
ratio
Cost of
Goods
manufact
ured/Ave
rage
inventory 5.17 5.47 6.7 7.1 29.05 37.6 62.52 50.33
Asset turnover
ratio
Sales
revenue/
Average
total
assets 0.79 0.7 0.8 0.87 0.61 0.61 0.76 0.69
8
Paraphrase This Document
Need a fresh take? Get an instant paraphrase of this document with our AI Paraphraser
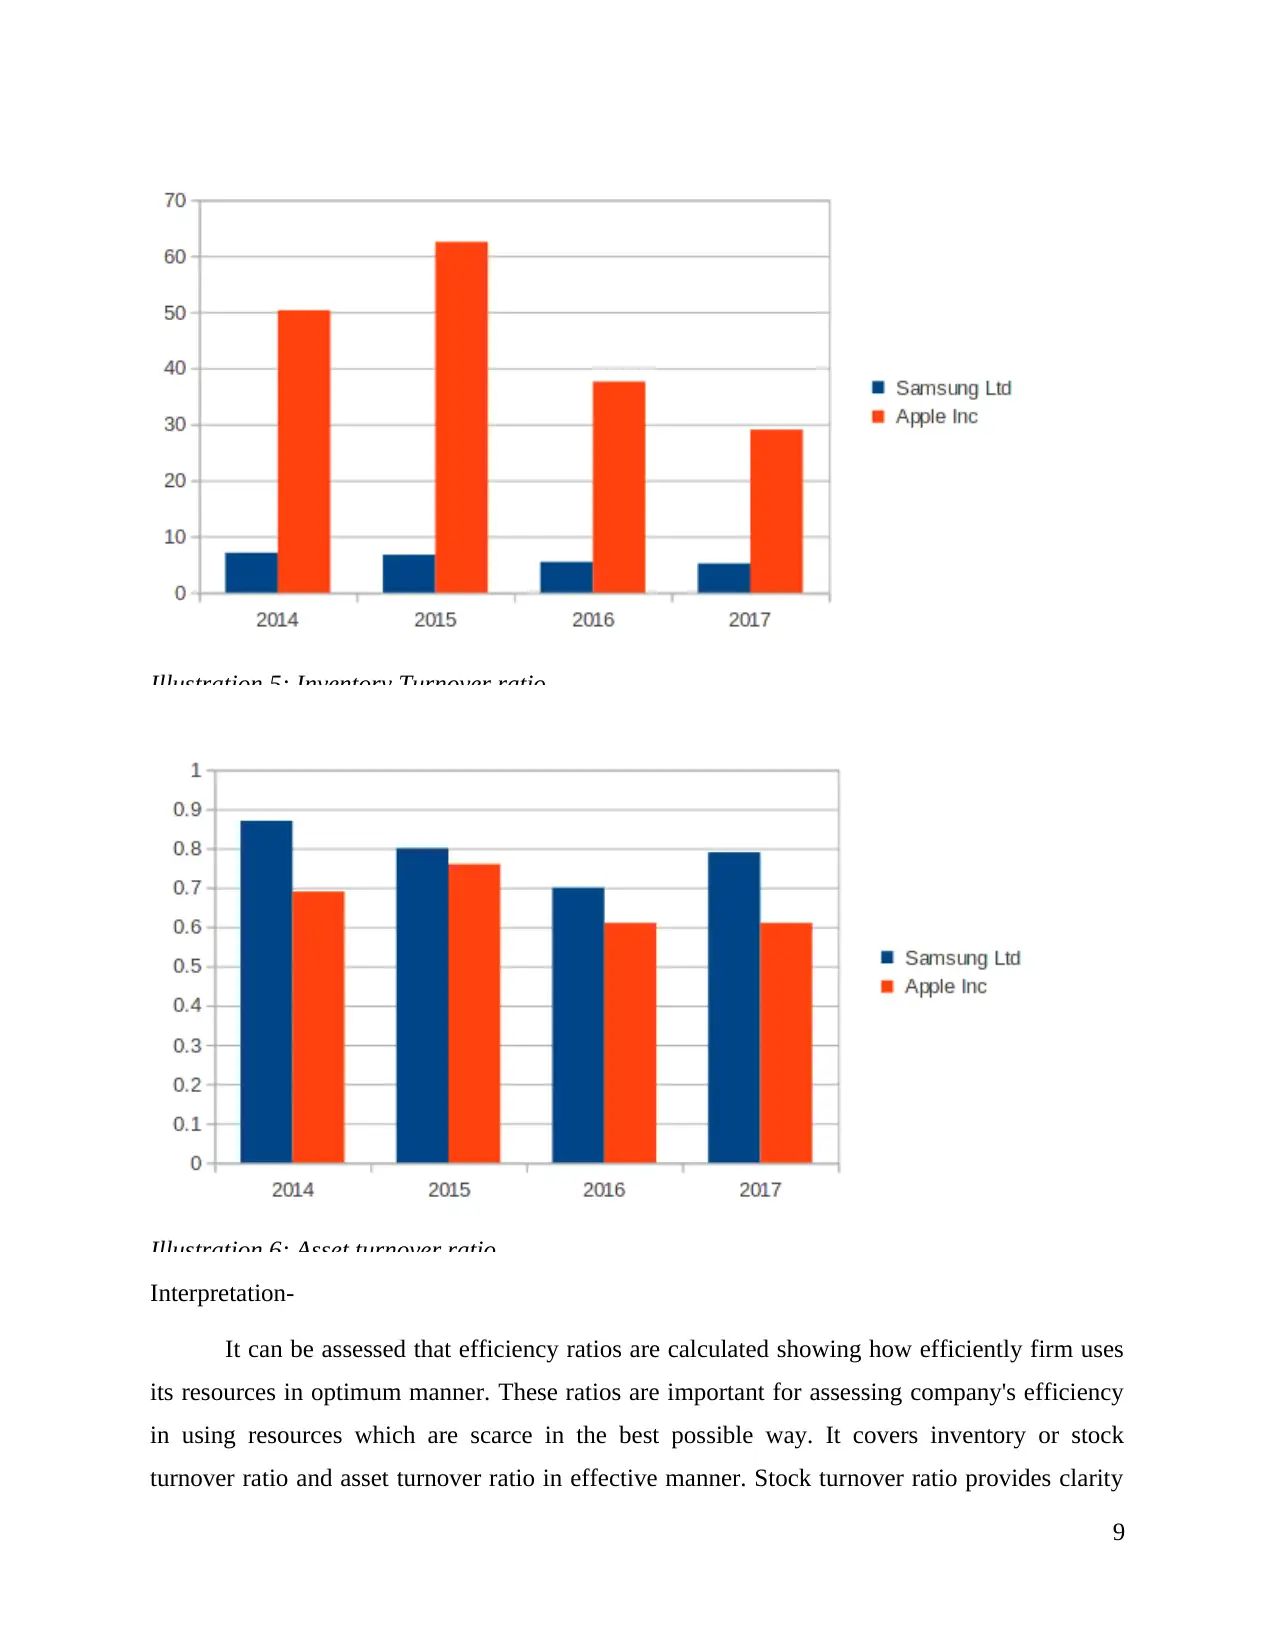
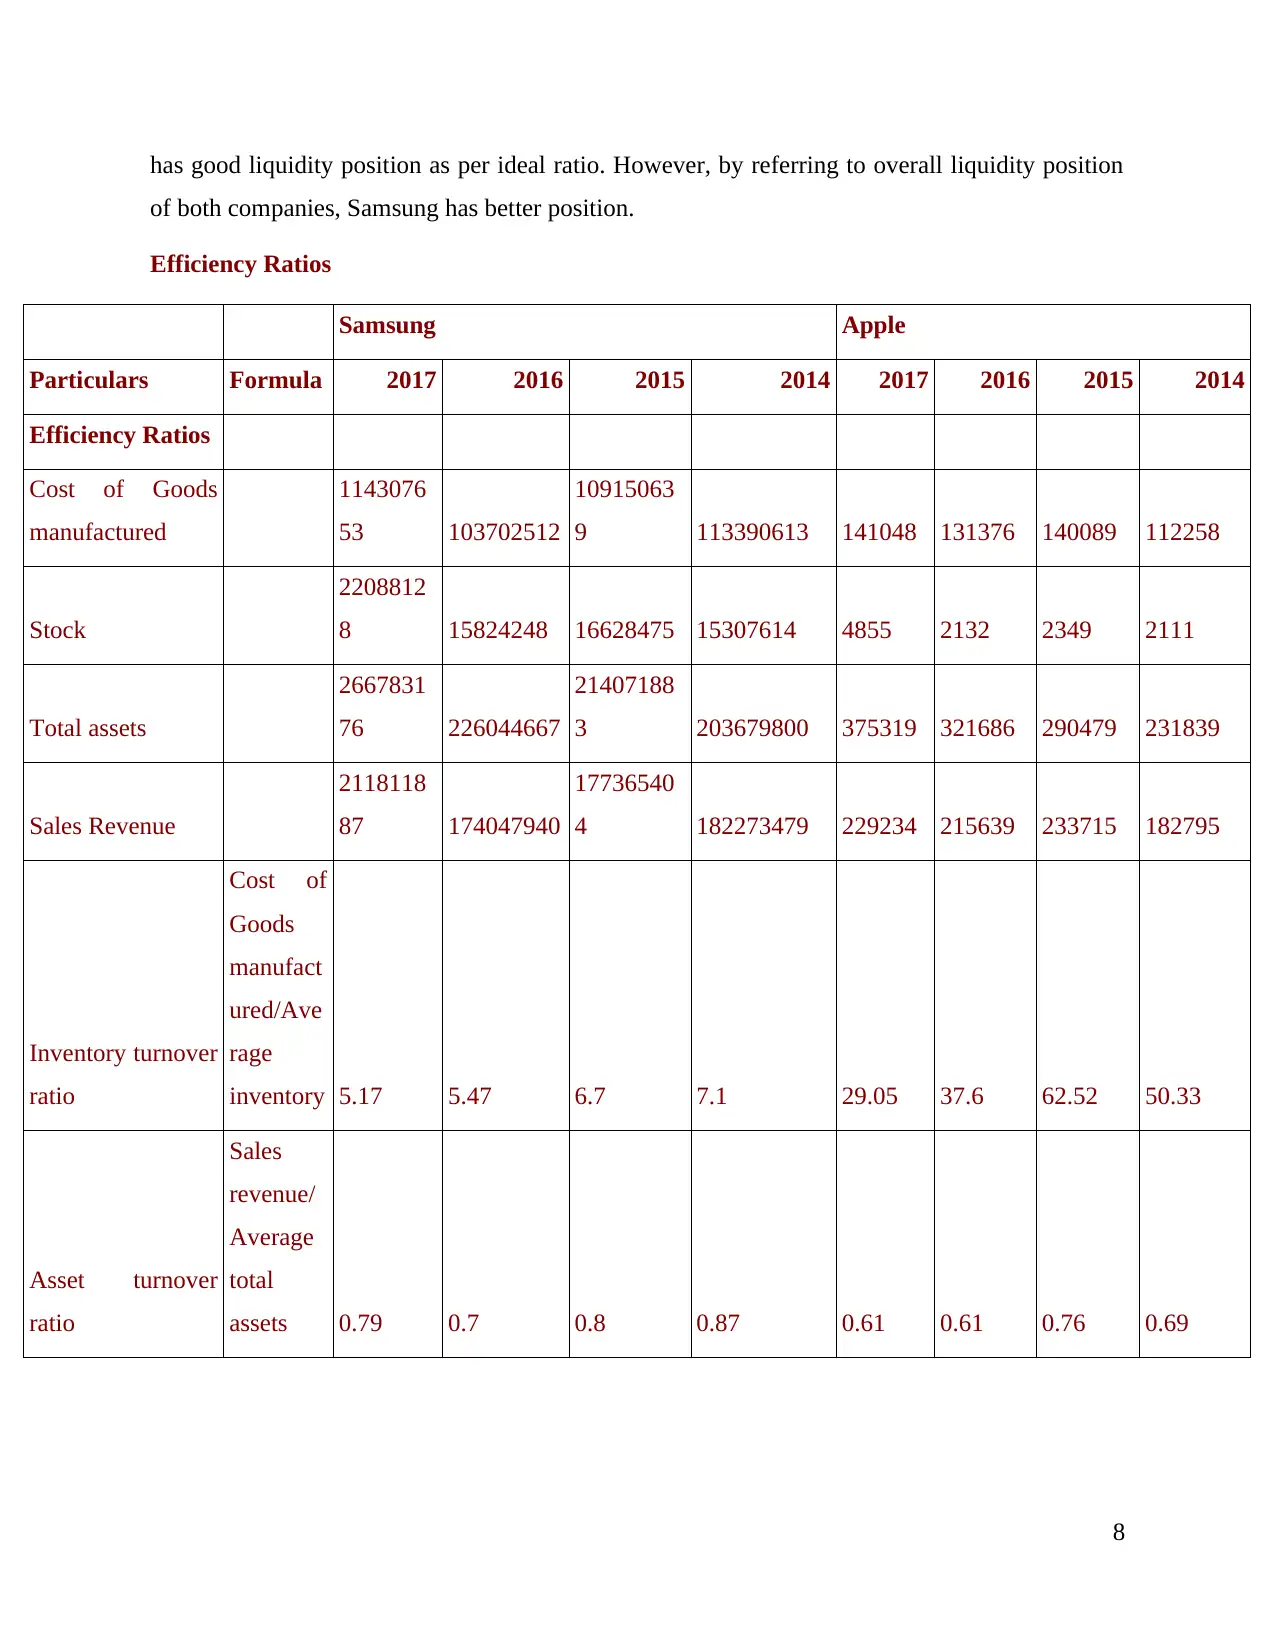
Illustration 5: Inventory Turnover ratio
Illustration 6: Asset turnover ratio
Interpretation-
It can be assessed that efficiency ratios are calculated showing how efficiently firm uses
its resources in optimum manner. These ratios are important for assessing company's efficiency
in using resources which are scarce in the best possible way. It covers inventory or stock
turnover ratio and asset turnover ratio in effective manner. Stock turnover ratio provides clarity
9
as to how efficiently firm uses its inventory for converting the same into sales revenue. Less the
ratio, better health of company. Apple had inventory ratio of 50.33 in 2014 which reached to
62.52 in next year. Furthermore, figure reached to 37.6 and 29.05 in 2016 and 2017 respectively.
It implies that organisation has improved its ratio by utilising inventory in effective manner.
Samsung had similar ratio of 7.1 in 2014 which has decreased to 6.7 in 2015. On the
other hand, ratio decreased to 5.47 in 2016 and 5.17 in 2017. These figures clearly shows that
firm is able to initiate healthy usage of stock for meeting demand of customers. It can be
analysed both Hi-Tech rivals have good inventory turnover ratio. Efficiency ratio such as asset
turnover ratio is also computed for both organisations. This ratio means how firm efficiently
utilises its assets for generating good sales in the best manner possible. It is quite useful for
business as it provides clarity of how asset is being used in the firm and how return is generated
from it for increasing sales.
It can be analysed that Samsung had asset turnover ratio of 0.87 in 2014 which decreased
to 0.80 in next year. Furthermore, it reduced to 0.70 in 20163 and increased in 2017 to 0.79. This
shows that asset turnover ratio is not steady and it requires using its assets for enhancing sales in
a better way. On the other hand, Apple had ratio of 0.69 in 2014, elevated to 0.76 in next period.
It remained unchanged in 2016 and 2017 as 0.61 was being attained. This shows that firm is
required to use asset in judicious manner for maximising revenue. Thus, Samsung had good asset
turnover ratio in comparison to Apple.
Solvency Ratios
Samsung Apple
Particulars
Form
ula 2017 2016 2015 2014 2017 2016 2015 2014
Solvency Ratios
Long-term loans 1604177 1072772 235607 89871 97207 75427 53463 28987
Shareholders'
Equity
18963482
4 166371229 158277915
14857967
6 134047 128249 119355 111547
10
⊘ This is a preview!⊘
Do you want full access?
Subscribe today to unlock all pages.
Trusted by 1+ million students worldwide
1 out of 38
Related Documents


Your All-in-One AI-Powered Toolkit for Academic Success.
+13062052269
info@desklib.com
Available 24*7 on WhatsApp / Email
![[object Object]](/_next/static/media/star-bottom.7253800d.svg)
Unlock your academic potential
Copyright © 2020–2026 A2Z Services. All Rights Reserved. Developed and managed by ZUCOL.