Comparative Financial Analysis of Apple Inc. and Samsung Ltd. Report
VerifiedAdded on 2020/10/05
|18
|3819
|425
Report
AI Summary
This report presents a detailed financial analysis of Apple Inc. and Samsung Ltd., comparing their financial strengths and weaknesses through ratio analysis. The introduction emphasizes the importance of financial analysis for organizational success and provides a brief overview of the two companies. The report then delves into profitability ratios, including gross profit margin and net profit margin, providing interpretations of the financial performance of both companies over a four-year period. Liquidity ratios, such as current and acid-test ratios, are examined to assess the companies' ability to meet short-term obligations. Solvency ratios, specifically the debt-equity ratio, are calculated to evaluate the companies' long-term financial stability. Finally, efficiency ratios, such as the inventory turnover ratio, are analyzed to assess how efficiently each company manages its inventory. The report provides a conclusion and recommendations based on the findings, offering insights into the financial health and performance of Apple and Samsung. This report is a valuable resource for students studying financial analysis and provides a comprehensive overview of the key financial aspects of two major industry players.
FINANCIAL
ANALYSIS
MANAGEMENT AND
ENTERPRISE
ANALYSIS
MANAGEMENT AND
ENTERPRISE
Paraphrase This Document
Need a fresh take? Get an instant paraphrase of this document with our AI Paraphraser
TABLE OF CONTENTS
INTRODUCTION...........................................................................................................................3
1. Financial strength and weakness.............................................................................................3
2. Representing CSR section of both organizations of last two year and stating its findings...13
CONCLUSION..............................................................................................................................16
REFERENCES..............................................................................................................................17
INTRODUCTION
Financial analysis is very important aspect for every organization. The present case is
giving brief scenario two huge giants of industry such as Samsung and Apple in context of
profitability. The present report is giving brief discussion about critical awareness,
comprehension of business and its prospects related to future. Further it has identified organised
and critically analysed its financial information with well structured format. In the context of
same series various innovative ideas on basis of understanding has been explained by addressing
key problems and theories mentioned in corporate financial management. Further it has
displayed capability for evaluating business issues which are very complex for formulating
various concepts on basis of judgement. It has articulated financial strength and weakness of
both organizations Apple Inc and Samsung Ltd with ratio analysis. Last but not least, conclusion
and recommendations has been provided in independent manner according to analysis which is
informative along with critical appraisal.
1. Financial strength and weakness
In the present era, it is becoming very hard for choosing Samsung or Apple as
they both are equally flawed as brand which is ignored in unfair aspect. There are various
arguments, which are well made and acceptable in context of high performance phones of
Samsung and Apple.
As in 2018, Samsung had lost its flagship due to fundamental dullness and lack of
ephemeral compelling reasons. However, it had got high brand image which is obscuring
everything as it is known as world of Android which is everybody's first choice. Samsung
Electronics is committed for raising level of global community and it delivers groundbreaking
innovations, which are enhancing daily lives of people (Apple vs Samsung phones, 2018).
It is an inspiring world and shaping future with different transformative technologies and
ideas, which are providing power to people for discovering innovative experience such as
smartphones, digital appliances, LED solutions, wearable devices and memory. Apple
manufactures, design and markets mobile communication and various other and most important
is applications of third party digital content. It operates in context of selling and delivering
specific digital content and application via iTunes store.
⊘ This is a preview!⊘
Do you want full access?
Subscribe today to unlock all pages.
Trusted by 1+ million students worldwide
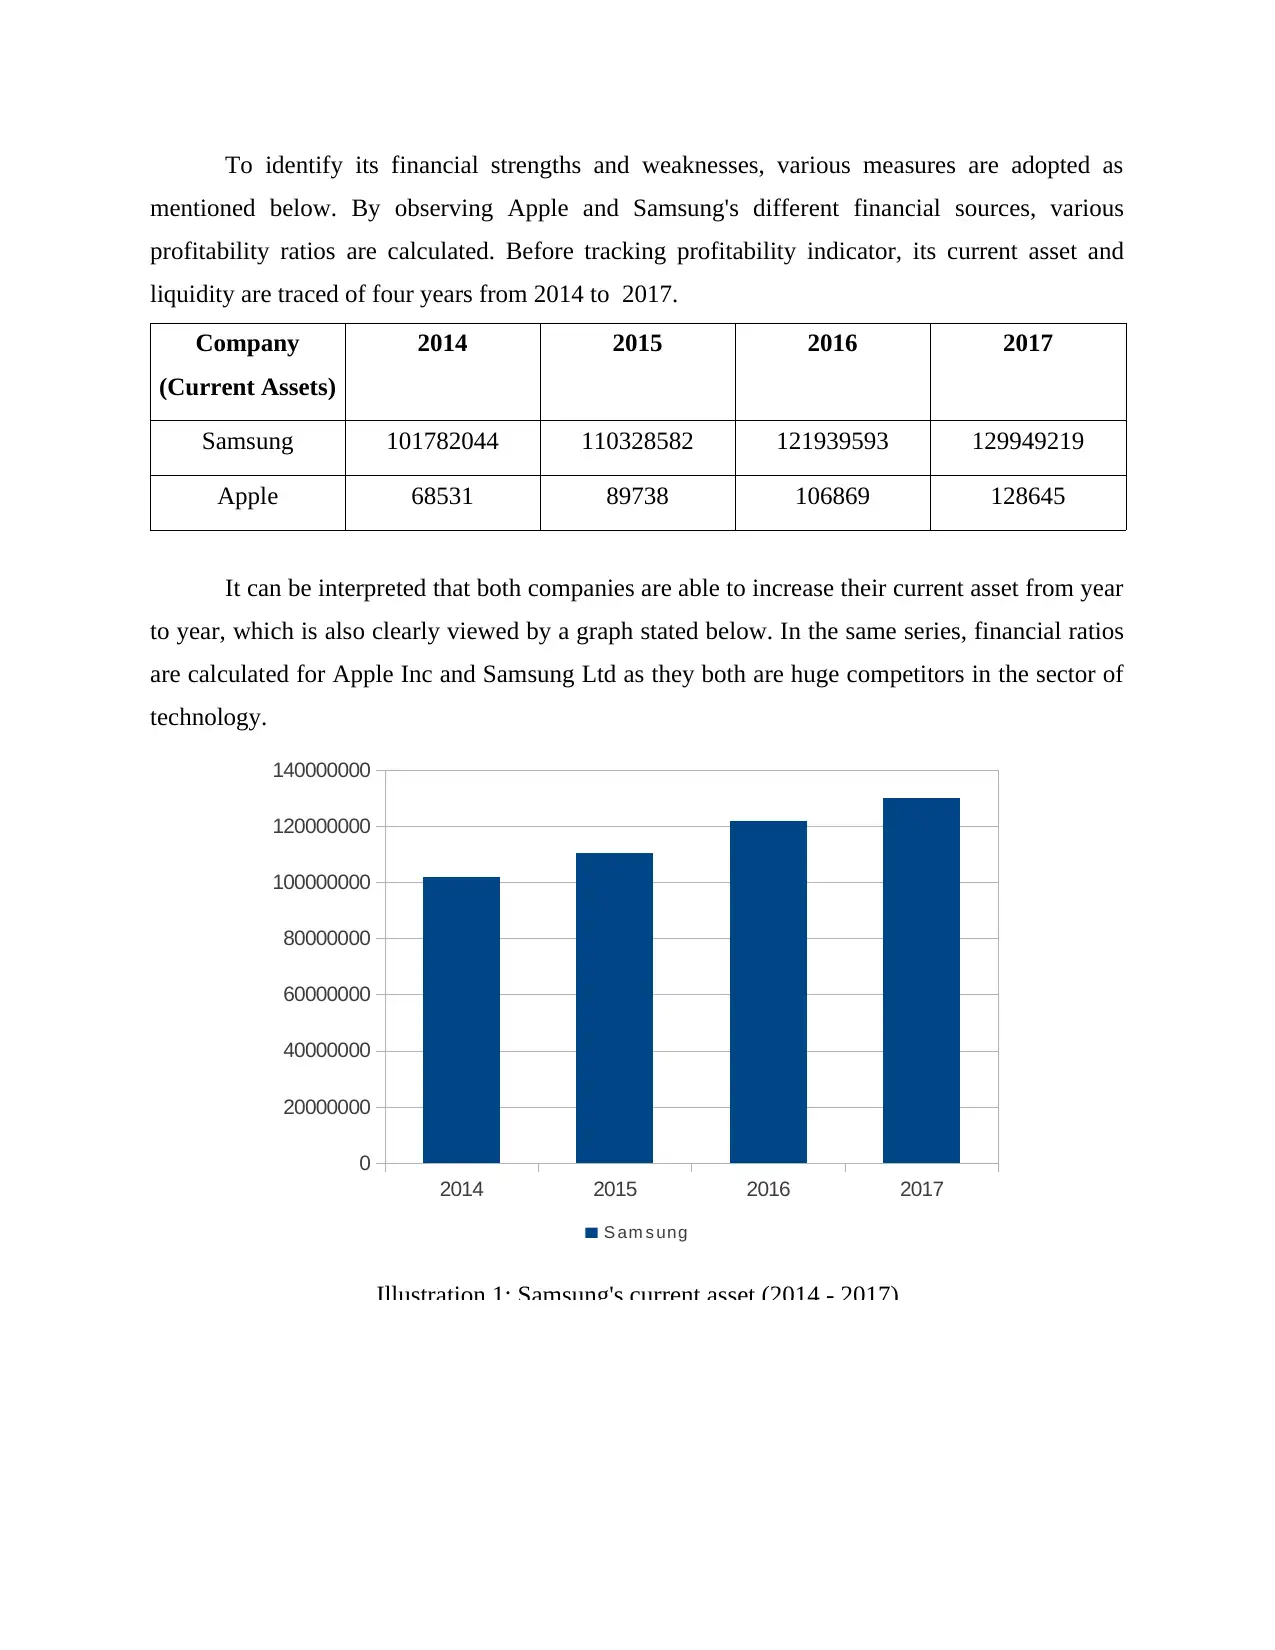
To identify its financial strengths and weaknesses, various measures are adopted as
mentioned below. By observing Apple and Samsung's different financial sources, various
profitability ratios are calculated. Before tracking profitability indicator, its current asset and
liquidity are traced of four years from 2014 to 2017.
Company
(Current Assets)
2014 2015 2016 2017
Samsung 101782044 110328582 121939593 129949219
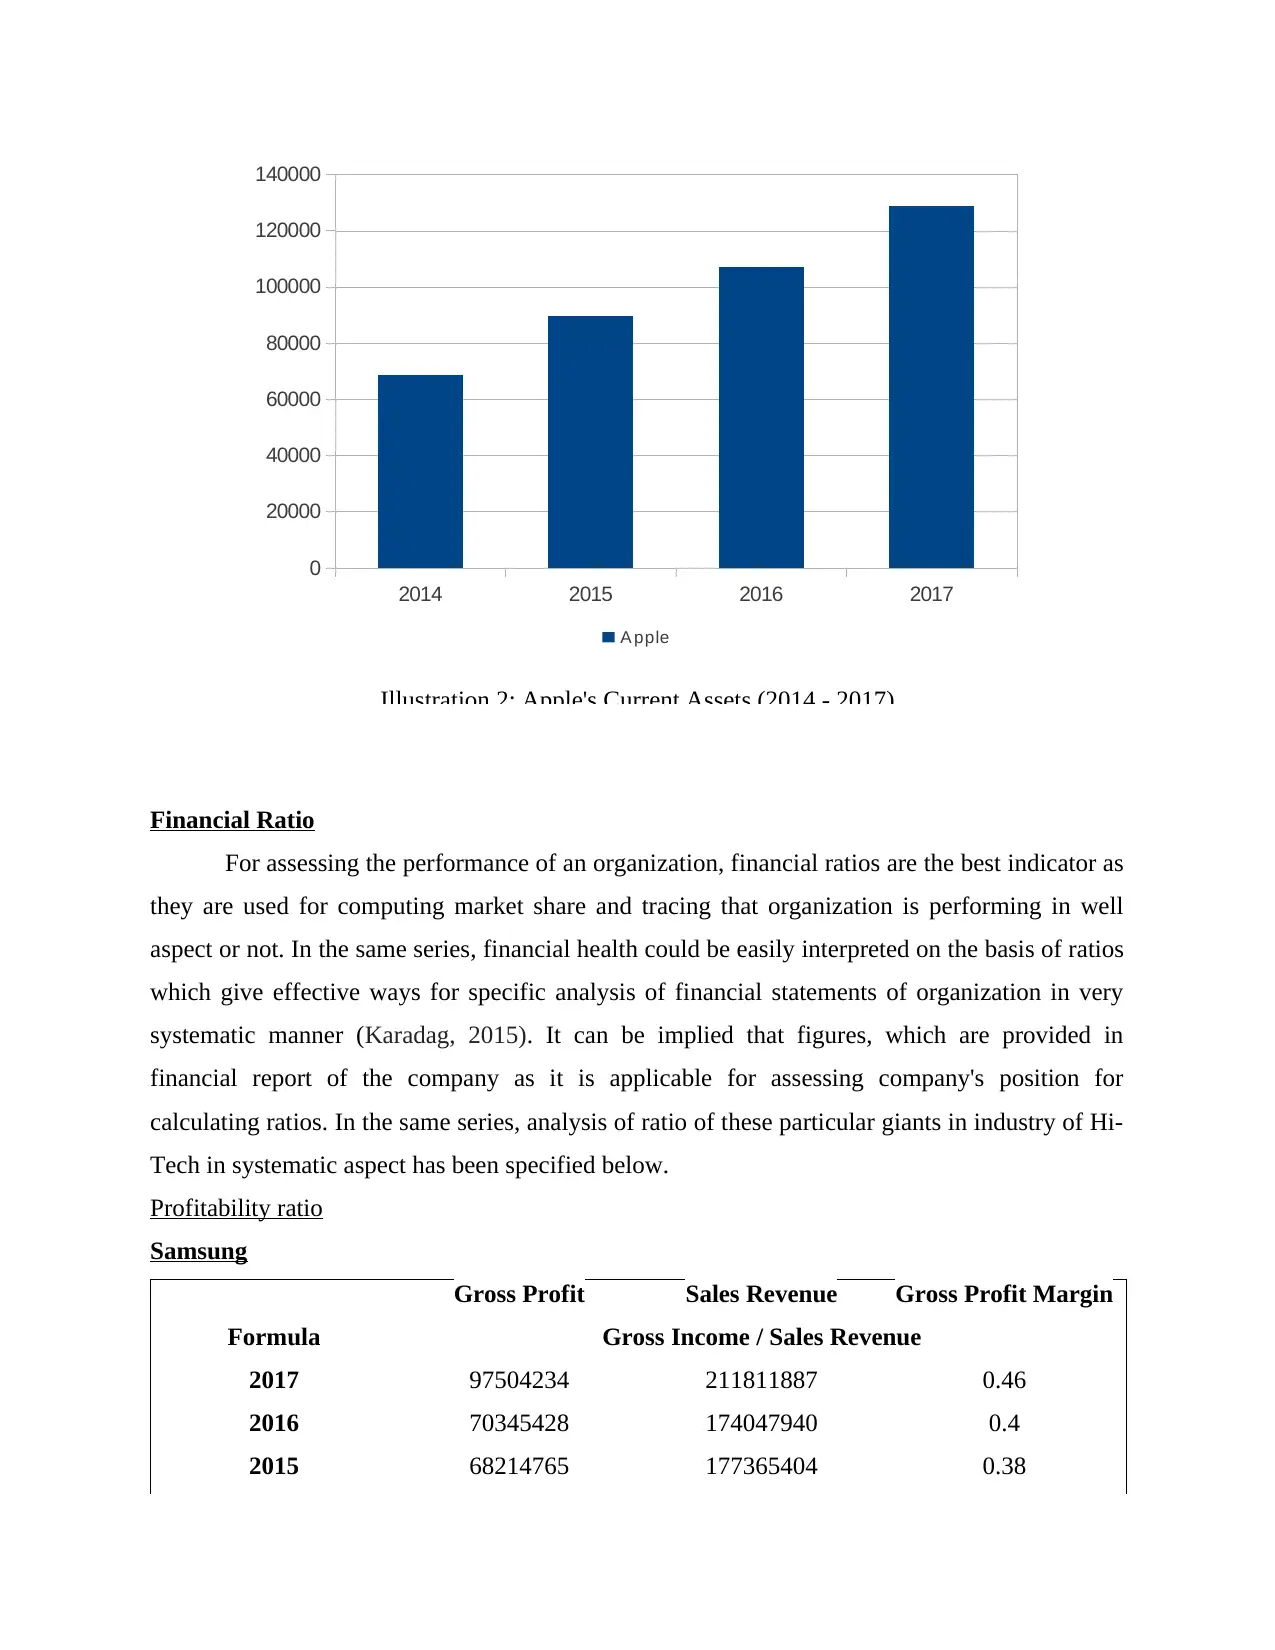
Apple 68531 89738 106869 128645
It can be interpreted that both companies are able to increase their current asset from year
to year, which is also clearly viewed by a graph stated below. In the same series, financial ratios
are calculated for Apple Inc and Samsung Ltd as they both are huge competitors in the sector of
technology.
2014 2015 2016 2017
0
20000000
40000000
60000000
80000000
100000000
120000000
140000000
S am s ung
Illustration 1: Samsung's current asset (2014 - 2017)
mentioned below. By observing Apple and Samsung's different financial sources, various
profitability ratios are calculated. Before tracking profitability indicator, its current asset and
liquidity are traced of four years from 2014 to 2017.
Company
(Current Assets)
2014 2015 2016 2017
Samsung 101782044 110328582 121939593 129949219
Apple 68531 89738 106869 128645
It can be interpreted that both companies are able to increase their current asset from year
to year, which is also clearly viewed by a graph stated below. In the same series, financial ratios
are calculated for Apple Inc and Samsung Ltd as they both are huge competitors in the sector of
technology.
2014 2015 2016 2017
0
20000000
40000000
60000000
80000000
100000000
120000000
140000000
S am s ung
Illustration 1: Samsung's current asset (2014 - 2017)
Paraphrase This Document
Need a fresh take? Get an instant paraphrase of this document with our AI Paraphraser
2014 2015 2016 2017
0
20000
40000
60000
80000
100000
120000
140000
A pple
Illustration 2: Apple's Current Assets (2014 - 2017)
Financial Ratio
For assessing the performance of an organization, financial ratios are the best indicator as
they are used for computing market share and tracing that organization is performing in well
aspect or not. In the same series, financial health could be easily interpreted on the basis of ratios
which give effective ways for specific analysis of financial statements of organization in very
systematic manner (Karadag, 2015). It can be implied that figures, which are provided in
financial report of the company as it is applicable for assessing company's position for
calculating ratios. In the same series, analysis of ratio of these particular giants in industry of Hi-
Tech in systematic aspect has been specified below.
Profitability ratio
Samsung
Gross Profit Sales Revenue Gross Profit Margin
Formula Gross Income / Sales Revenue
2017 97504234 211811887 0.46
2016 70345428 174047940 0.4
2015 68214765 177365404 0.38
2014 68882866 182273479 0.37
Apple
Gross Profit Sales Revenue Gross Profit Margin
Formula Gross Income / Sales Revenue
2017 88186 229234 0.38
2016 84263 215639 0.39
2015 93626 233715 0.4
2014 70537 182795 0.38
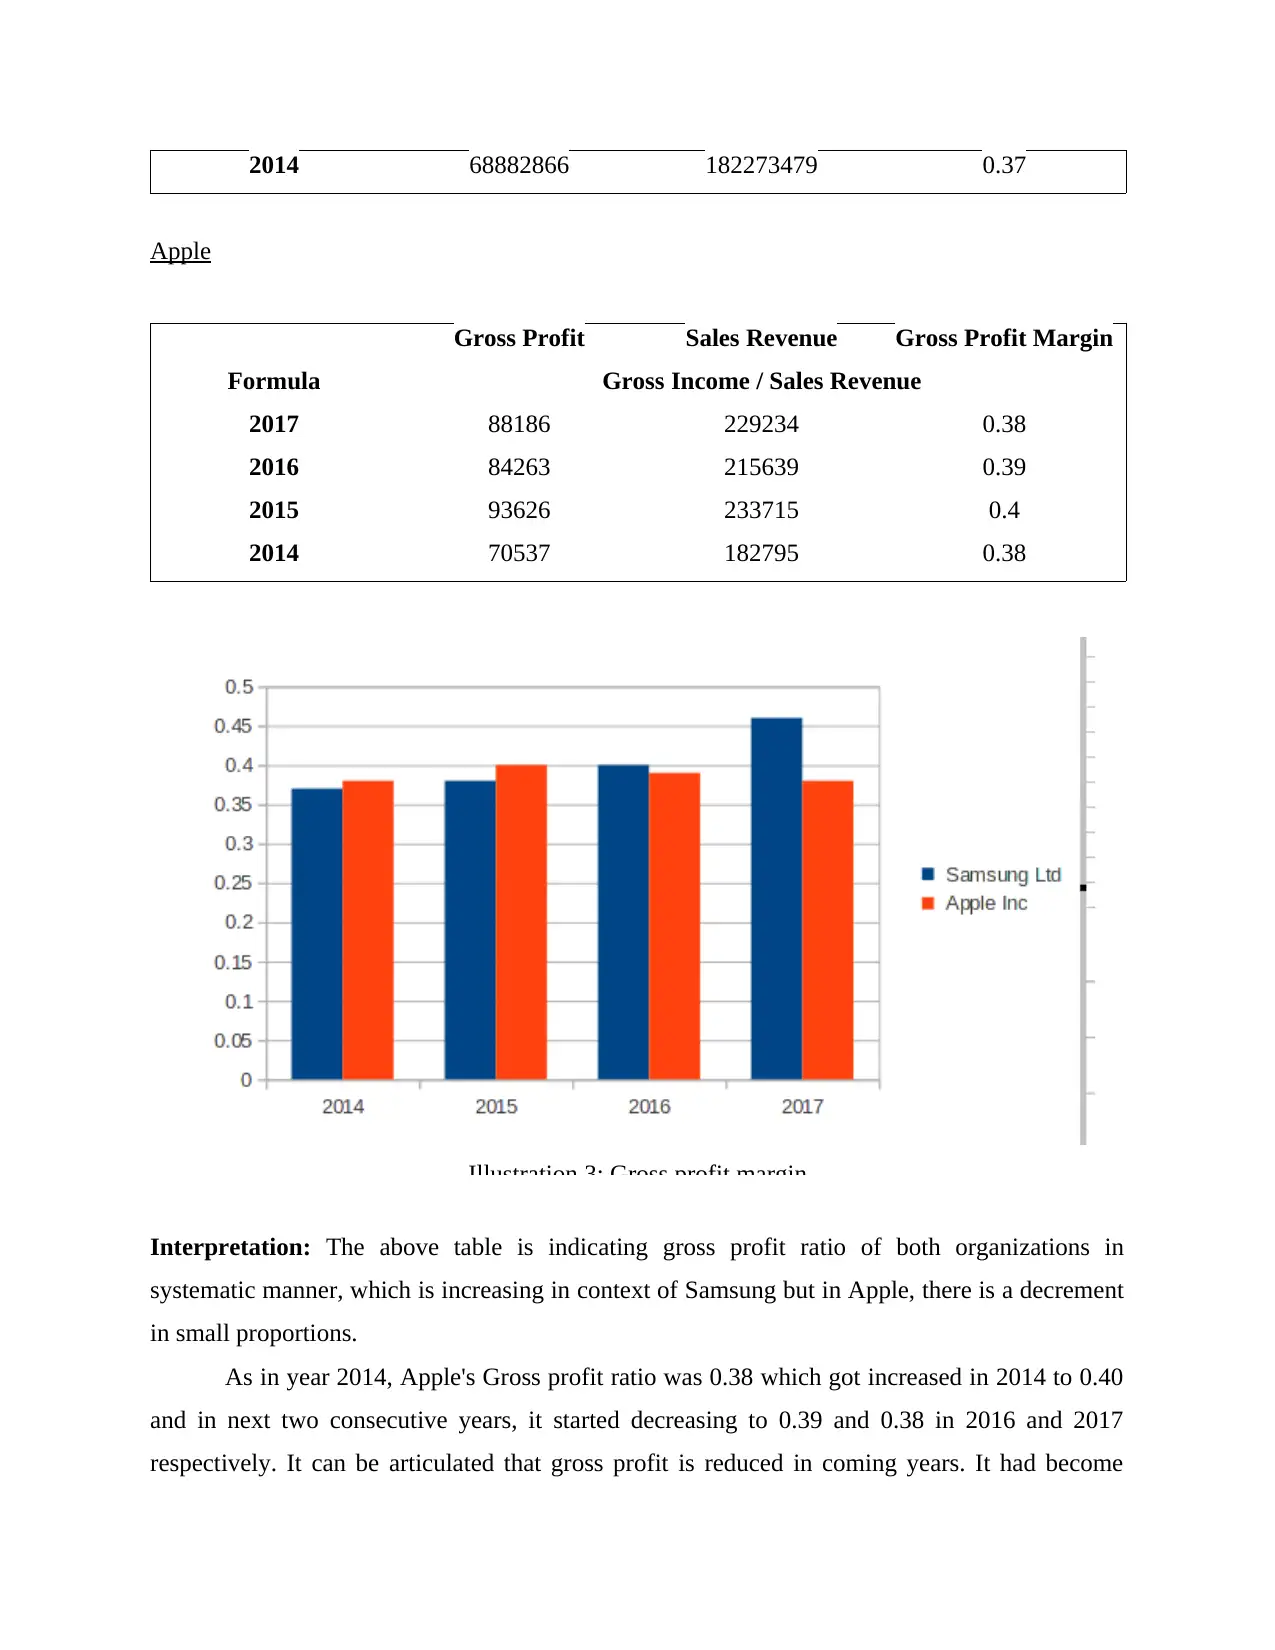
Illustration 3: Gross profit margin
Interpretation: The above table is indicating gross profit ratio of both organizations in
systematic manner, which is increasing in context of Samsung but in Apple, there is a decrement
in small proportions.
As in year 2014, Apple's Gross profit ratio was 0.38 which got increased in 2014 to 0.40
and in next two consecutive years, it started decreasing to 0.39 and 0.38 in 2016 and 2017
respectively. It can be articulated that gross profit is reduced in coming years. It had become
Apple
Gross Profit Sales Revenue Gross Profit Margin
Formula Gross Income / Sales Revenue
2017 88186 229234 0.38
2016 84263 215639 0.39
2015 93626 233715 0.4
2014 70537 182795 0.38
Illustration 3: Gross profit margin
Interpretation: The above table is indicating gross profit ratio of both organizations in
systematic manner, which is increasing in context of Samsung but in Apple, there is a decrement
in small proportions.
As in year 2014, Apple's Gross profit ratio was 0.38 which got increased in 2014 to 0.40
and in next two consecutive years, it started decreasing to 0.39 and 0.38 in 2016 and 2017
respectively. It can be articulated that gross profit is reduced in coming years. It had become
⊘ This is a preview!⊘
Do you want full access?
Subscribe today to unlock all pages.
Trusted by 1+ million students worldwide
mandatory for controlling cost of expenditure related to operations in very efficient way which
will be giving impact to raise margin to great height (Apple Financials, 2018).
On its contrary, Samsung Ltd has better earning position due to growing growth profit
margin ratio as in 2014 it was 0.37 which got increased to 0.38 in 2015 and in 2016 and 2017, it
was 0.40 and 0.46 respectively. It is indicating that organization is able to get good quantum of
margin in efficient way and it will be providing gross profit in huge quantity. It can be easily
depicted from this analysis that Samsung Ltd has gained good position because of systematic
control over different expenditure and it will be giving fruitful outcomes (Lam, 2014).
Net Profit Margin
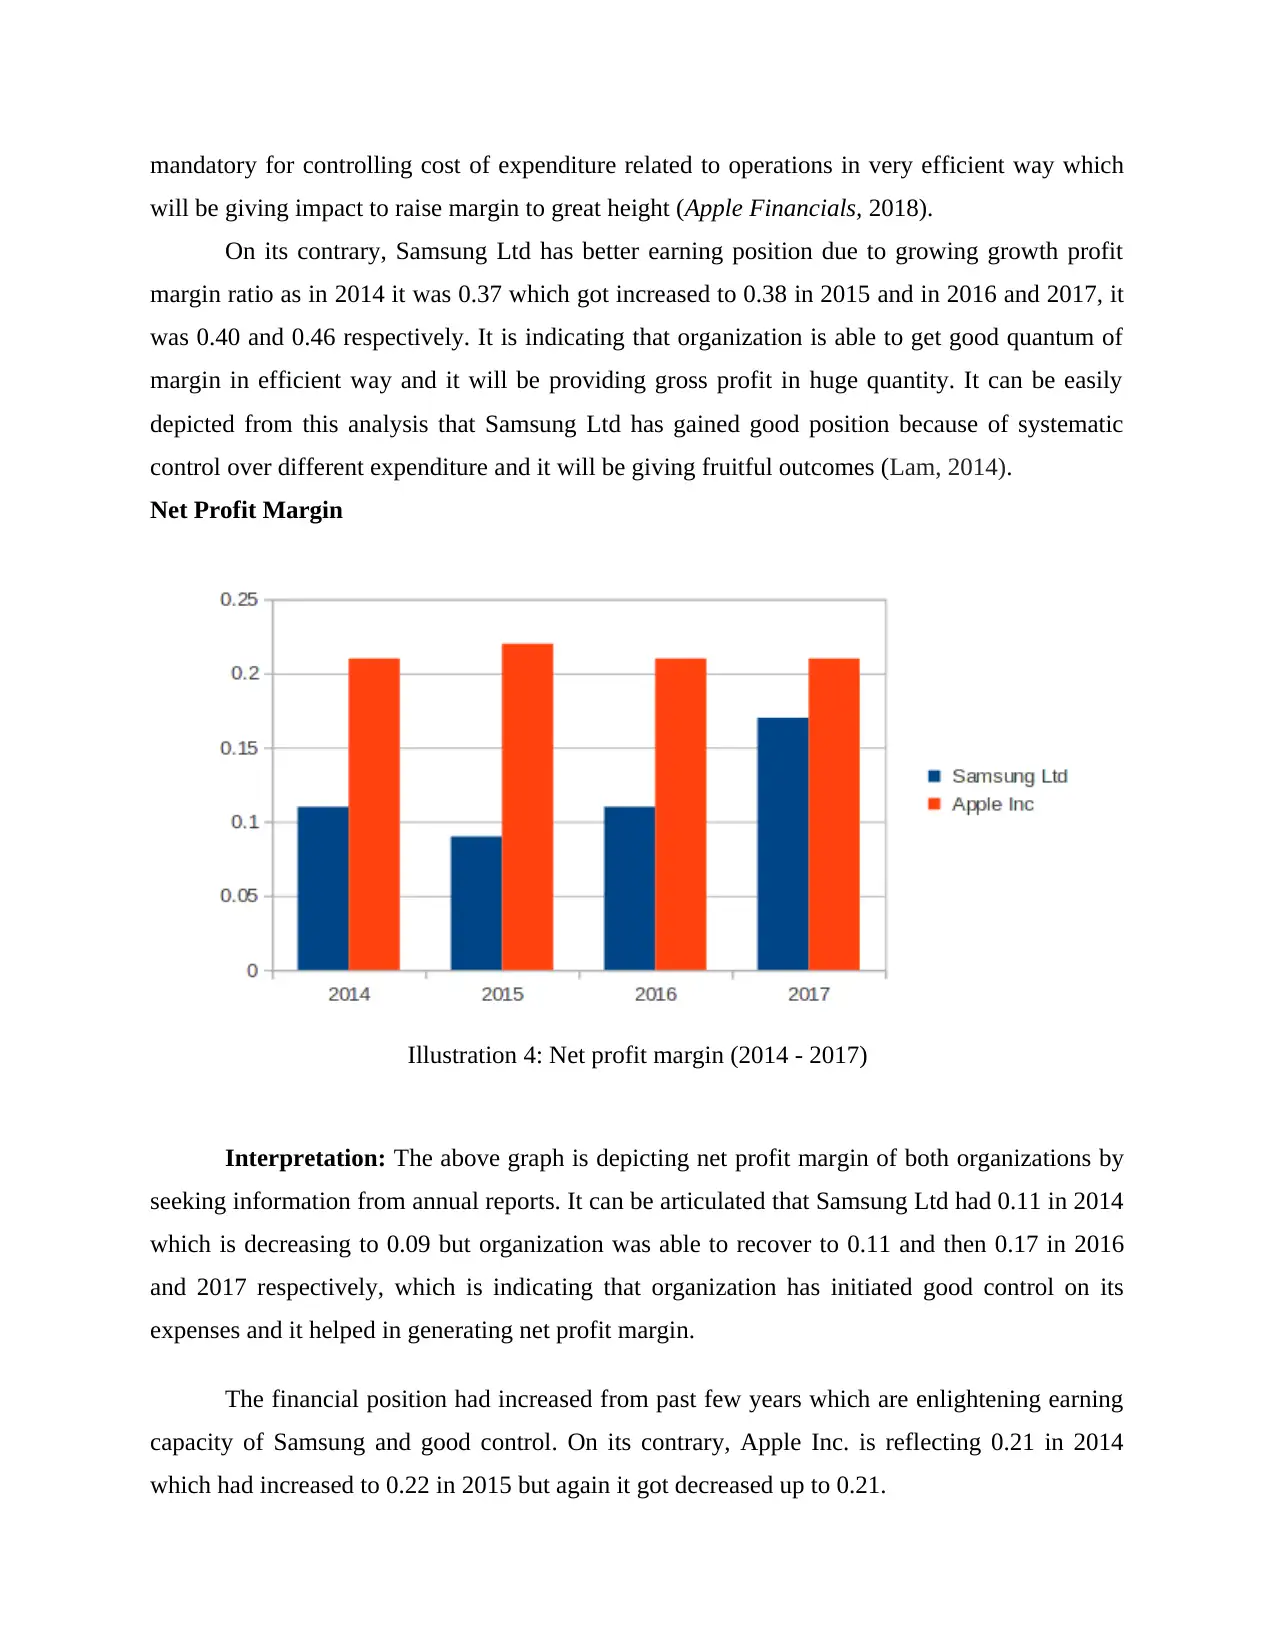
Illustration 4: Net profit margin (2014 - 2017)
Interpretation: The above graph is depicting net profit margin of both organizations by
seeking information from annual reports. It can be articulated that Samsung Ltd had 0.11 in 2014
which is decreasing to 0.09 but organization was able to recover to 0.11 and then 0.17 in 2016
and 2017 respectively, which is indicating that organization has initiated good control on its
expenses and it helped in generating net profit margin.
The financial position had increased from past few years which are enlightening earning
capacity of Samsung and good control. On its contrary, Apple Inc. is reflecting 0.21 in 2014
which had increased to 0.22 in 2015 but again it got decreased up to 0.21.
will be giving impact to raise margin to great height (Apple Financials, 2018).
On its contrary, Samsung Ltd has better earning position due to growing growth profit
margin ratio as in 2014 it was 0.37 which got increased to 0.38 in 2015 and in 2016 and 2017, it
was 0.40 and 0.46 respectively. It is indicating that organization is able to get good quantum of
margin in efficient way and it will be providing gross profit in huge quantity. It can be easily
depicted from this analysis that Samsung Ltd has gained good position because of systematic
control over different expenditure and it will be giving fruitful outcomes (Lam, 2014).
Net Profit Margin
Illustration 4: Net profit margin (2014 - 2017)
Interpretation: The above graph is depicting net profit margin of both organizations by
seeking information from annual reports. It can be articulated that Samsung Ltd had 0.11 in 2014
which is decreasing to 0.09 but organization was able to recover to 0.11 and then 0.17 in 2016
and 2017 respectively, which is indicating that organization has initiated good control on its
expenses and it helped in generating net profit margin.
The financial position had increased from past few years which are enlightening earning
capacity of Samsung and good control. On its contrary, Apple Inc. is reflecting 0.21 in 2014
which had increased to 0.22 in 2015 but again it got decreased up to 0.21.
Paraphrase This Document
Need a fresh take? Get an instant paraphrase of this document with our AI Paraphraser
Further, it can be interpreted that company's gross profit was low as compared to
Samsung but on basis of net profit margin, Apple Inc has increased its net profit from past year.
It can be depicted that better control has been performed over expenses, which are operational or
non-operational, which is leaning towards huge profit margin.
Liquidity ratio
Liquidity is referred as capability of organization for accomplishing its financial
obligations which are due. Its a computation which is applicable for measuring ability of
organization for repaying its short term debts. It is replicated as quickest aspect to know financial
stability of any organization. Under this category, liquid ratio is classified into three categories
such as current, acid and cash ratio. Among these three, current ratio is termed as very liberal
method (Lindeman and et. al., 2016).
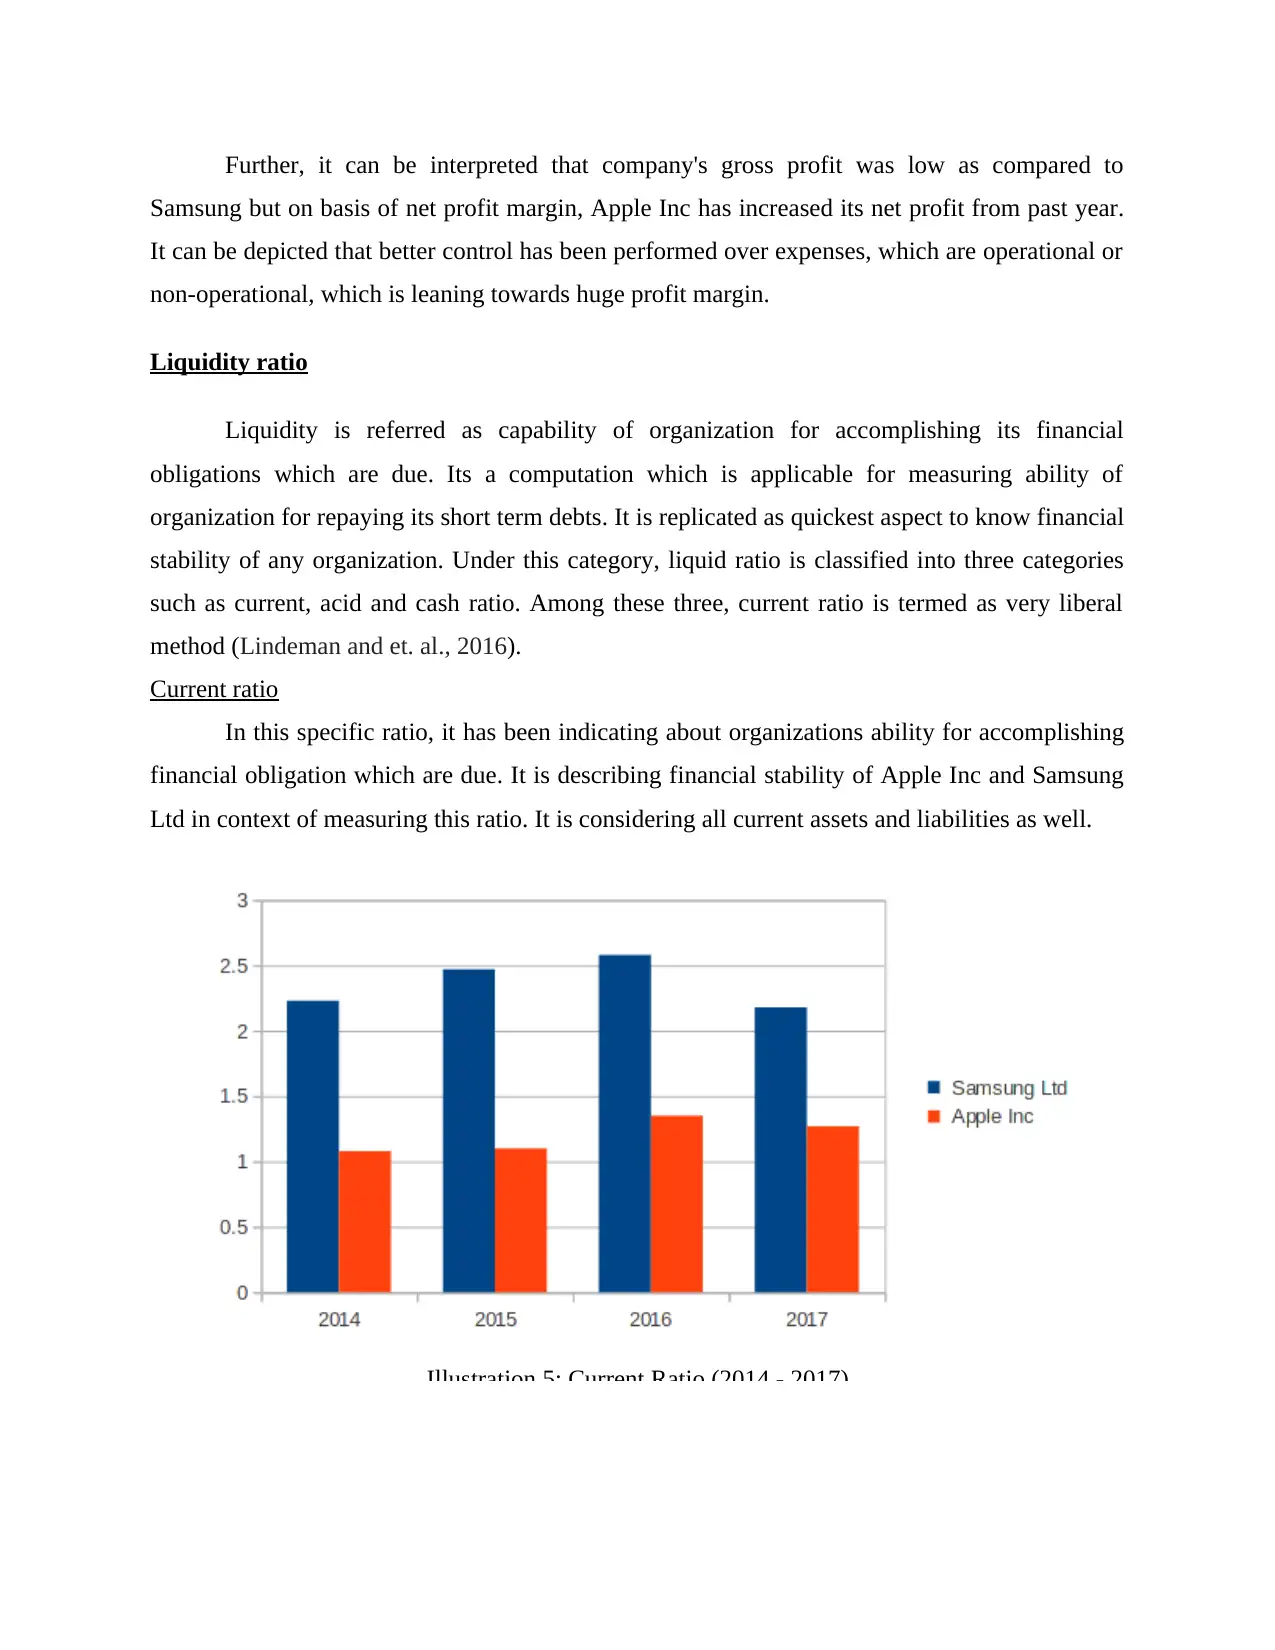
Current ratio
In this specific ratio, it has been indicating about organizations ability for accomplishing
financial obligation which are due. It is describing financial stability of Apple Inc and Samsung
Ltd in context of measuring this ratio. It is considering all current assets and liabilities as well.
Illustration 5: Current Ratio (2014 - 2017)
Samsung but on basis of net profit margin, Apple Inc has increased its net profit from past year.
It can be depicted that better control has been performed over expenses, which are operational or
non-operational, which is leaning towards huge profit margin.
Liquidity ratio
Liquidity is referred as capability of organization for accomplishing its financial
obligations which are due. Its a computation which is applicable for measuring ability of
organization for repaying its short term debts. It is replicated as quickest aspect to know financial
stability of any organization. Under this category, liquid ratio is classified into three categories
such as current, acid and cash ratio. Among these three, current ratio is termed as very liberal
method (Lindeman and et. al., 2016).
Current ratio
In this specific ratio, it has been indicating about organizations ability for accomplishing
financial obligation which are due. It is describing financial stability of Apple Inc and Samsung
Ltd in context of measuring this ratio. It is considering all current assets and liabilities as well.
Illustration 5: Current Ratio (2014 - 2017)
Interpretation: The above table is depicting financial position in context of current assets
and liabilities which is quick measure for tracing liquidity of organization. As per accounting,
idle current ratio should be 2 : 1 and in above scenario, Samsung is depicting current ratio in
various fluctuations but in 2017 it got decrease by huge number as it is meeting industry standard
but in 2014 it was 2.23 then 2.47 in 2015 (increased), 2.58 in 2016 (peak) and in 2017 it was
2.18 which is indicating that its current asset had decreased from previous year along with
optimum utilisation of resources. On its contrary aspect, Apple Inc's current ratio is increasing or
trying to improve but it not meeting standard and it can be indicated that Apple Inc is not having
great liquidity position in context current ratio.
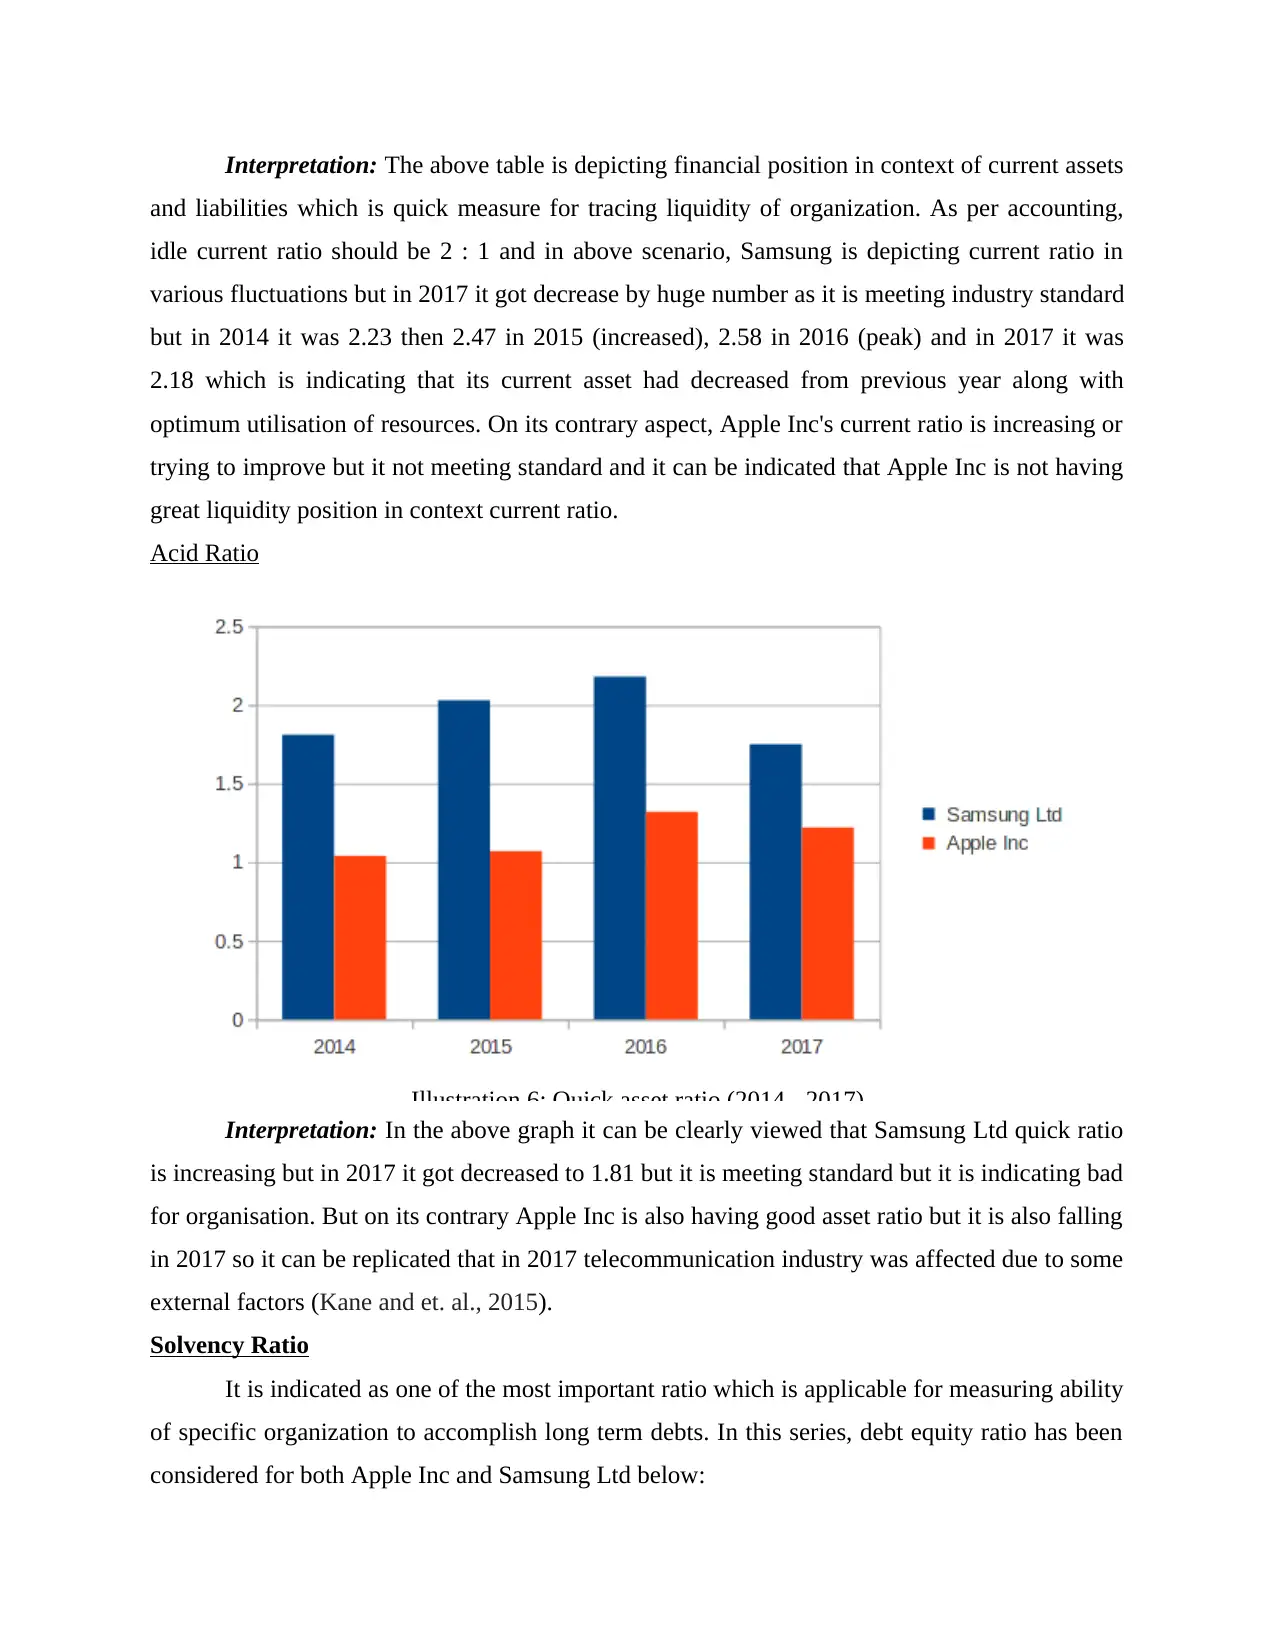
Acid Ratio
Illustration 6: Quick asset ratio (2014 - 2017)
Interpretation: In the above graph it can be clearly viewed that Samsung Ltd quick ratio
is increasing but in 2017 it got decreased to 1.81 but it is meeting standard but it is indicating bad
for organisation. But on its contrary Apple Inc is also having good asset ratio but it is also falling
in 2017 so it can be replicated that in 2017 telecommunication industry was affected due to some
external factors (Kane and et. al., 2015).
Solvency Ratio
It is indicated as one of the most important ratio which is applicable for measuring ability
of specific organization to accomplish long term debts. In this series, debt equity ratio has been
considered for both Apple Inc and Samsung Ltd below:
and liabilities which is quick measure for tracing liquidity of organization. As per accounting,
idle current ratio should be 2 : 1 and in above scenario, Samsung is depicting current ratio in
various fluctuations but in 2017 it got decrease by huge number as it is meeting industry standard
but in 2014 it was 2.23 then 2.47 in 2015 (increased), 2.58 in 2016 (peak) and in 2017 it was
2.18 which is indicating that its current asset had decreased from previous year along with
optimum utilisation of resources. On its contrary aspect, Apple Inc's current ratio is increasing or
trying to improve but it not meeting standard and it can be indicated that Apple Inc is not having
great liquidity position in context current ratio.
Acid Ratio
Illustration 6: Quick asset ratio (2014 - 2017)
Interpretation: In the above graph it can be clearly viewed that Samsung Ltd quick ratio
is increasing but in 2017 it got decreased to 1.81 but it is meeting standard but it is indicating bad
for organisation. But on its contrary Apple Inc is also having good asset ratio but it is also falling
in 2017 so it can be replicated that in 2017 telecommunication industry was affected due to some
external factors (Kane and et. al., 2015).
Solvency Ratio
It is indicated as one of the most important ratio which is applicable for measuring ability
of specific organization to accomplish long term debts. In this series, debt equity ratio has been
considered for both Apple Inc and Samsung Ltd below:
⊘ This is a preview!⊘
Do you want full access?
Subscribe today to unlock all pages.
Trusted by 1+ million students worldwide
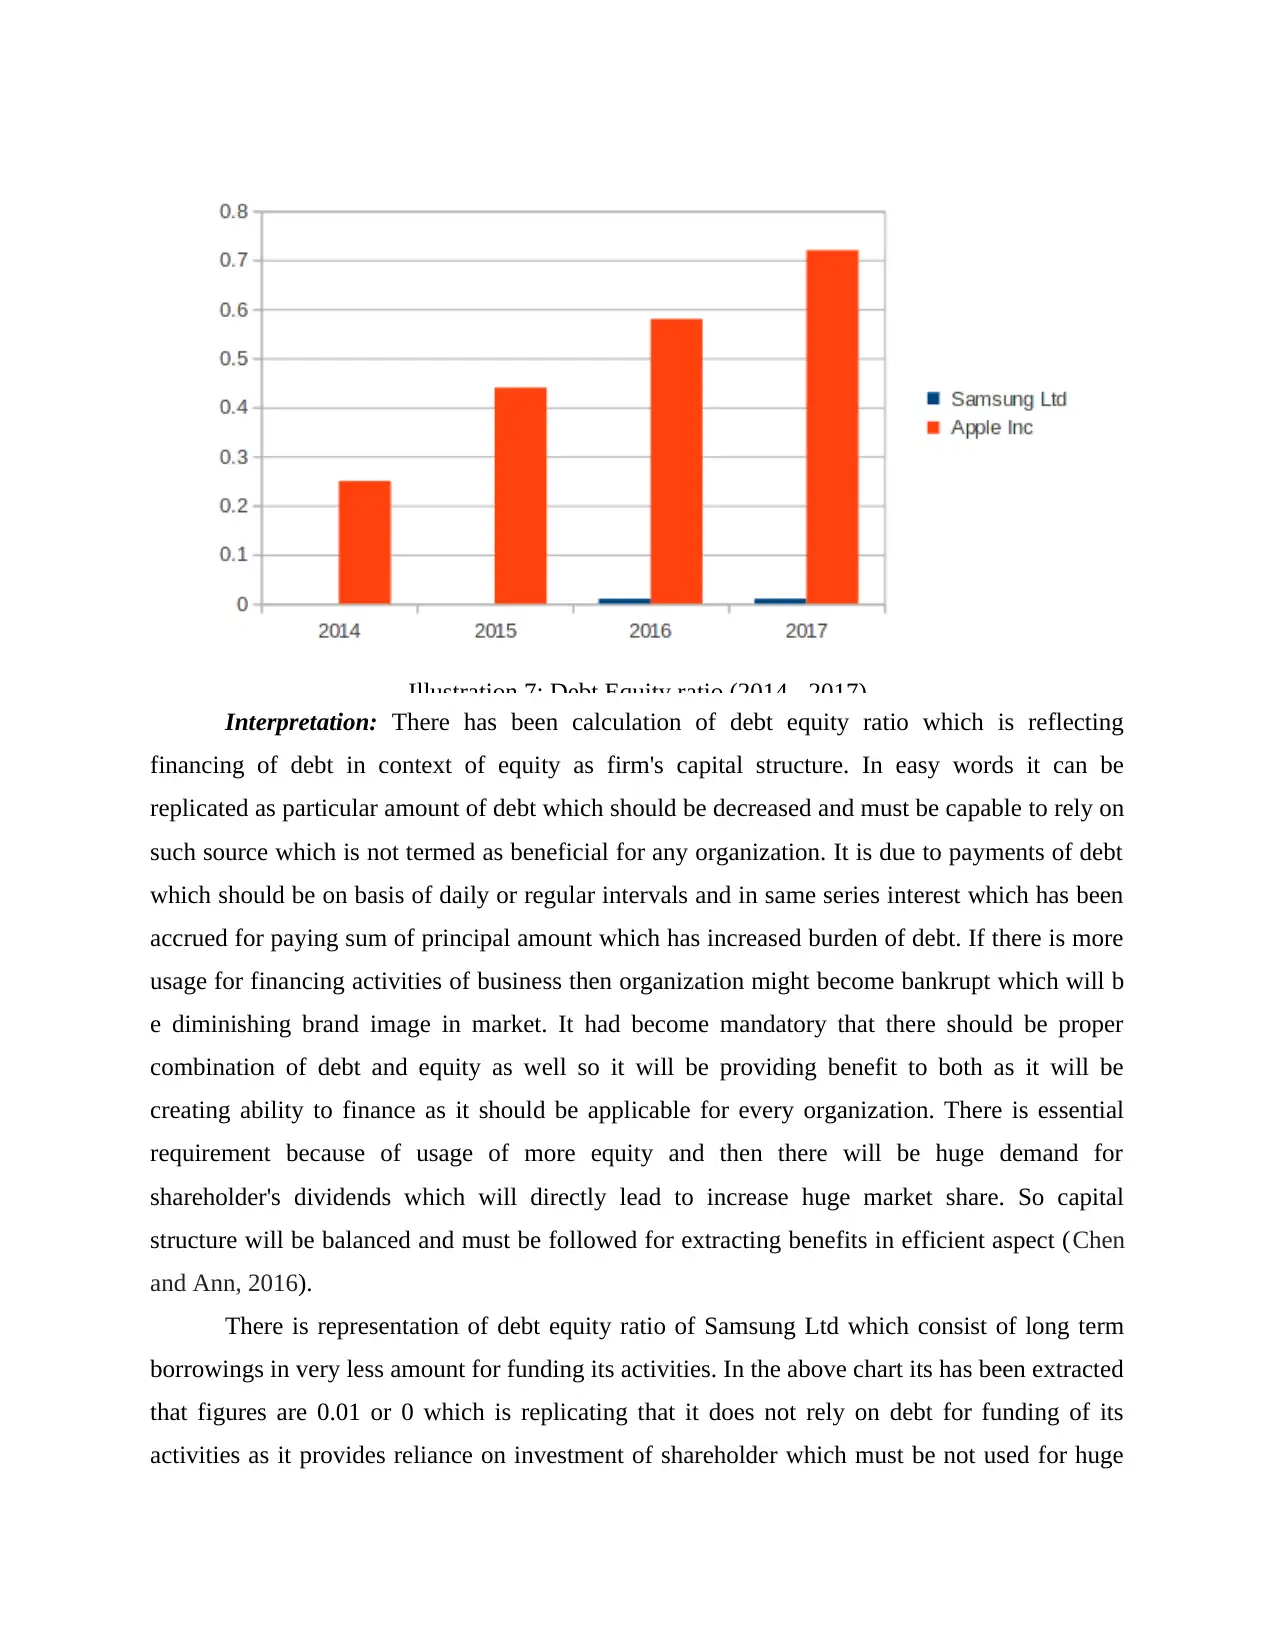
Illustration 7: Debt Equity ratio (2014 - 2017)
Interpretation: There has been calculation of debt equity ratio which is reflecting
financing of debt in context of equity as firm's capital structure. In easy words it can be
replicated as particular amount of debt which should be decreased and must be capable to rely on
such source which is not termed as beneficial for any organization. It is due to payments of debt
which should be on basis of daily or regular intervals and in same series interest which has been
accrued for paying sum of principal amount which has increased burden of debt. If there is more
usage for financing activities of business then organization might become bankrupt which will b
e diminishing brand image in market. It had become mandatory that there should be proper
combination of debt and equity as well so it will be providing benefit to both as it will be
creating ability to finance as it should be applicable for every organization. There is essential
requirement because of usage of more equity and then there will be huge demand for
shareholder's dividends which will directly lead to increase huge market share. So capital
structure will be balanced and must be followed for extracting benefits in efficient aspect (Chen
and Ann, 2016).
There is representation of debt equity ratio of Samsung Ltd which consist of long term
borrowings in very less amount for funding its activities. In the above chart its has been extracted
that figures are 0.01 or 0 which is replicating that it does not rely on debt for funding of its
activities as it provides reliance on investment of shareholder which must be not used for huge
Paraphrase This Document
Need a fresh take? Get an instant paraphrase of this document with our AI Paraphraser
extent. In debt equity ratio, its ideal amount is 40% (0.40) debt and 60% (0.60) equity. For the
purpose of capital structure debt should be low as compared to equity. On its contrary, Apple had
increased its debt from year 2014 which is of 0.25 and it increased in 2015 to 0.44, 0.58 in 2016
and 0.72 in 2017. It has been replicated that Apple has to reduce burden of debt as it must be
under 0.4 according to idle ratio.
Efficiency ratio
Inventory Turnover ratio
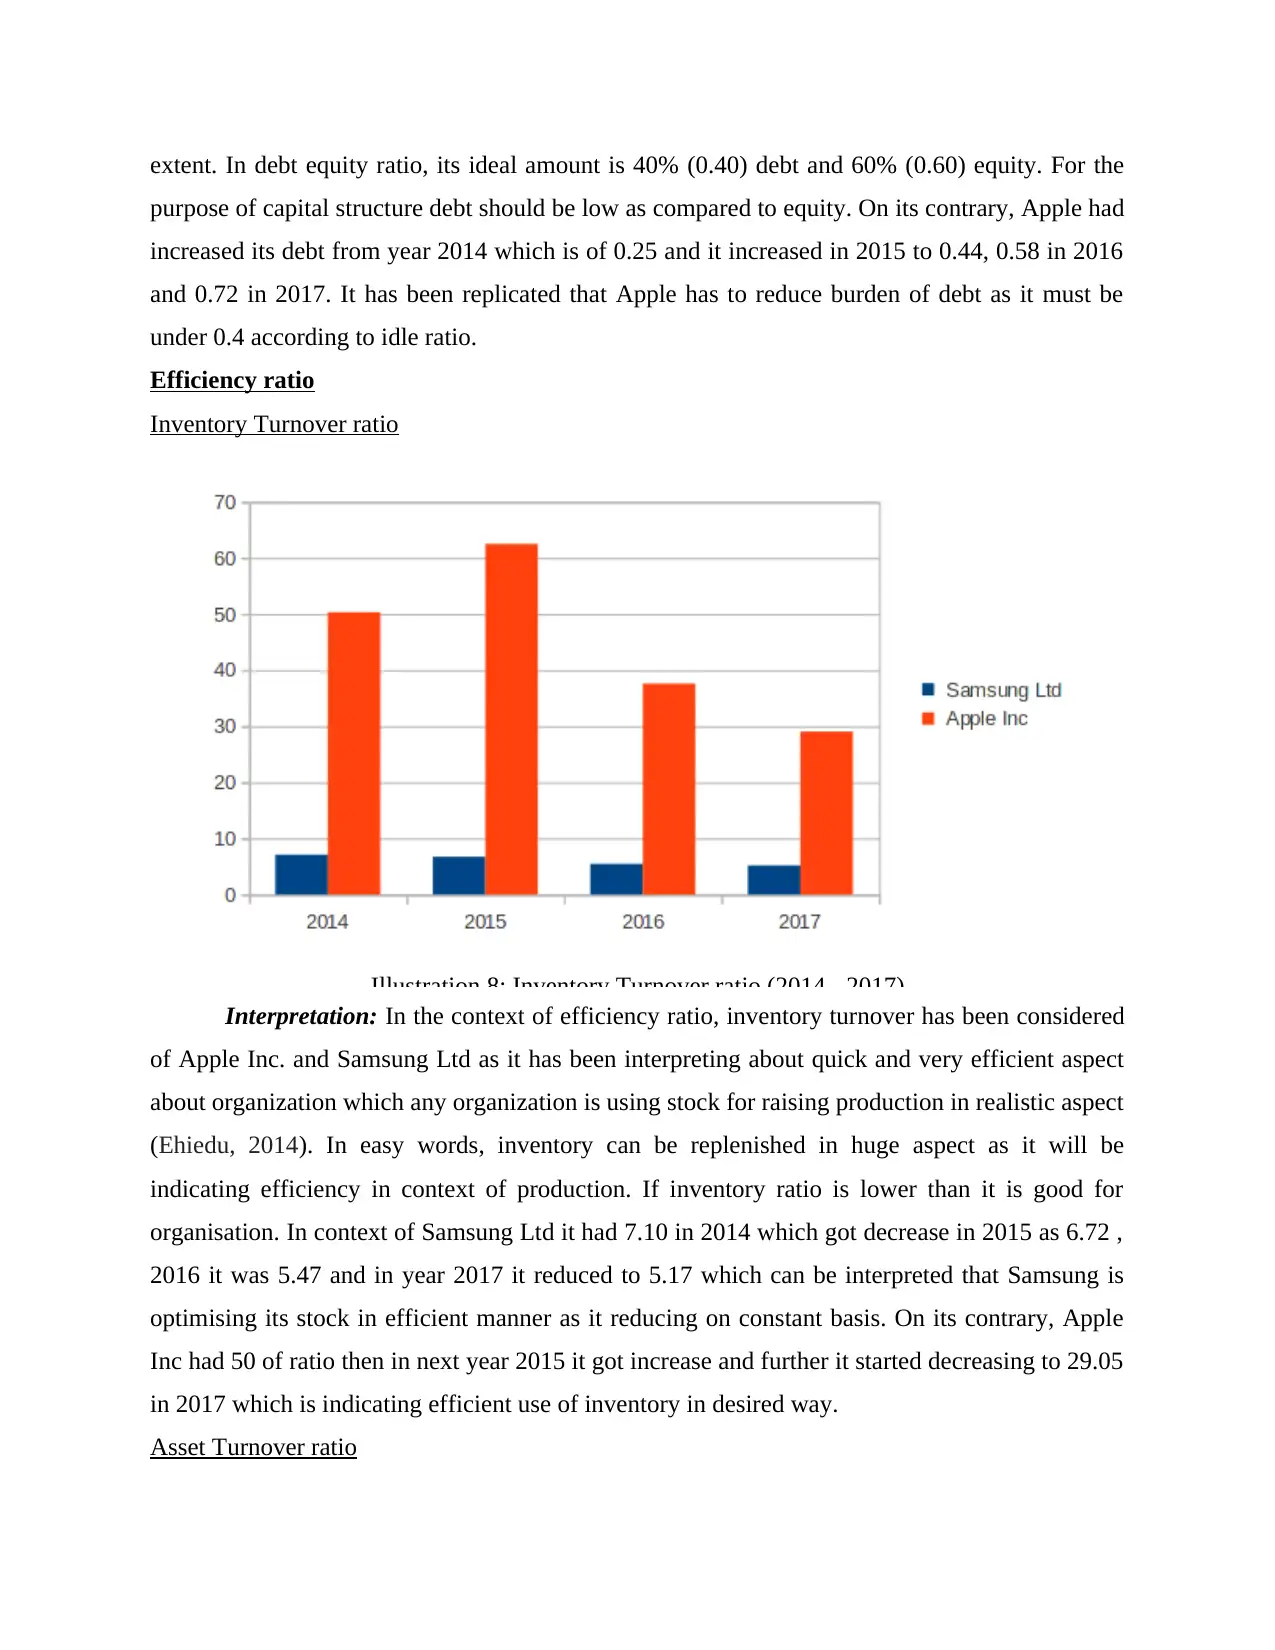
Illustration 8: Inventory Turnover ratio (2014 - 2017)
Interpretation: In the context of efficiency ratio, inventory turnover has been considered
of Apple Inc. and Samsung Ltd as it has been interpreting about quick and very efficient aspect
about organization which any organization is using stock for raising production in realistic aspect
(Ehiedu, 2014). In easy words, inventory can be replenished in huge aspect as it will be
indicating efficiency in context of production. If inventory ratio is lower than it is good for
organisation. In context of Samsung Ltd it had 7.10 in 2014 which got decrease in 2015 as 6.72 ,
2016 it was 5.47 and in year 2017 it reduced to 5.17 which can be interpreted that Samsung is
optimising its stock in efficient manner as it reducing on constant basis. On its contrary, Apple
Inc had 50 of ratio then in next year 2015 it got increase and further it started decreasing to 29.05
in 2017 which is indicating efficient use of inventory in desired way.
Asset Turnover ratio
purpose of capital structure debt should be low as compared to equity. On its contrary, Apple had
increased its debt from year 2014 which is of 0.25 and it increased in 2015 to 0.44, 0.58 in 2016
and 0.72 in 2017. It has been replicated that Apple has to reduce burden of debt as it must be
under 0.4 according to idle ratio.
Efficiency ratio
Inventory Turnover ratio
Illustration 8: Inventory Turnover ratio (2014 - 2017)
Interpretation: In the context of efficiency ratio, inventory turnover has been considered
of Apple Inc. and Samsung Ltd as it has been interpreting about quick and very efficient aspect
about organization which any organization is using stock for raising production in realistic aspect
(Ehiedu, 2014). In easy words, inventory can be replenished in huge aspect as it will be
indicating efficiency in context of production. If inventory ratio is lower than it is good for
organisation. In context of Samsung Ltd it had 7.10 in 2014 which got decrease in 2015 as 6.72 ,
2016 it was 5.47 and in year 2017 it reduced to 5.17 which can be interpreted that Samsung is
optimising its stock in efficient manner as it reducing on constant basis. On its contrary, Apple
Inc had 50 of ratio then in next year 2015 it got increase and further it started decreasing to 29.05
in 2017 which is indicating efficient use of inventory in desired way.
Asset Turnover ratio
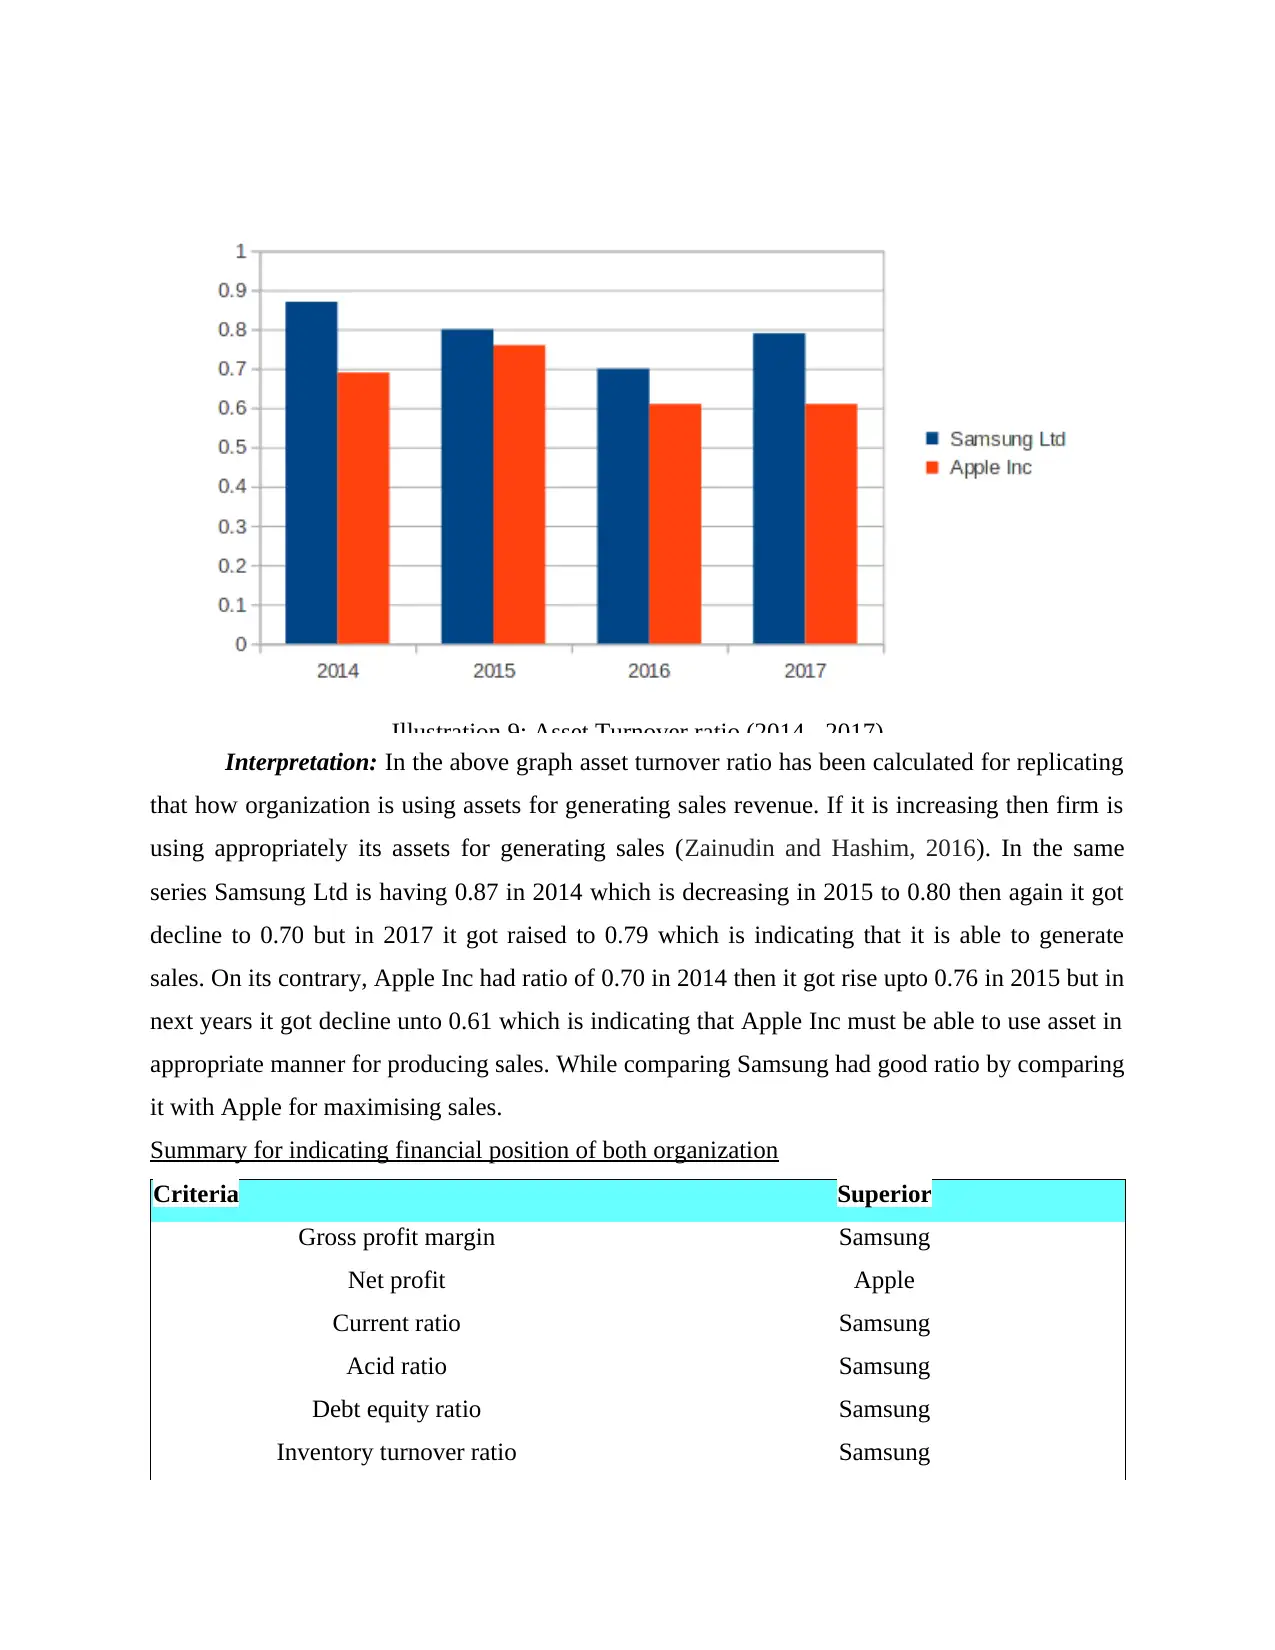
Illustration 9: Asset Turnover ratio (2014 - 2017)
Interpretation: In the above graph asset turnover ratio has been calculated for replicating
that how organization is using assets for generating sales revenue. If it is increasing then firm is
using appropriately its assets for generating sales (Zainudin and Hashim, 2016). In the same
series Samsung Ltd is having 0.87 in 2014 which is decreasing in 2015 to 0.80 then again it got
decline to 0.70 but in 2017 it got raised to 0.79 which is indicating that it is able to generate
sales. On its contrary, Apple Inc had ratio of 0.70 in 2014 then it got rise upto 0.76 in 2015 but in
next years it got decline unto 0.61 which is indicating that Apple Inc must be able to use asset in
appropriate manner for producing sales. While comparing Samsung had good ratio by comparing
it with Apple for maximising sales.
Summary for indicating financial position of both organization
Criteria Superior
Gross profit margin Samsung
Net profit Apple
Current ratio Samsung
Acid ratio Samsung
Debt equity ratio Samsung
Inventory turnover ratio Samsung
⊘ This is a preview!⊘
Do you want full access?
Subscribe today to unlock all pages.
Trusted by 1+ million students worldwide
1 out of 18
Related Documents


Your All-in-One AI-Powered Toolkit for Academic Success.
+13062052269
info@desklib.com
Available 24*7 on WhatsApp / Email
![[object Object]](/_next/static/media/star-bottom.7253800d.svg)
Unlock your academic potential
Copyright © 2020–2026 A2Z Services. All Rights Reserved. Developed and managed by ZUCOL.