Financial Strength and Weakness Analysis: Apple Inc. vs. Samsung Ltd.
VerifiedAdded on 2021/01/02
|19
|3773
|441
Report
AI Summary
This report provides a comprehensive financial analysis of Apple Inc. and Samsung Ltd., focusing on their financial performance from 2014 to 2017. The analysis includes an examination of profitability, liquidity, solvency, and efficiency ratios, along with interpretations to determine the financial strengths and weaknesses of each company. The report also justifies the Corporate Social Responsibility (CSR) sections of both organizations. The financial ratios such as Gross Profit Margin, Net Profit Margin, Current Ratio, Acid Test Ratio, Debt Equity Ratio, and Inventory Turnover Ratio are discussed to evaluate the companies' performance. The report highlights the fluctuations and impacts of these ratios, providing insights into the companies' financial health and operational efficiency. It concludes with recommendations based on the findings, offering a comparative overview of the two technology giants.
FINANCIAL
ANALYSIS
MANAGEMENT &
ENTERPRISE
ANALYSIS
MANAGEMENT &
ENTERPRISE
Paraphrase This Document
Need a fresh take? Get an instant paraphrase of this document with our AI Paraphraser
TABLE OF CONTENTS
INTRODUCTION...........................................................................................................................3
Analysing Financial strength and weakness...............................................................................3
Justifying CSR section of Apple Inc and Samsung Ltd from last two year with its findings...14
CONCLUSION..............................................................................................................................16
REFERENCES..............................................................................................................................18
INTRODUCTION
For each enterprise, financial analysis is very essential aspect for knowing its position in
its industry or for identifying improvements. The present report is giving brief discussion about
two technology giants of industry which are Samsung Ltd and Apple Inc. on basis of profitability
and liquidity as well. It had also provided brief discussion on basis of critical awareness of
business with specific comprehension along with its prospects on context of future. Further it had
also analysed both organization's financial performance by various measures such as solvency,
liquidity, efficiency and probability along with its appropriate interpretation. From these measure
It had determined financial strength and weakness of both organization with its
recommendations. In the same series, this report had justified various CSR sections of both
organizations.
Analysing Financial strength and weakness
Samsung Ltd and Apple Inc. both are known as largest manufacturers in world in context
of smart phones. These both are considered as technology giants for smartphones which are sold
half of worldwide. In the past year, various measures were adopted for cutting consumption of
energy. Generally, organization had ensured for using 100% clean energy with reference to all
renewable sources throughout world in every production plant. Apple Inc. had gained ability for
reducing consumption of power through its product by 40% which is directly indicated as
commitment for being the most efficient organization with context of energy in world. On its
contrary, different measures were also adopted by Samsung Ltd for ensuring about efficient
utilization of resources. It includes appropriate system of energy management in each plant as it
optimises facilities of high efficiency and it also organises training program for educating
employees on basis of proper use of energy in every production sites through the world.
Samsung Ltd had also implemented program of internal management which is named as Pre-
certification of Energy efficiency (Walla and Schweiger, 2017).
In the present scenario, Both the organization Samsung Ltd and Apple Inc. had gained
reputation as very innovative in industry of smartphone. From many years, Apple Inc. has
dominated this specific market which has been directly overtaken by Samsung in context of
number of units which has been sold. In the series by adopting practices and policy which are
⊘ This is a preview!⊘
Do you want full access?
Subscribe today to unlock all pages.
Trusted by 1+ million students worldwide
adopted by Apple and has gained this specific reputation. While adopting these power efficient
production and environmental friendly policies Apple Inc. is at this specific position. Samsung
Ltd had also earned position on basis of products and policies which are innovative for ensuring
about green environment. The initiatives such as using clean energy has objective of promoting
green energy which is known as main attraction to various consumers for Samsung Ltd.
In the year 2018, flagship of Samsung Ltd had been lost because of inefficiency of
ephemeral compelling reasons and dullness in fundamentals. Moreover, Samsung Ltd had high
brand image which is neglecting everything and it is well known and everyone's first choice. It is
purely committed for increasing its global community level. It provides various attractive
innovations which is directly enhancing everybody's daily life. The world has been inspired by
shaping future with various technologies which are transformative along with ideas. It gives
power to people for framing experience in very innovative aspect such as memory, wearable
device, smartphones and digital appliances. The mobile communication and other significant
applications for third party digital content had been manufactured, designed and marketed by
Apple Inc. Its operations are on basis of selling and providing appropriate digital content and
various applications through iTunes store.
Paraphrase This Document
Need a fresh take? Get an instant paraphrase of this document with our AI Paraphraser
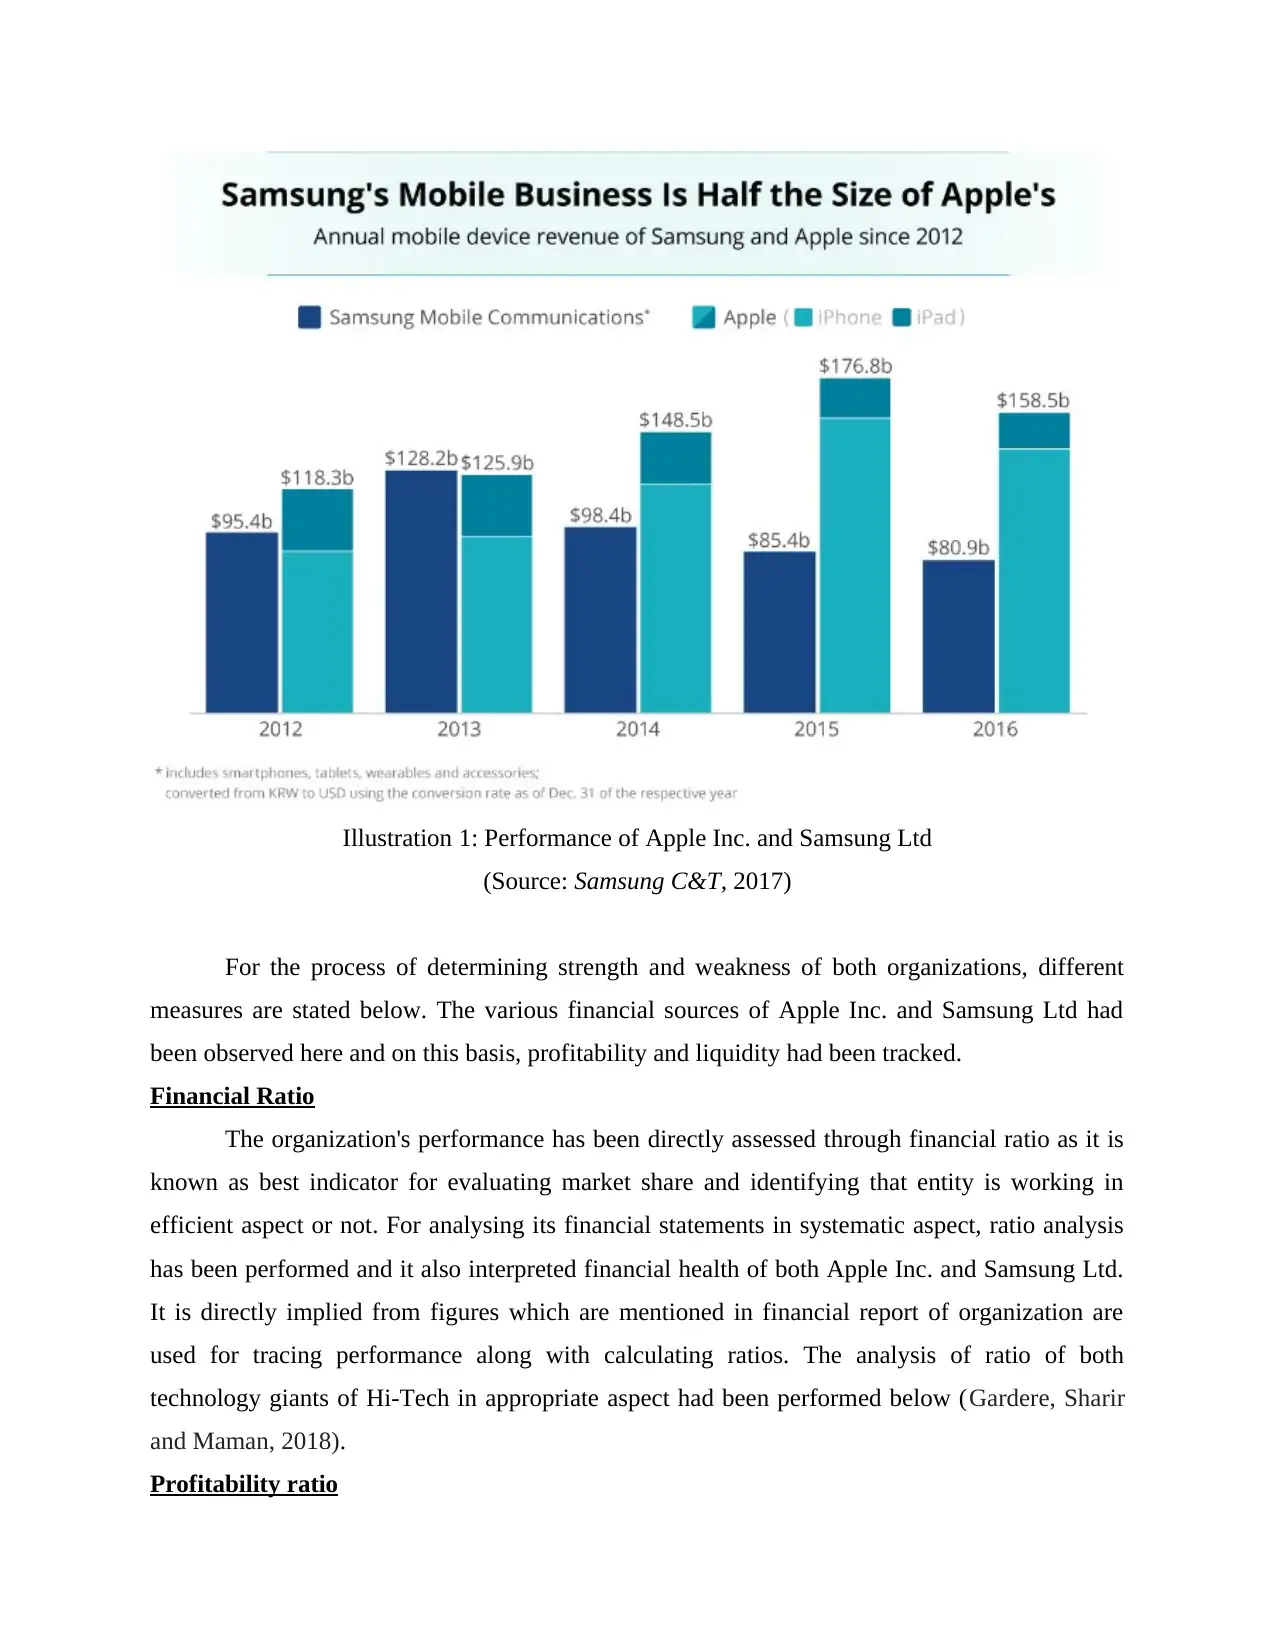
Illustration 1: Performance of Apple Inc. and Samsung Ltd
(Source: Samsung C&T, 2017)
For the process of determining strength and weakness of both organizations, different
measures are stated below. The various financial sources of Apple Inc. and Samsung Ltd had
been observed here and on this basis, profitability and liquidity had been tracked.
Financial Ratio
The organization's performance has been directly assessed through financial ratio as it is
known as best indicator for evaluating market share and identifying that entity is working in
efficient aspect or not. For analysing its financial statements in systematic aspect, ratio analysis
has been performed and it also interpreted financial health of both Apple Inc. and Samsung Ltd.
It is directly implied from figures which are mentioned in financial report of organization are
used for tracing performance along with calculating ratios. The analysis of ratio of both
technology giants of Hi-Tech in appropriate aspect had been performed below (Gardere, Sharir
and Maman, 2018).
Profitability ratio
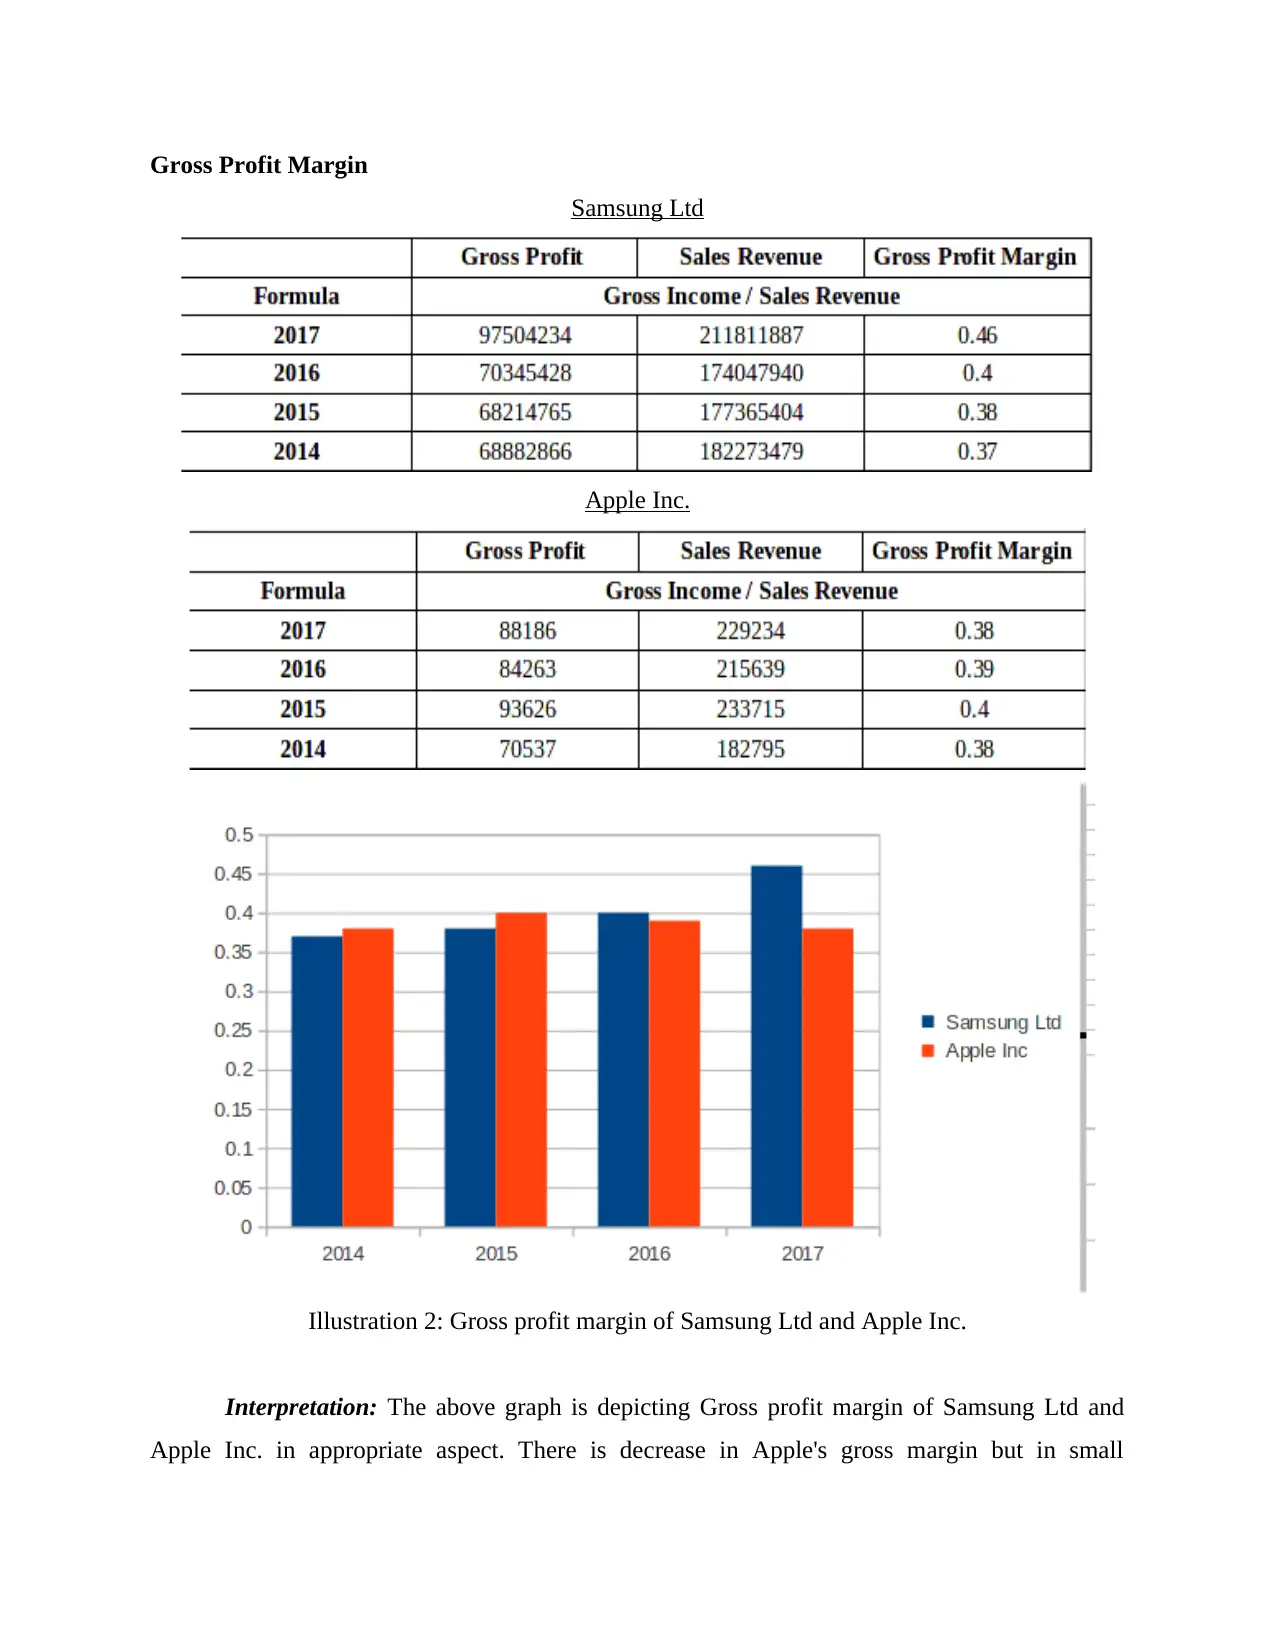
Gross Profit Margin
Samsung Ltd
Apple Inc.
Illustration 2: Gross profit margin of Samsung Ltd and Apple Inc.
Interpretation: The above graph is depicting Gross profit margin of Samsung Ltd and
Apple Inc. in appropriate aspect. There is decrease in Apple's gross margin but in small
Samsung Ltd
Apple Inc.
Illustration 2: Gross profit margin of Samsung Ltd and Apple Inc.
Interpretation: The above graph is depicting Gross profit margin of Samsung Ltd and
Apple Inc. in appropriate aspect. There is decrease in Apple's gross margin but in small
⊘ This is a preview!⊘
Do you want full access?
Subscribe today to unlock all pages.
Trusted by 1+ million students worldwide
proportions and Samsung Ltd had huge alteration in positive view. In the year 2014, Gross
margin of Apple Inc. was 0.38 which got raised by 0.2 in year 2015. But from that year, it started
decreasing in 2016 and 2017 to 0.39 and 0.38 respectively. From these specified figures of Apple
Inc., it could be interpreted that in coming years, its gross margin is decreasing. For this
decrement Apple Inc. should be capable for controlling its expenditure cost with context of
operations in effective way as it will be affecting profitability of organization in distinct aspect.
Samsung Ltd had achieved good earning position due to increment in gross margin. From
year 2014 to 2017 it had many ups and down as 0.37 was in year 2014 which got increased to
0.38 which is increasing in both consecutive year 2016 and 2017 as well to 0.40 and 0.46
respectively. It could be interpreted that Samsung Ltd had gained capability for achieving margin
in effective aspect as it would be delivering gross margin in huge amount. From the above
picture, it can be easily viewed that Samsung Ltd had achieved great position in its specific
industry due to appropriate control on its expenditure cost so it will be providing outcome which
is fruitful to organization itself (Zhang, 2017).
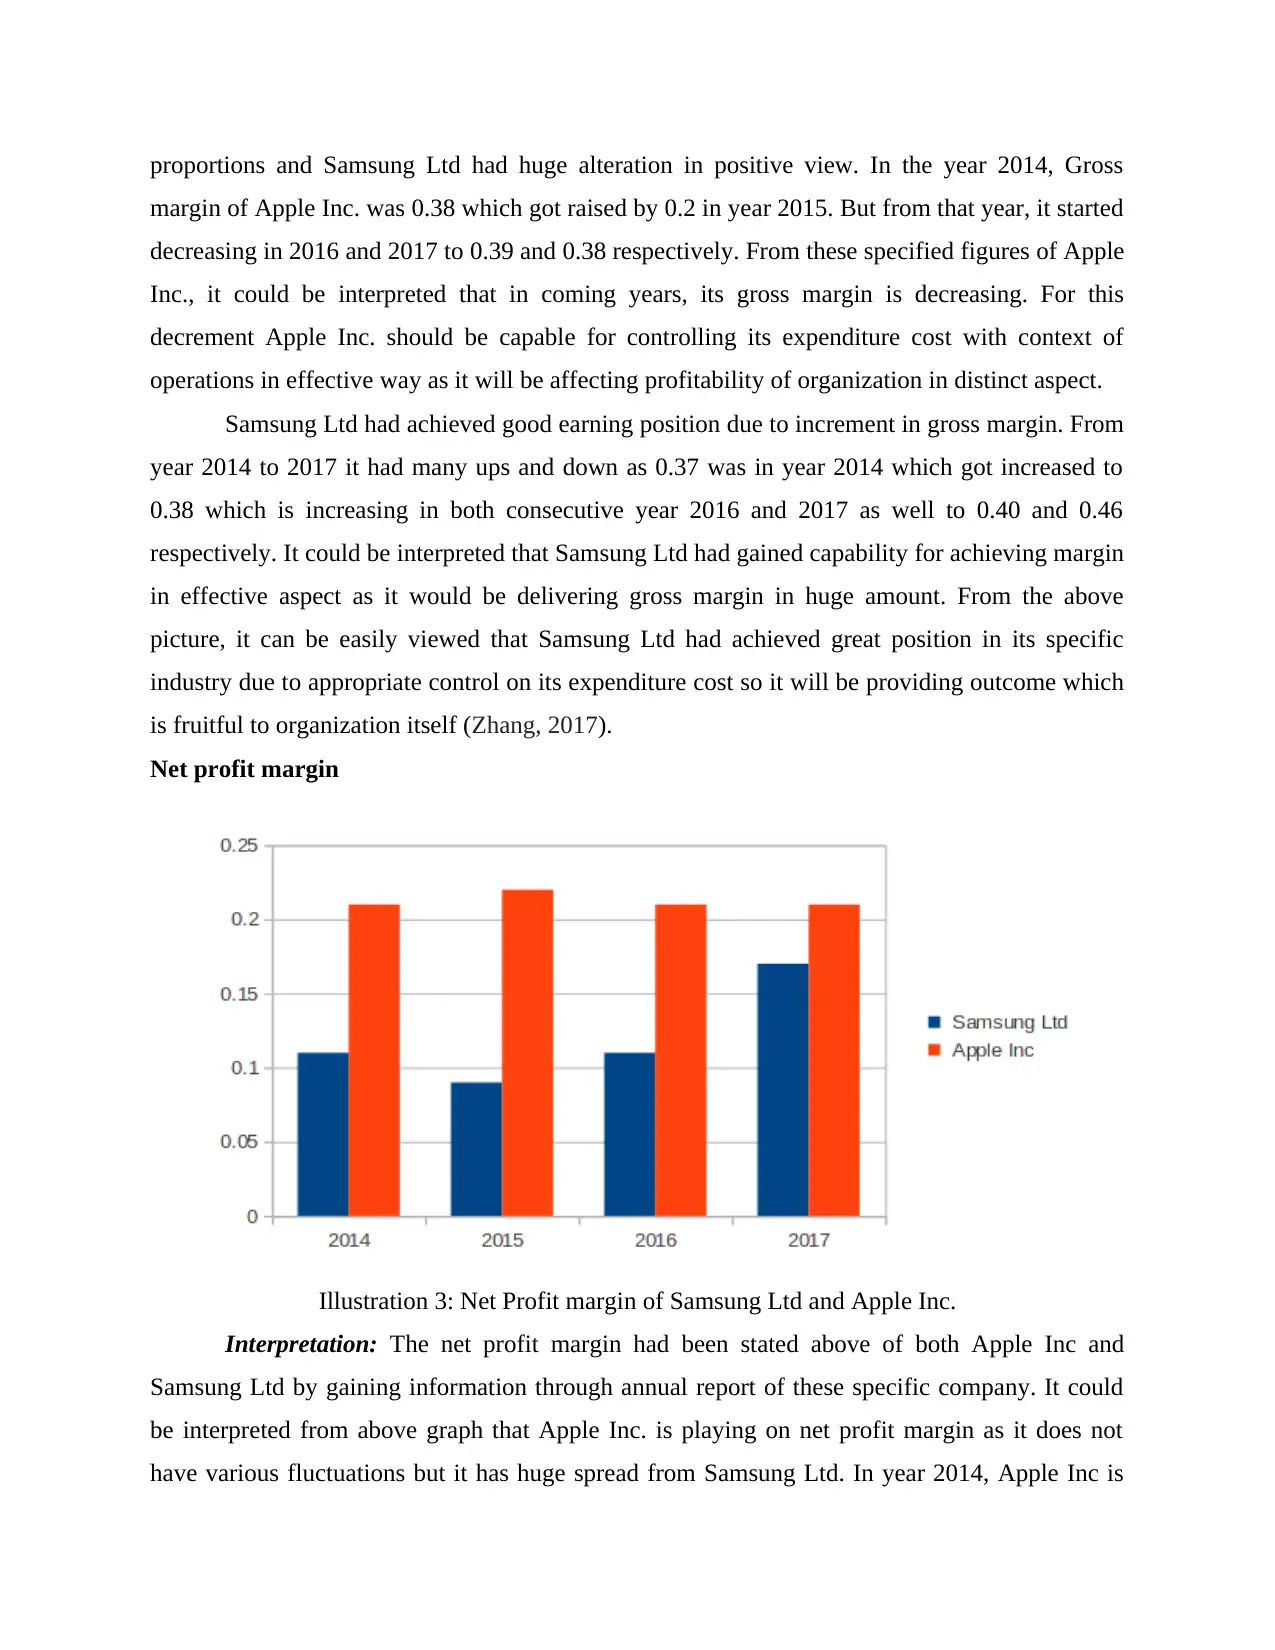
Net profit margin
Illustration 3: Net Profit margin of Samsung Ltd and Apple Inc.
Interpretation: The net profit margin had been stated above of both Apple Inc and
Samsung Ltd by gaining information through annual report of these specific company. It could
be interpreted from above graph that Apple Inc. is playing on net profit margin as it does not
have various fluctuations but it has huge spread from Samsung Ltd. In year 2014, Apple Inc is
margin of Apple Inc. was 0.38 which got raised by 0.2 in year 2015. But from that year, it started
decreasing in 2016 and 2017 to 0.39 and 0.38 respectively. From these specified figures of Apple
Inc., it could be interpreted that in coming years, its gross margin is decreasing. For this
decrement Apple Inc. should be capable for controlling its expenditure cost with context of
operations in effective way as it will be affecting profitability of organization in distinct aspect.
Samsung Ltd had achieved good earning position due to increment in gross margin. From
year 2014 to 2017 it had many ups and down as 0.37 was in year 2014 which got increased to
0.38 which is increasing in both consecutive year 2016 and 2017 as well to 0.40 and 0.46
respectively. It could be interpreted that Samsung Ltd had gained capability for achieving margin
in effective aspect as it would be delivering gross margin in huge amount. From the above
picture, it can be easily viewed that Samsung Ltd had achieved great position in its specific
industry due to appropriate control on its expenditure cost so it will be providing outcome which
is fruitful to organization itself (Zhang, 2017).
Net profit margin
Illustration 3: Net Profit margin of Samsung Ltd and Apple Inc.
Interpretation: The net profit margin had been stated above of both Apple Inc and
Samsung Ltd by gaining information through annual report of these specific company. It could
be interpreted from above graph that Apple Inc. is playing on net profit margin as it does not
have various fluctuations but it has huge spread from Samsung Ltd. In year 2014, Apple Inc is
Paraphrase This Document
Need a fresh take? Get an instant paraphrase of this document with our AI Paraphraser
giving net profit margin of 0.21 which had raised in 2015 to 0.22 but in two consecutive year it
remained stable to 0.21. On its contrary, Samsung Ltd had net profit in 2014 as 0.11 as it is
falling to 0.09 but in next two consecutive year it was capable for recover it to 0.11 and 0.17 in
2017. It could be interpreted that, Samsung Ltd had attained control for its expenses and net
margin was generated (Girardin, 2017).
Profitability ratio Huge Fluctuations Superior Impact
Gross profit margin Samsung Ltd Samsung Ltd
Net profit margin Samsung Ltd Apple Inc.
Interpretation: From the above, profitability analysis, it could be analysed that Samsung
Ltd had huge fluctuations, but it had given positive impact as compared to Apple Inc. On the
contrary aspect, due to huge operating cost Samsung Ltd is not capable to achieve good net profit
margin as Apple Inc. had performed good control on its expenditure cost which depicted huge
net profit margin.
Liquidity Ratio
It is replicated as organization's capability for attaining its various due financial
obligations. Its applicability is for tracking organization's ability to repay its debt of short term. It
is considered as quick aspect for tracking financial ability of specific entity. The liquidity can be
measured by observing current and quick ratio which are termed as very liberal.
Current Ratio
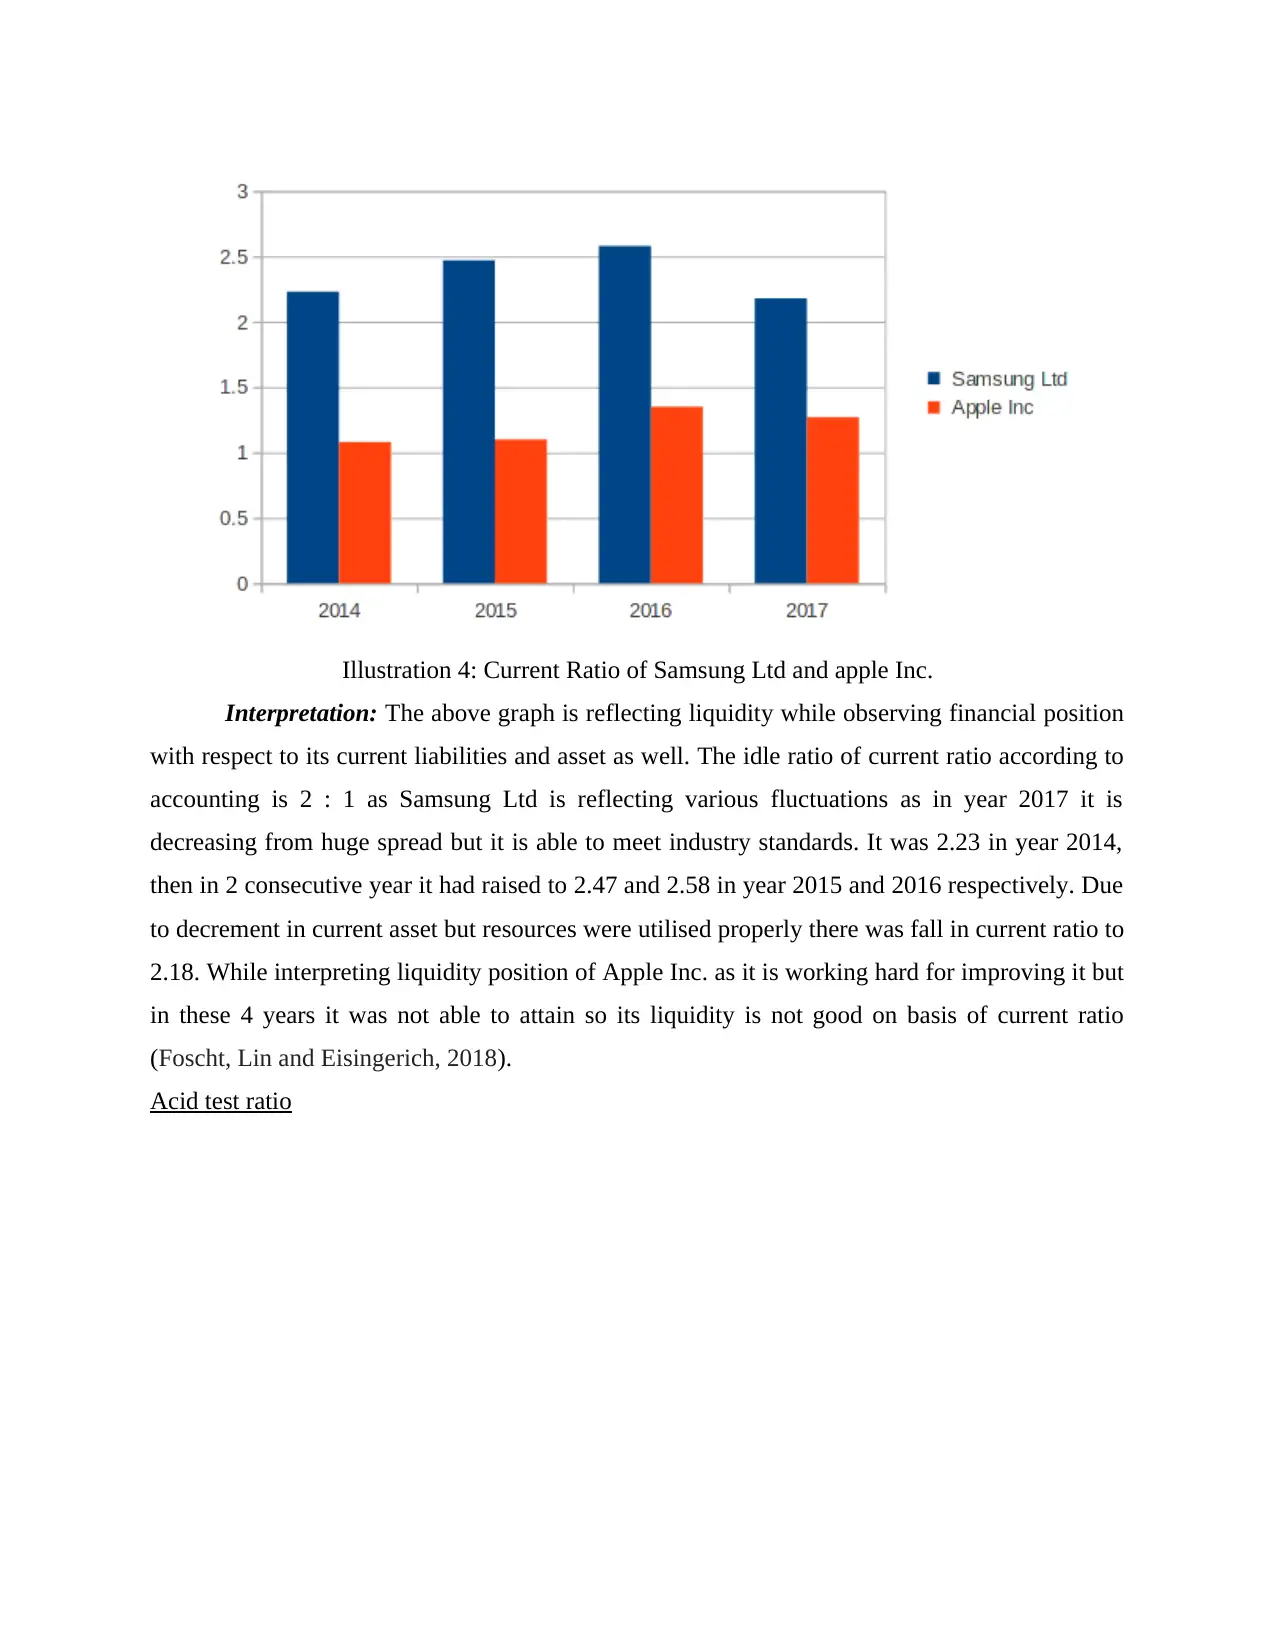
Illustration 4: Current Ratio of Samsung Ltd and apple Inc.
Interpretation: The above graph is reflecting liquidity while observing financial position
with respect to its current liabilities and asset as well. The idle ratio of current ratio according to
accounting is 2 : 1 as Samsung Ltd is reflecting various fluctuations as in year 2017 it is
decreasing from huge spread but it is able to meet industry standards. It was 2.23 in year 2014,
then in 2 consecutive year it had raised to 2.47 and 2.58 in year 2015 and 2016 respectively. Due
to decrement in current asset but resources were utilised properly there was fall in current ratio to
2.18. While interpreting liquidity position of Apple Inc. as it is working hard for improving it but
in these 4 years it was not able to attain so its liquidity is not good on basis of current ratio
(Foscht, Lin and Eisingerich, 2018).
Acid test ratio
⊘ This is a preview!⊘
Do you want full access?
Subscribe today to unlock all pages.
Trusted by 1+ million students worldwide
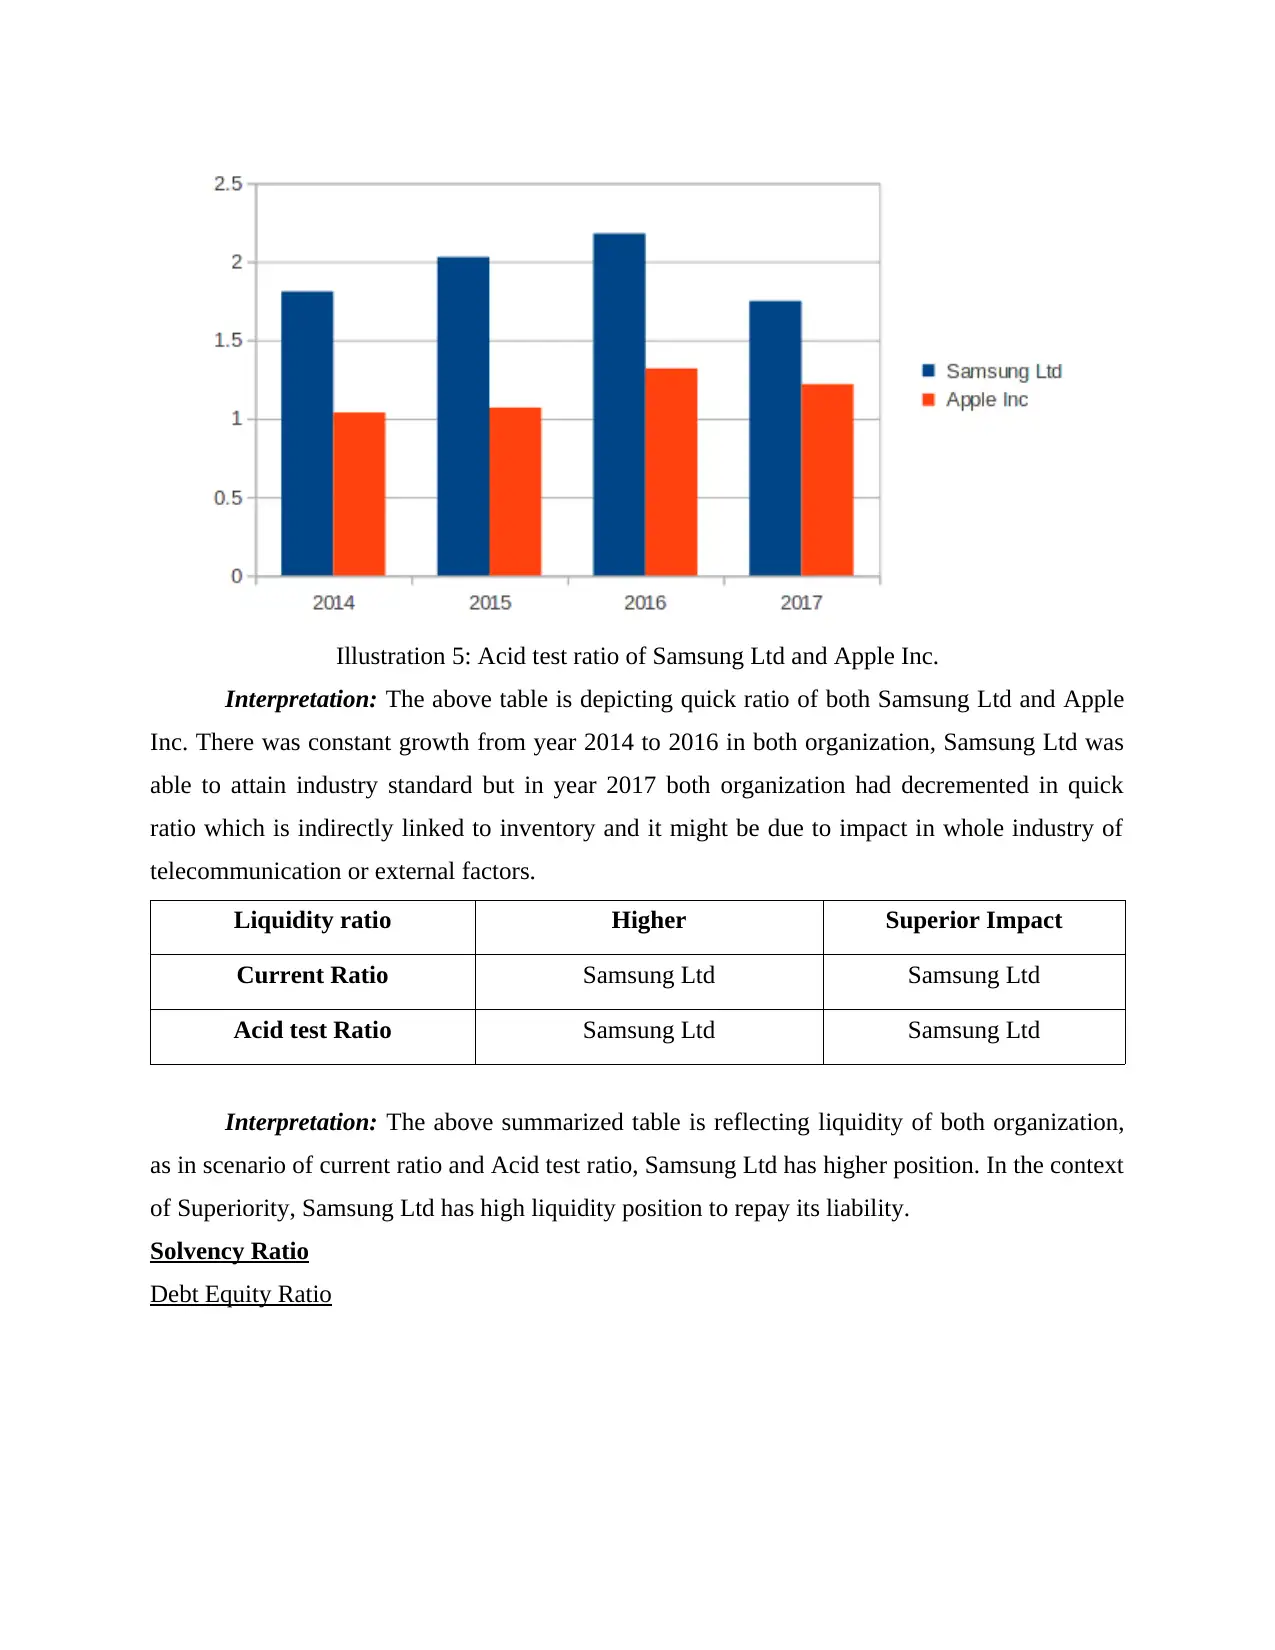
Illustration 5: Acid test ratio of Samsung Ltd and Apple Inc.
Interpretation: The above table is depicting quick ratio of both Samsung Ltd and Apple
Inc. There was constant growth from year 2014 to 2016 in both organization, Samsung Ltd was
able to attain industry standard but in year 2017 both organization had decremented in quick
ratio which is indirectly linked to inventory and it might be due to impact in whole industry of
telecommunication or external factors.
Liquidity ratio Higher Superior Impact
Current Ratio Samsung Ltd Samsung Ltd
Acid test Ratio Samsung Ltd Samsung Ltd
Interpretation: The above summarized table is reflecting liquidity of both organization,
as in scenario of current ratio and Acid test ratio, Samsung Ltd has higher position. In the context
of Superiority, Samsung Ltd has high liquidity position to repay its liability.
Solvency Ratio
Debt Equity Ratio
Paraphrase This Document
Need a fresh take? Get an instant paraphrase of this document with our AI Paraphraser
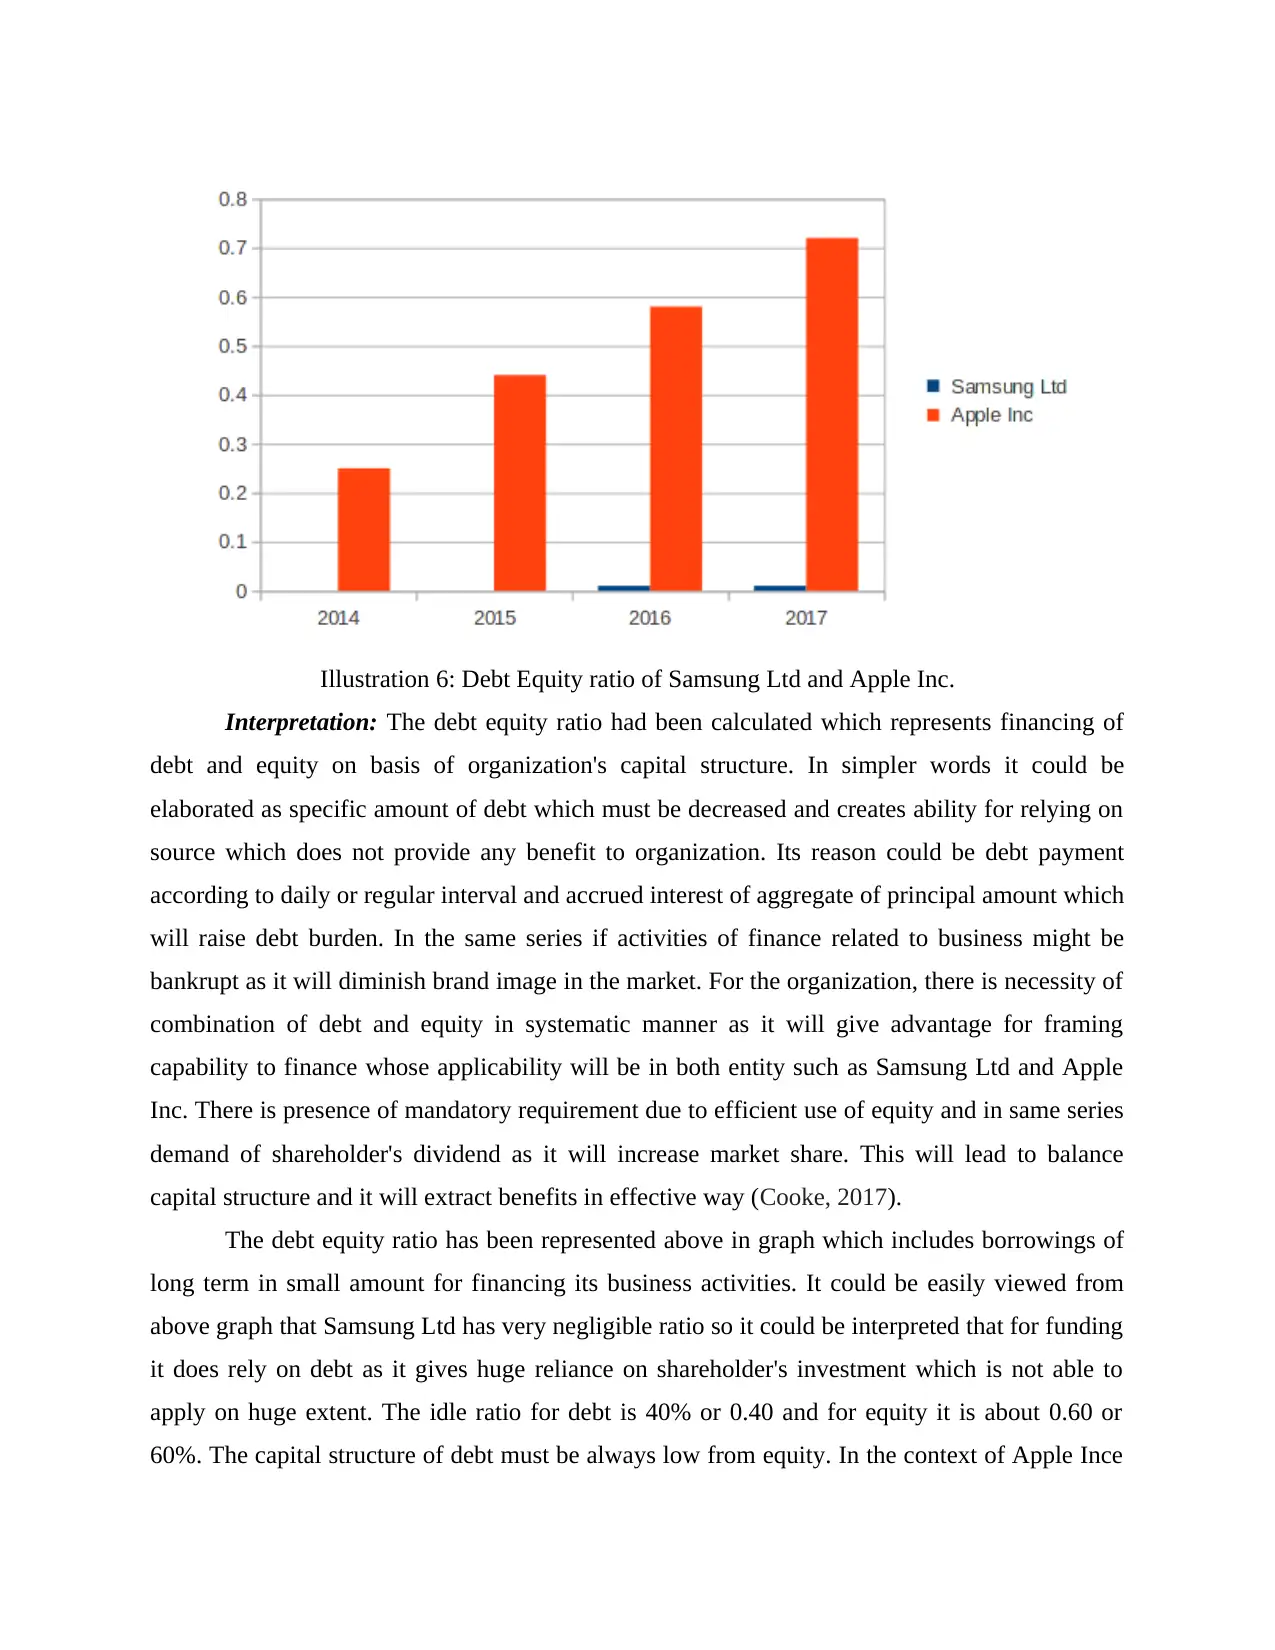
Illustration 6: Debt Equity ratio of Samsung Ltd and Apple Inc.
Interpretation: The debt equity ratio had been calculated which represents financing of
debt and equity on basis of organization's capital structure. In simpler words it could be
elaborated as specific amount of debt which must be decreased and creates ability for relying on
source which does not provide any benefit to organization. Its reason could be debt payment
according to daily or regular interval and accrued interest of aggregate of principal amount which
will raise debt burden. In the same series if activities of finance related to business might be
bankrupt as it will diminish brand image in the market. For the organization, there is necessity of
combination of debt and equity in systematic manner as it will give advantage for framing
capability to finance whose applicability will be in both entity such as Samsung Ltd and Apple
Inc. There is presence of mandatory requirement due to efficient use of equity and in same series
demand of shareholder's dividend as it will increase market share. This will lead to balance
capital structure and it will extract benefits in effective way (Cooke, 2017).
The debt equity ratio has been represented above in graph which includes borrowings of
long term in small amount for financing its business activities. It could be easily viewed from
above graph that Samsung Ltd has very negligible ratio so it could be interpreted that for funding
it does rely on debt as it gives huge reliance on shareholder's investment which is not able to
apply on huge extent. The idle ratio for debt is 40% or 0.40 and for equity it is about 0.60 or
60%. The capital structure of debt must be always low from equity. In the context of Apple Ince
its debt is increasing from year to year as in 2014 it was 0.25 which raised in 2015 as 0.44 and in
year 2016 and 2017 it is 0.58 and 0.72 respectively. It could be interpreted that Apple Inc. must
be able to decrease debt burden as it should be under 0.4 as per idle ratio.
Efficiency Ratio
Inventory Turnover ratio
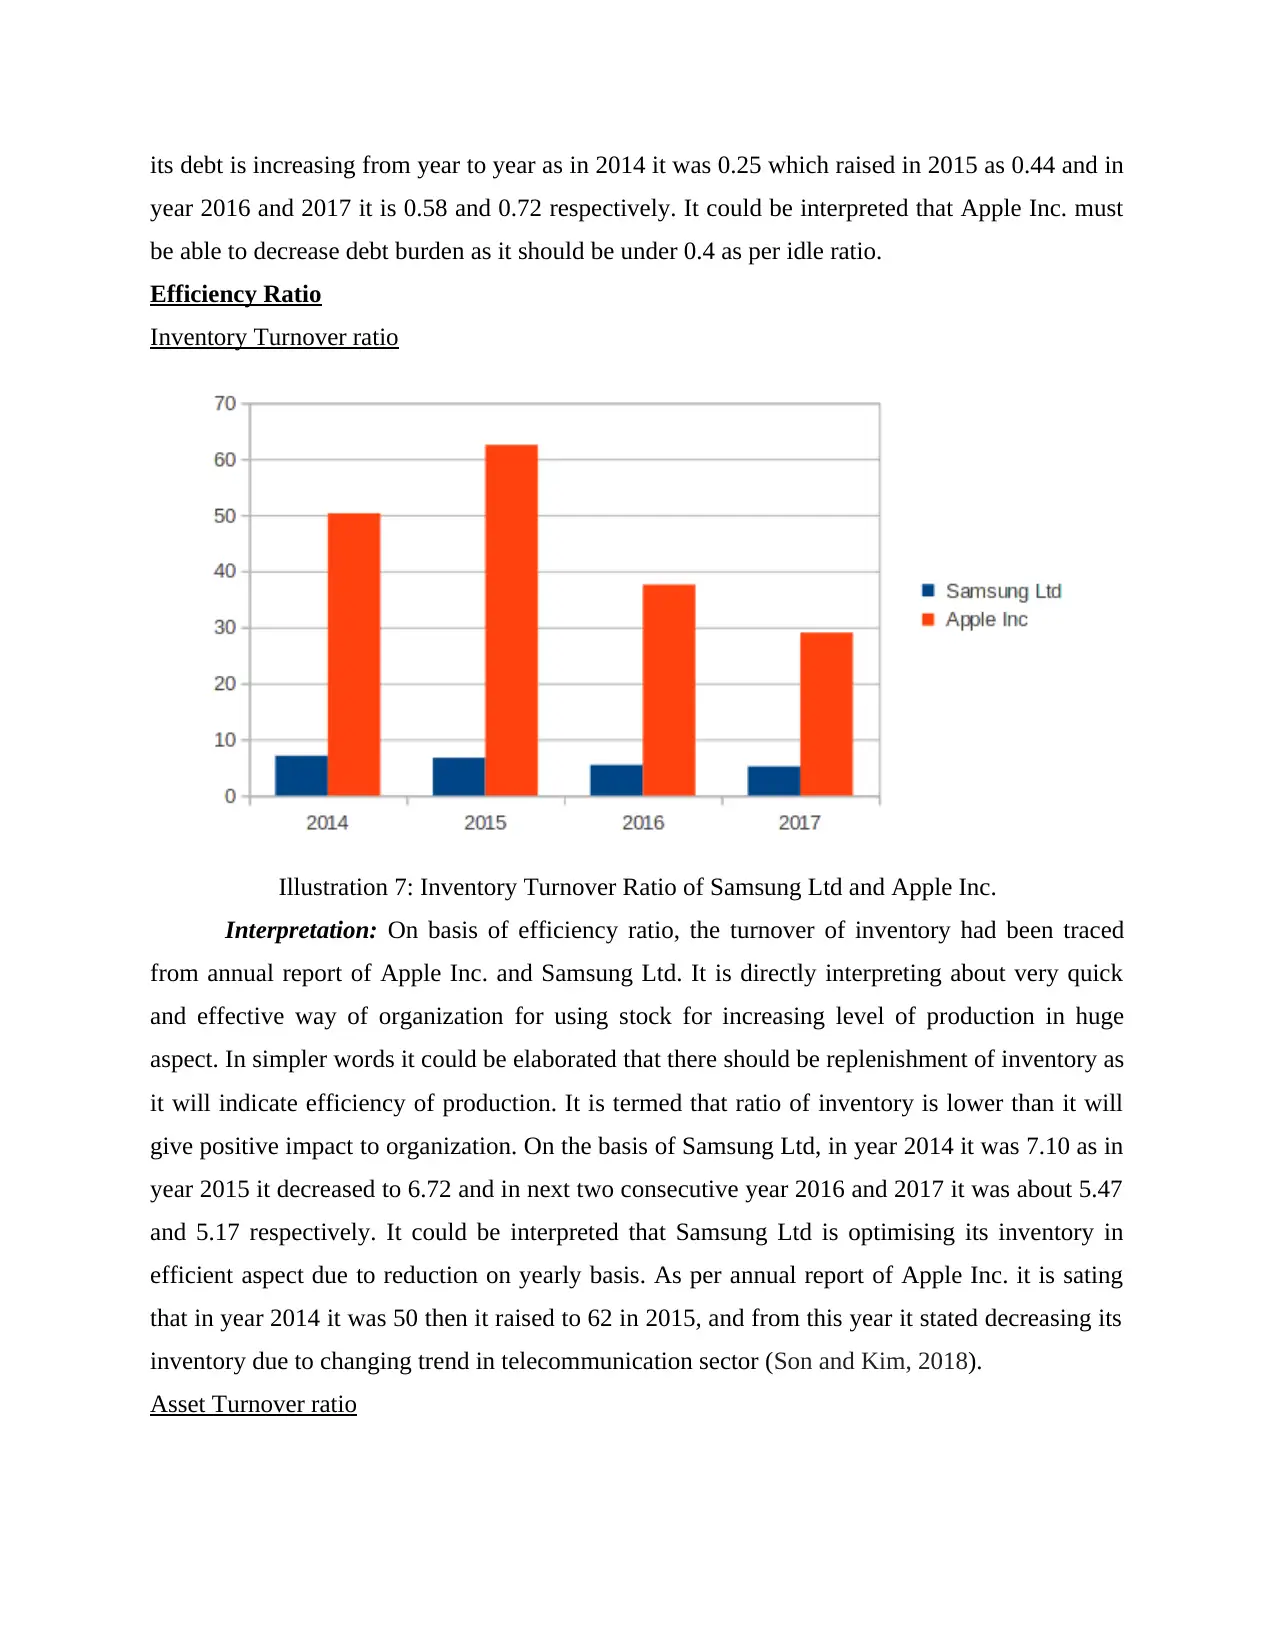
Illustration 7: Inventory Turnover Ratio of Samsung Ltd and Apple Inc.
Interpretation: On basis of efficiency ratio, the turnover of inventory had been traced
from annual report of Apple Inc. and Samsung Ltd. It is directly interpreting about very quick
and effective way of organization for using stock for increasing level of production in huge
aspect. In simpler words it could be elaborated that there should be replenishment of inventory as
it will indicate efficiency of production. It is termed that ratio of inventory is lower than it will
give positive impact to organization. On the basis of Samsung Ltd, in year 2014 it was 7.10 as in
year 2015 it decreased to 6.72 and in next two consecutive year 2016 and 2017 it was about 5.47
and 5.17 respectively. It could be interpreted that Samsung Ltd is optimising its inventory in
efficient aspect due to reduction on yearly basis. As per annual report of Apple Inc. it is sating
that in year 2014 it was 50 then it raised to 62 in 2015, and from this year it stated decreasing its
inventory due to changing trend in telecommunication sector (Son and Kim, 2018).
Asset Turnover ratio
year 2016 and 2017 it is 0.58 and 0.72 respectively. It could be interpreted that Apple Inc. must
be able to decrease debt burden as it should be under 0.4 as per idle ratio.
Efficiency Ratio
Inventory Turnover ratio
Illustration 7: Inventory Turnover Ratio of Samsung Ltd and Apple Inc.
Interpretation: On basis of efficiency ratio, the turnover of inventory had been traced
from annual report of Apple Inc. and Samsung Ltd. It is directly interpreting about very quick
and effective way of organization for using stock for increasing level of production in huge
aspect. In simpler words it could be elaborated that there should be replenishment of inventory as
it will indicate efficiency of production. It is termed that ratio of inventory is lower than it will
give positive impact to organization. On the basis of Samsung Ltd, in year 2014 it was 7.10 as in
year 2015 it decreased to 6.72 and in next two consecutive year 2016 and 2017 it was about 5.47
and 5.17 respectively. It could be interpreted that Samsung Ltd is optimising its inventory in
efficient aspect due to reduction on yearly basis. As per annual report of Apple Inc. it is sating
that in year 2014 it was 50 then it raised to 62 in 2015, and from this year it stated decreasing its
inventory due to changing trend in telecommunication sector (Son and Kim, 2018).
Asset Turnover ratio
⊘ This is a preview!⊘
Do you want full access?
Subscribe today to unlock all pages.
Trusted by 1+ million students worldwide
1 out of 19
Related Documents


Your All-in-One AI-Powered Toolkit for Academic Success.
+13062052269
info@desklib.com
Available 24*7 on WhatsApp / Email
![[object Object]](/_next/static/media/star-bottom.7253800d.svg)
Unlock your academic potential
Copyright © 2020–2026 A2Z Services. All Rights Reserved. Developed and managed by ZUCOL.