Financial Performance Analysis Report: Apple and Samsung Comparison
VerifiedAdded on 2020/10/22
|18
|1325
|176
Report
AI Summary
This report provides a financial analysis of Apple and Samsung, two leading companies in the electronics industry. It examines their financial performance over a four-year period, utilizing key financial ratios such as profitability, liquidity, and solvency ratios to assess their financial health and stability. The analysis includes vertical and horizontal analysis of financial statements, comparing revenue, profit margins, and asset management. Furthermore, the report incorporates an analysis of the Corporate Social Responsibility (CSR) activities of both companies. The analysis includes tables and figures to support the findings, offering a comprehensive overview of their financial positions, market performance, and CSR initiatives.
FINANCIAL ANALYSIS
MANAGEMENT &
ENTREPRENEURSHIP
MANAGEMENT &
ENTREPRENEURSHIP
Paraphrase This Document
Need a fresh take? Get an instant paraphrase of this document with our AI Paraphraser
TABLE OF CONTENTS
INTRODUCTION...........................................................................................................................1
MAIN BODY...................................................................................................................................1
Vertical analysis..........................................................................................................................5
Horizontal analysis......................................................................................................................6
2. CSR report of Apple and Samsung.........................................................................................7
CONCLUSION..............................................................................................................................10
REFERENCES..............................................................................................................................11
APPENDIX....................................................................................................................................13
INTRODUCTION
Financial analysis refers to a measurement of stability, profitability of the company.
Chief financial officer prepare report by using key ratio and information would be taken by
financial statement and other report reports. Financial analysis management is essential for take
investment decision by comparing past performance and future performance of the company. It
helps to analysis to meet long term obligations, liquidity. Stability and profitability so company
can achieve goals and objectives. Present report based on financial analysts of apple and
Samsung company both company deals in electronic items like laptop, mobile, I-pad and
refrigerator etc. Apple Company is the largest company all over the world. Financial analysts and
management report includes compare the financial performance and financial position of the
Apple company and Samsung company by using last four years data. It also includes analysis of
their corporate social responsibility sections over the last years.
MAIN BODY
Ratios analysis – It is quantitative analysis that represent financial position and financial
health of the company. It involves evaluating the financial position and performance by
evaluating current data and historical data of the company . It provides liquidity position ,
operational performance, profitability and profitability of the company . It provide information to
customers , investor and employees of the company . It is essential to comparison of one's
company with other company . It is better way to understand profitability and efficiency of the
company.
Profitability ratios- it is use to assess the business earning capacity from the sales of the
company over a specific year. Higher profitability ratio shows positive impact on investors and
customers. It includes net profit margin , gross profit margin etc.
Liquidity ratio- it represents the relationship between current assets and current liabilities.
It shows company have sufficient assets to meet out its current liabilities . Assets must be higher
than liabilities to reduce their debt. It includes quick ratio, current ratios.
Solvency ratios- it measure the companies abilities to meet out its long term debt of the
company. It is mostly used by lenders and investors to determine companies abilities to pay their
debt. It includes equity debt ratios, debt to assets ratio etc.
Ratio analysis of apple
1
⊘ This is a preview!⊘
Do you want full access?
Subscribe today to unlock all pages.
Trusted by 1+ million students worldwide
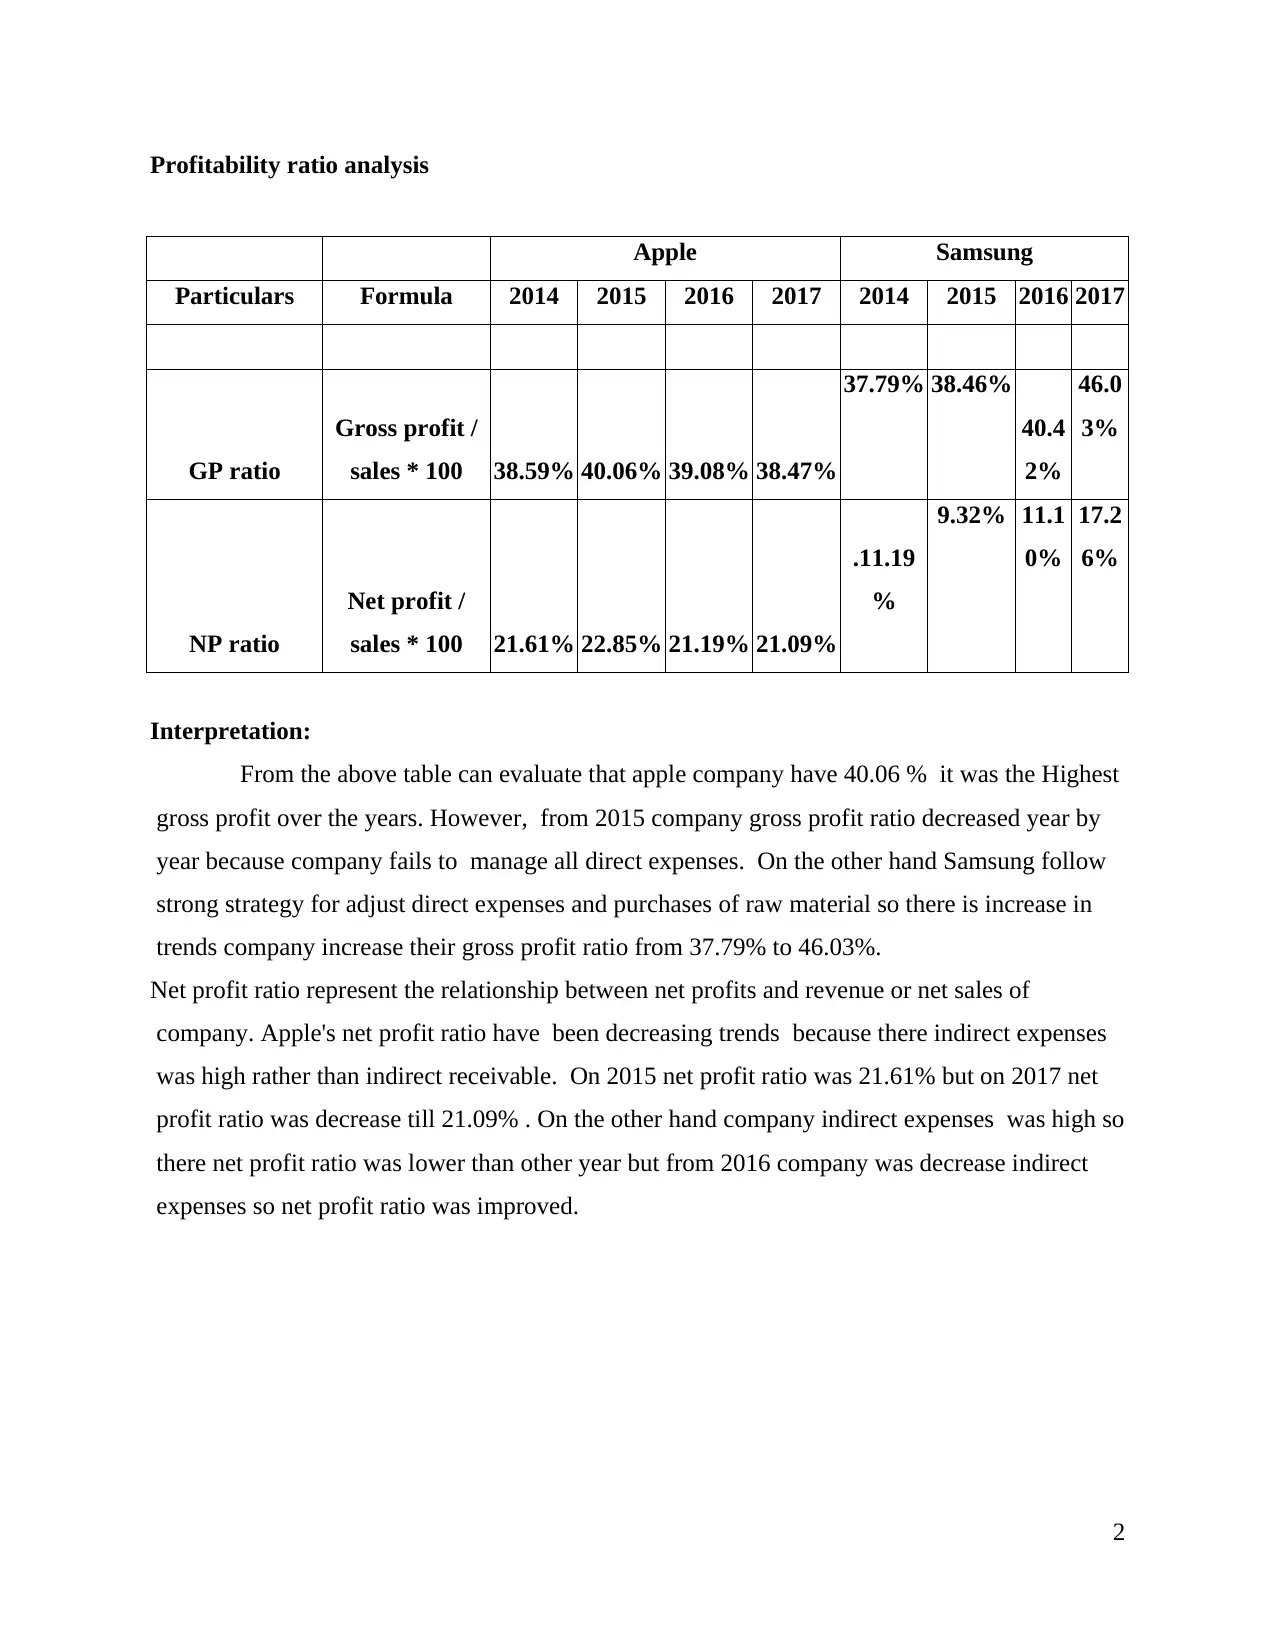
Profitability ratio analysis
Apple Samsung
Particulars Formula 2014 2015 2016 2017 2014 2015 2016 2017
GP ratio
Gross profit /
sales * 100 38.59% 40.06% 39.08% 38.47%
37.79% 38.46%
40.4
2%
46.0
3%
NP ratio
Net profit /
sales * 100 21.61% 22.85% 21.19% 21.09%
.11.19
%
9.32% 11.1
0%
17.2
6%
Interpretation:
From the above table can evaluate that apple company have 40.06 % it was the Highest
gross profit over the years. However, from 2015 company gross profit ratio decreased year by
year because company fails to manage all direct expenses. On the other hand Samsung follow
strong strategy for adjust direct expenses and purchases of raw material so there is increase in
trends company increase their gross profit ratio from 37.79% to 46.03%.
Net profit ratio represent the relationship between net profits and revenue or net sales of
company. Apple's net profit ratio have been decreasing trends because there indirect expenses
was high rather than indirect receivable. On 2015 net profit ratio was 21.61% but on 2017 net
profit ratio was decrease till 21.09% . On the other hand company indirect expenses was high so
there net profit ratio was lower than other year but from 2016 company was decrease indirect
expenses so net profit ratio was improved.
2
Paraphrase This Document
Need a fresh take? Get an instant paraphrase of this document with our AI Paraphraser
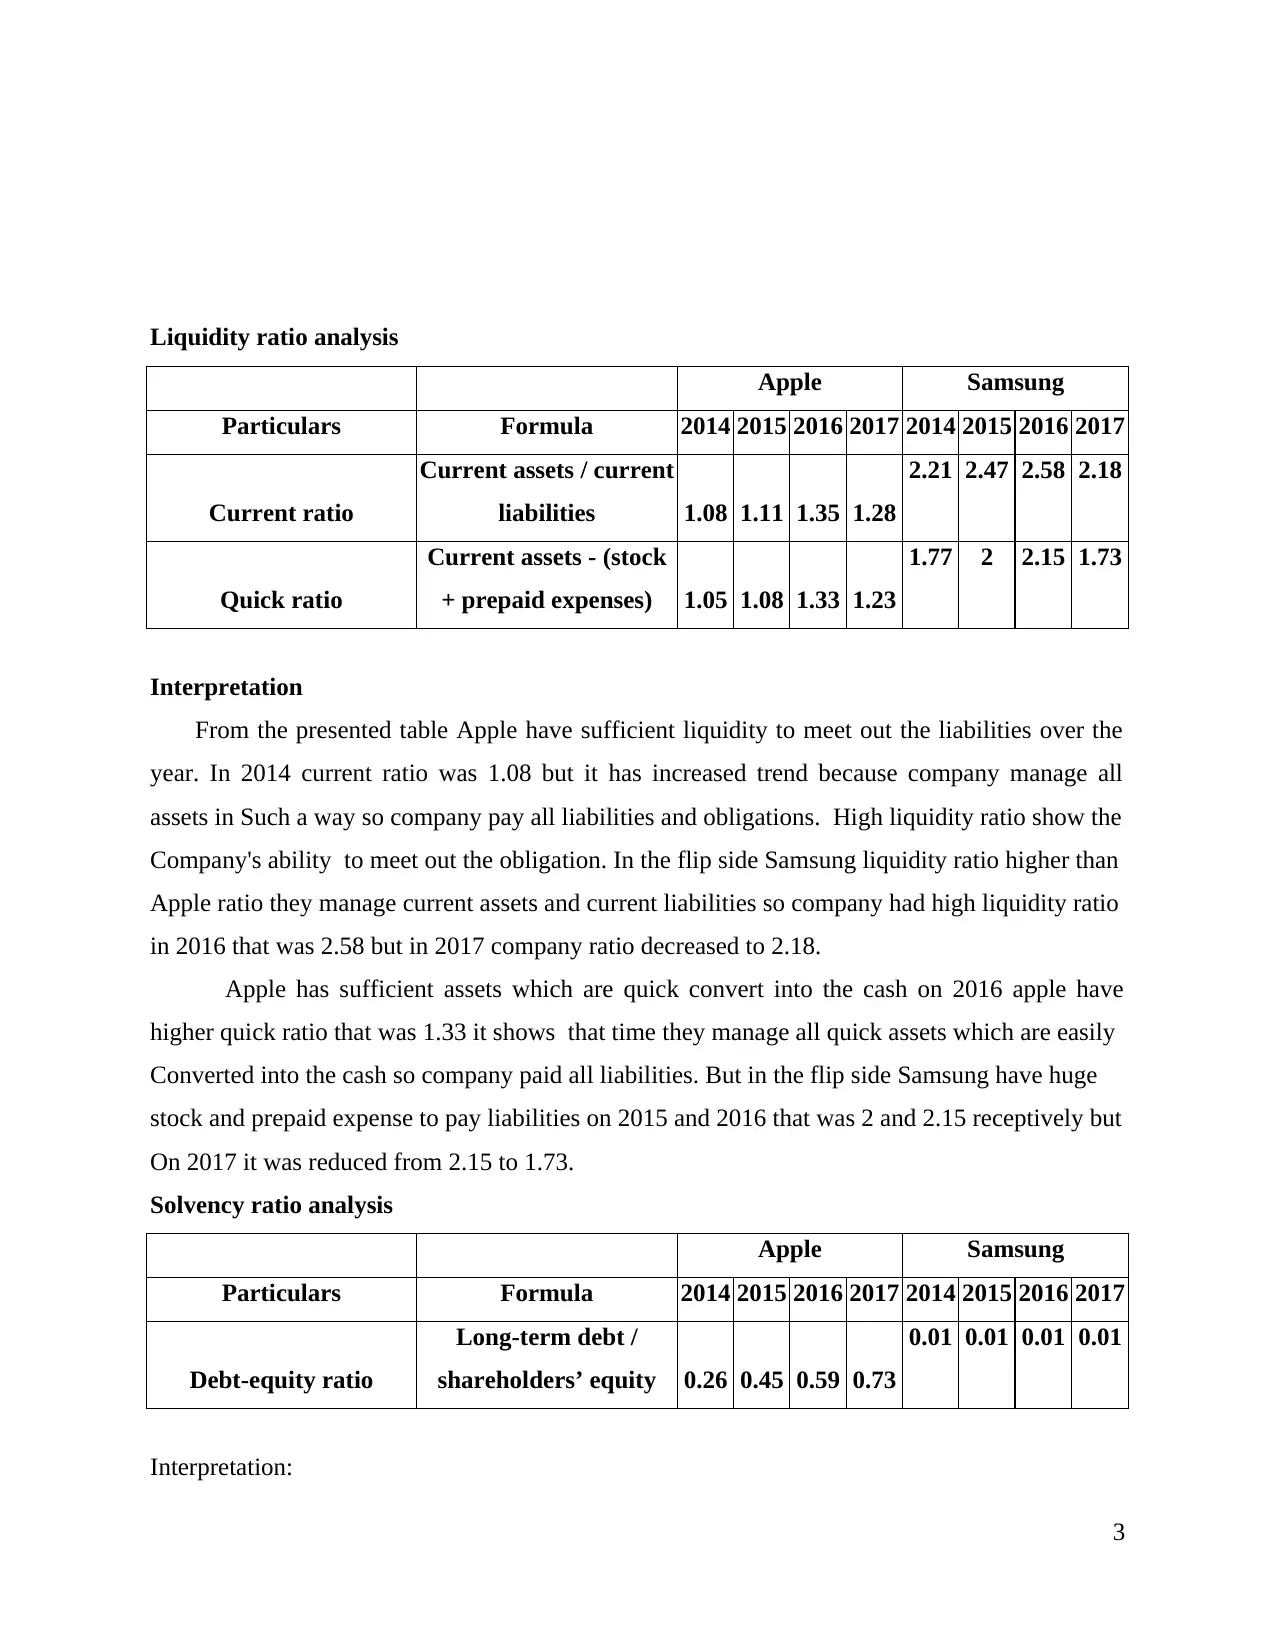
Liquidity ratio analysis
Apple Samsung
Particulars Formula 2014 2015 2016 2017 2014 2015 2016 2017
Current ratio
Current assets / current
liabilities 1.08 1.11 1.35 1.28
2.21 2.47 2.58 2.18
Quick ratio
Current assets - (stock
+ prepaid expenses) 1.05 1.08 1.33 1.23
1.77 2 2.15 1.73
Interpretation
From the presented table Apple have sufficient liquidity to meet out the liabilities over the
year. In 2014 current ratio was 1.08 but it has increased trend because company manage all
assets in Such a way so company pay all liabilities and obligations. High liquidity ratio show the
Company's ability to meet out the obligation. In the flip side Samsung liquidity ratio higher than
Apple ratio they manage current assets and current liabilities so company had high liquidity ratio
in 2016 that was 2.58 but in 2017 company ratio decreased to 2.18.
Apple has sufficient assets which are quick convert into the cash on 2016 apple have
higher quick ratio that was 1.33 it shows that time they manage all quick assets which are easily
Converted into the cash so company paid all liabilities. But in the flip side Samsung have huge
stock and prepaid expense to pay liabilities on 2015 and 2016 that was 2 and 2.15 receptively but
On 2017 it was reduced from 2.15 to 1.73.
Solvency ratio analysis
Apple Samsung
Particulars Formula 2014 2015 2016 2017 2014 2015 2016 2017
Debt-equity ratio
Long-term debt /
shareholders’ equity 0.26 0.45 0.59 0.73
0.01 0.01 0.01 0.01
Interpretation:
3
Apple Samsung
Particulars Formula 2014 2015 2016 2017 2014 2015 2016 2017
Current ratio
Current assets / current
liabilities 1.08 1.11 1.35 1.28
2.21 2.47 2.58 2.18
Quick ratio
Current assets - (stock
+ prepaid expenses) 1.05 1.08 1.33 1.23
1.77 2 2.15 1.73
Interpretation
From the presented table Apple have sufficient liquidity to meet out the liabilities over the
year. In 2014 current ratio was 1.08 but it has increased trend because company manage all
assets in Such a way so company pay all liabilities and obligations. High liquidity ratio show the
Company's ability to meet out the obligation. In the flip side Samsung liquidity ratio higher than
Apple ratio they manage current assets and current liabilities so company had high liquidity ratio
in 2016 that was 2.58 but in 2017 company ratio decreased to 2.18.
Apple has sufficient assets which are quick convert into the cash on 2016 apple have
higher quick ratio that was 1.33 it shows that time they manage all quick assets which are easily
Converted into the cash so company paid all liabilities. But in the flip side Samsung have huge
stock and prepaid expense to pay liabilities on 2015 and 2016 that was 2 and 2.15 receptively but
On 2017 it was reduced from 2.15 to 1.73.
Solvency ratio analysis
Apple Samsung
Particulars Formula 2014 2015 2016 2017 2014 2015 2016 2017
Debt-equity ratio
Long-term debt /
shareholders’ equity 0.26 0.45 0.59 0.73
0.01 0.01 0.01 0.01
Interpretation:
3
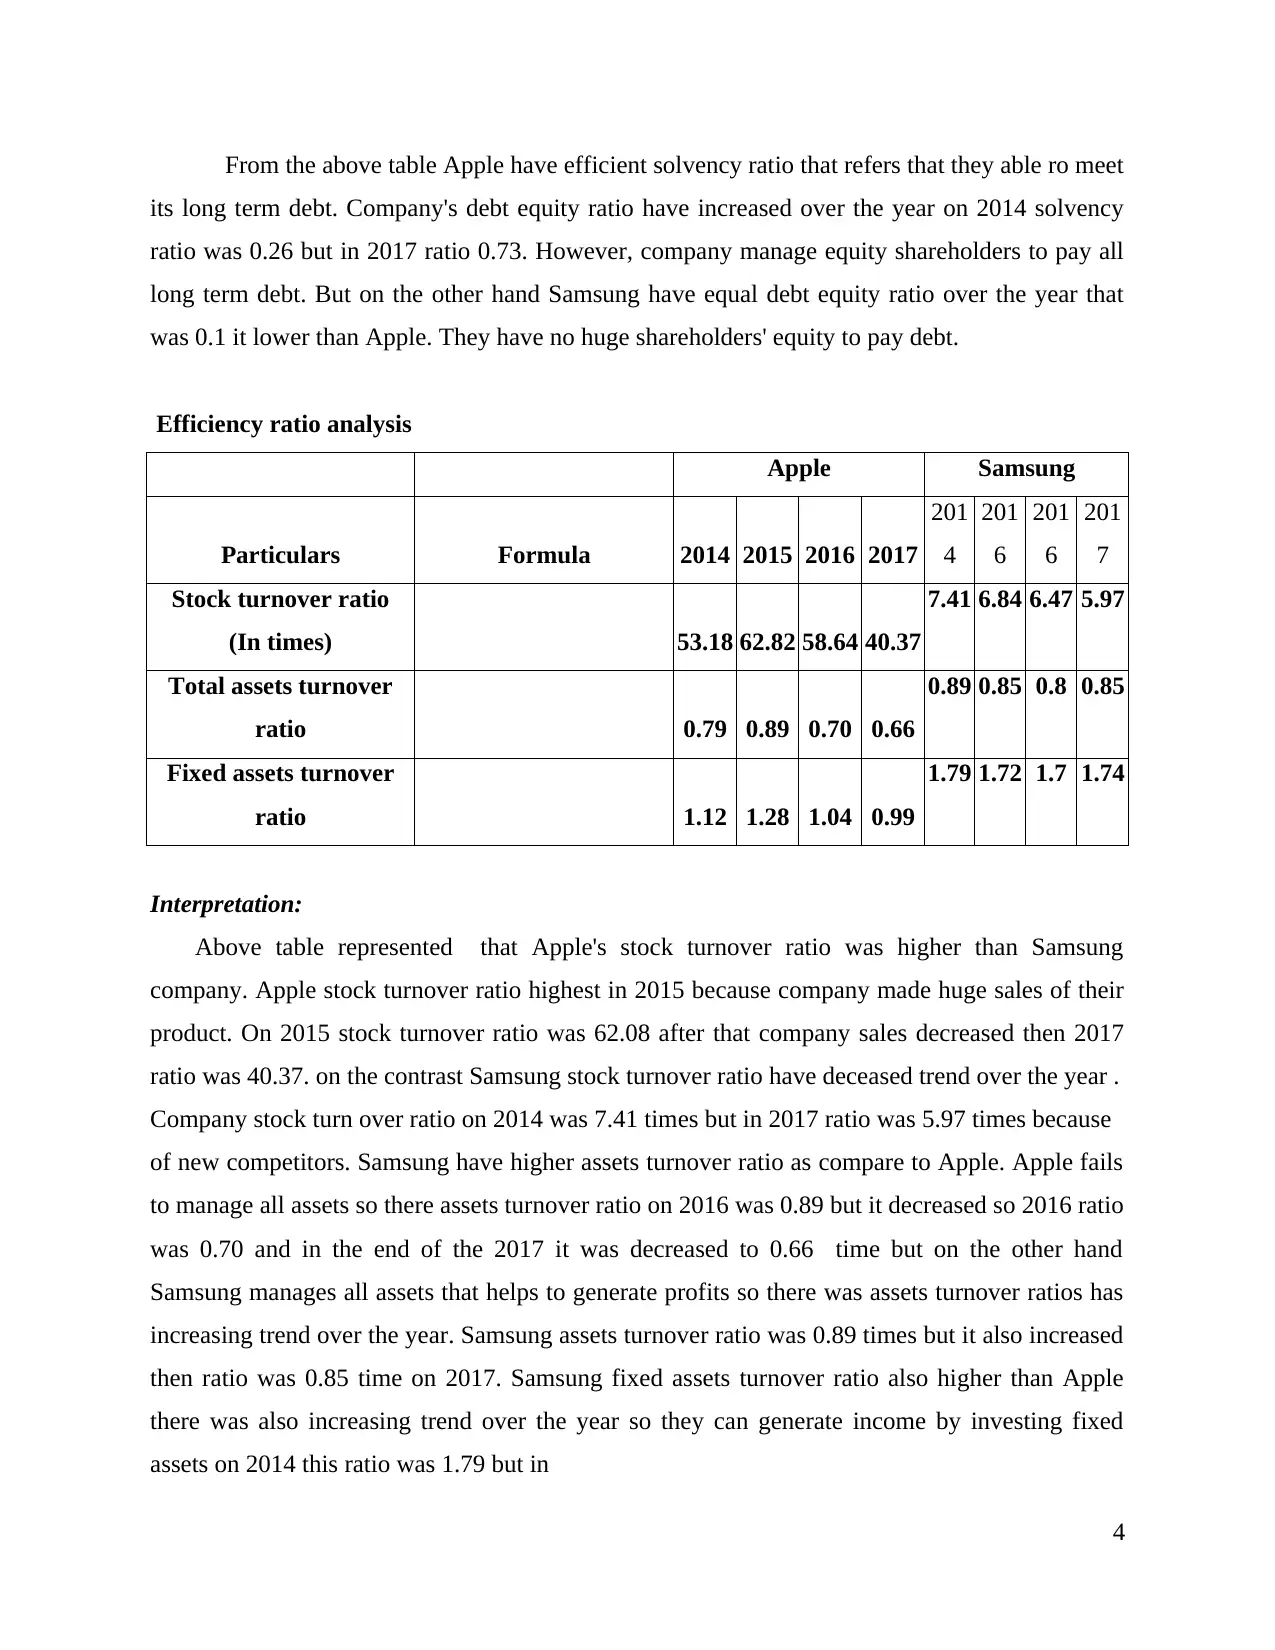
From the above table Apple have efficient solvency ratio that refers that they able ro meet
its long term debt. Company's debt equity ratio have increased over the year on 2014 solvency
ratio was 0.26 but in 2017 ratio 0.73. However, company manage equity shareholders to pay all
long term debt. But on the other hand Samsung have equal debt equity ratio over the year that
was 0.1 it lower than Apple. They have no huge shareholders' equity to pay debt.
Efficiency ratio analysis
Apple Samsung
Particulars Formula 2014 2015 2016 2017
201
4
201
6
201
6
201
7
Stock turnover ratio
(In times) 53.18 62.82 58.64 40.37
7.41 6.84 6.47 5.97
Total assets turnover
ratio 0.79 0.89 0.70 0.66
0.89 0.85 0.8 0.85
Fixed assets turnover
ratio 1.12 1.28 1.04 0.99
1.79 1.72 1.7 1.74
Interpretation:
Above table represented that Apple's stock turnover ratio was higher than Samsung
company. Apple stock turnover ratio highest in 2015 because company made huge sales of their
product. On 2015 stock turnover ratio was 62.08 after that company sales decreased then 2017
ratio was 40.37. on the contrast Samsung stock turnover ratio have deceased trend over the year .
Company stock turn over ratio on 2014 was 7.41 times but in 2017 ratio was 5.97 times because
of new competitors. Samsung have higher assets turnover ratio as compare to Apple. Apple fails
to manage all assets so there assets turnover ratio on 2016 was 0.89 but it decreased so 2016 ratio
was 0.70 and in the end of the 2017 it was decreased to 0.66 time but on the other hand
Samsung manages all assets that helps to generate profits so there was assets turnover ratios has
increasing trend over the year. Samsung assets turnover ratio was 0.89 times but it also increased
then ratio was 0.85 time on 2017. Samsung fixed assets turnover ratio also higher than Apple
there was also increasing trend over the year so they can generate income by investing fixed
assets on 2014 this ratio was 1.79 but in
4
⊘ This is a preview!⊘
Do you want full access?
Subscribe today to unlock all pages.
Trusted by 1+ million students worldwide
would decrease over the year so on 2017 ratio was 1.74. on the flip side Apple have also
reducing trend so ratio of the 2017 was 0.99 times.
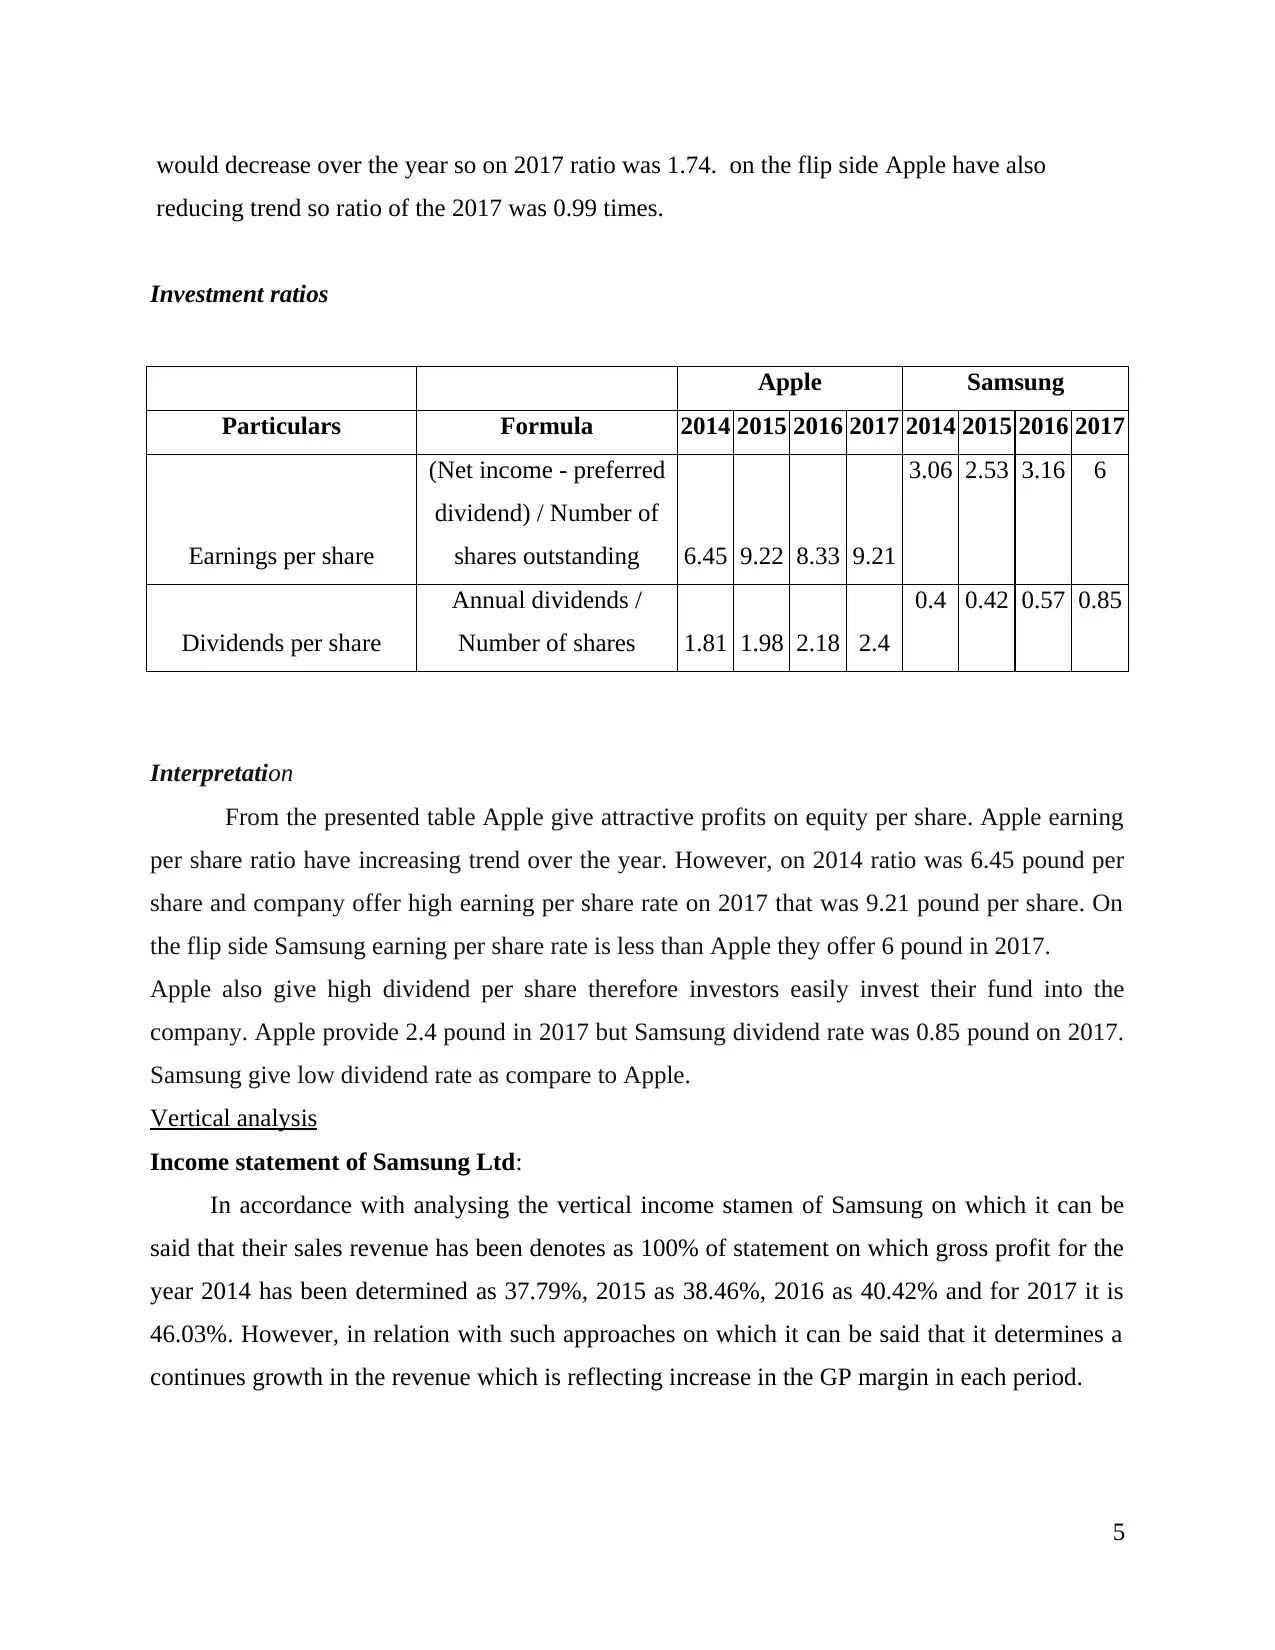
Investment ratios
Apple Samsung
Particulars Formula 2014 2015 2016 2017 2014 2015 2016 2017
Earnings per share
(Net income - preferred
dividend) / Number of
shares outstanding 6.45 9.22 8.33 9.21
3.06 2.53 3.16 6
Dividends per share
Annual dividends /
Number of shares 1.81 1.98 2.18 2.4
0.4 0.42 0.57 0.85
Interpretation
From the presented table Apple give attractive profits on equity per share. Apple earning
per share ratio have increasing trend over the year. However, on 2014 ratio was 6.45 pound per
share and company offer high earning per share rate on 2017 that was 9.21 pound per share. On
the flip side Samsung earning per share rate is less than Apple they offer 6 pound in 2017.
Apple also give high dividend per share therefore investors easily invest their fund into the
company. Apple provide 2.4 pound in 2017 but Samsung dividend rate was 0.85 pound on 2017.
Samsung give low dividend rate as compare to Apple.
Vertical analysis
Income statement of Samsung Ltd:
In accordance with analysing the vertical income stamen of Samsung on which it can be
said that their sales revenue has been denotes as 100% of statement on which gross profit for the
year 2014 has been determined as 37.79%, 2015 as 38.46%, 2016 as 40.42% and for 2017 it is
46.03%. However, in relation with such approaches on which it can be said that it determines a
continues growth in the revenue which is reflecting increase in the GP margin in each period.
5
reducing trend so ratio of the 2017 was 0.99 times.
Investment ratios
Apple Samsung
Particulars Formula 2014 2015 2016 2017 2014 2015 2016 2017
Earnings per share
(Net income - preferred
dividend) / Number of
shares outstanding 6.45 9.22 8.33 9.21
3.06 2.53 3.16 6
Dividends per share
Annual dividends /
Number of shares 1.81 1.98 2.18 2.4
0.4 0.42 0.57 0.85
Interpretation
From the presented table Apple give attractive profits on equity per share. Apple earning
per share ratio have increasing trend over the year. However, on 2014 ratio was 6.45 pound per
share and company offer high earning per share rate on 2017 that was 9.21 pound per share. On
the flip side Samsung earning per share rate is less than Apple they offer 6 pound in 2017.
Apple also give high dividend per share therefore investors easily invest their fund into the
company. Apple provide 2.4 pound in 2017 but Samsung dividend rate was 0.85 pound on 2017.
Samsung give low dividend rate as compare to Apple.
Vertical analysis
Income statement of Samsung Ltd:
In accordance with analysing the vertical income stamen of Samsung on which it can be
said that their sales revenue has been denotes as 100% of statement on which gross profit for the
year 2014 has been determined as 37.79%, 2015 as 38.46%, 2016 as 40.42% and for 2017 it is
46.03%. However, in relation with such approaches on which it can be said that it determines a
continues growth in the revenue which is reflecting increase in the GP margin in each period.
5
Paraphrase This Document
Need a fresh take? Get an instant paraphrase of this document with our AI Paraphraser
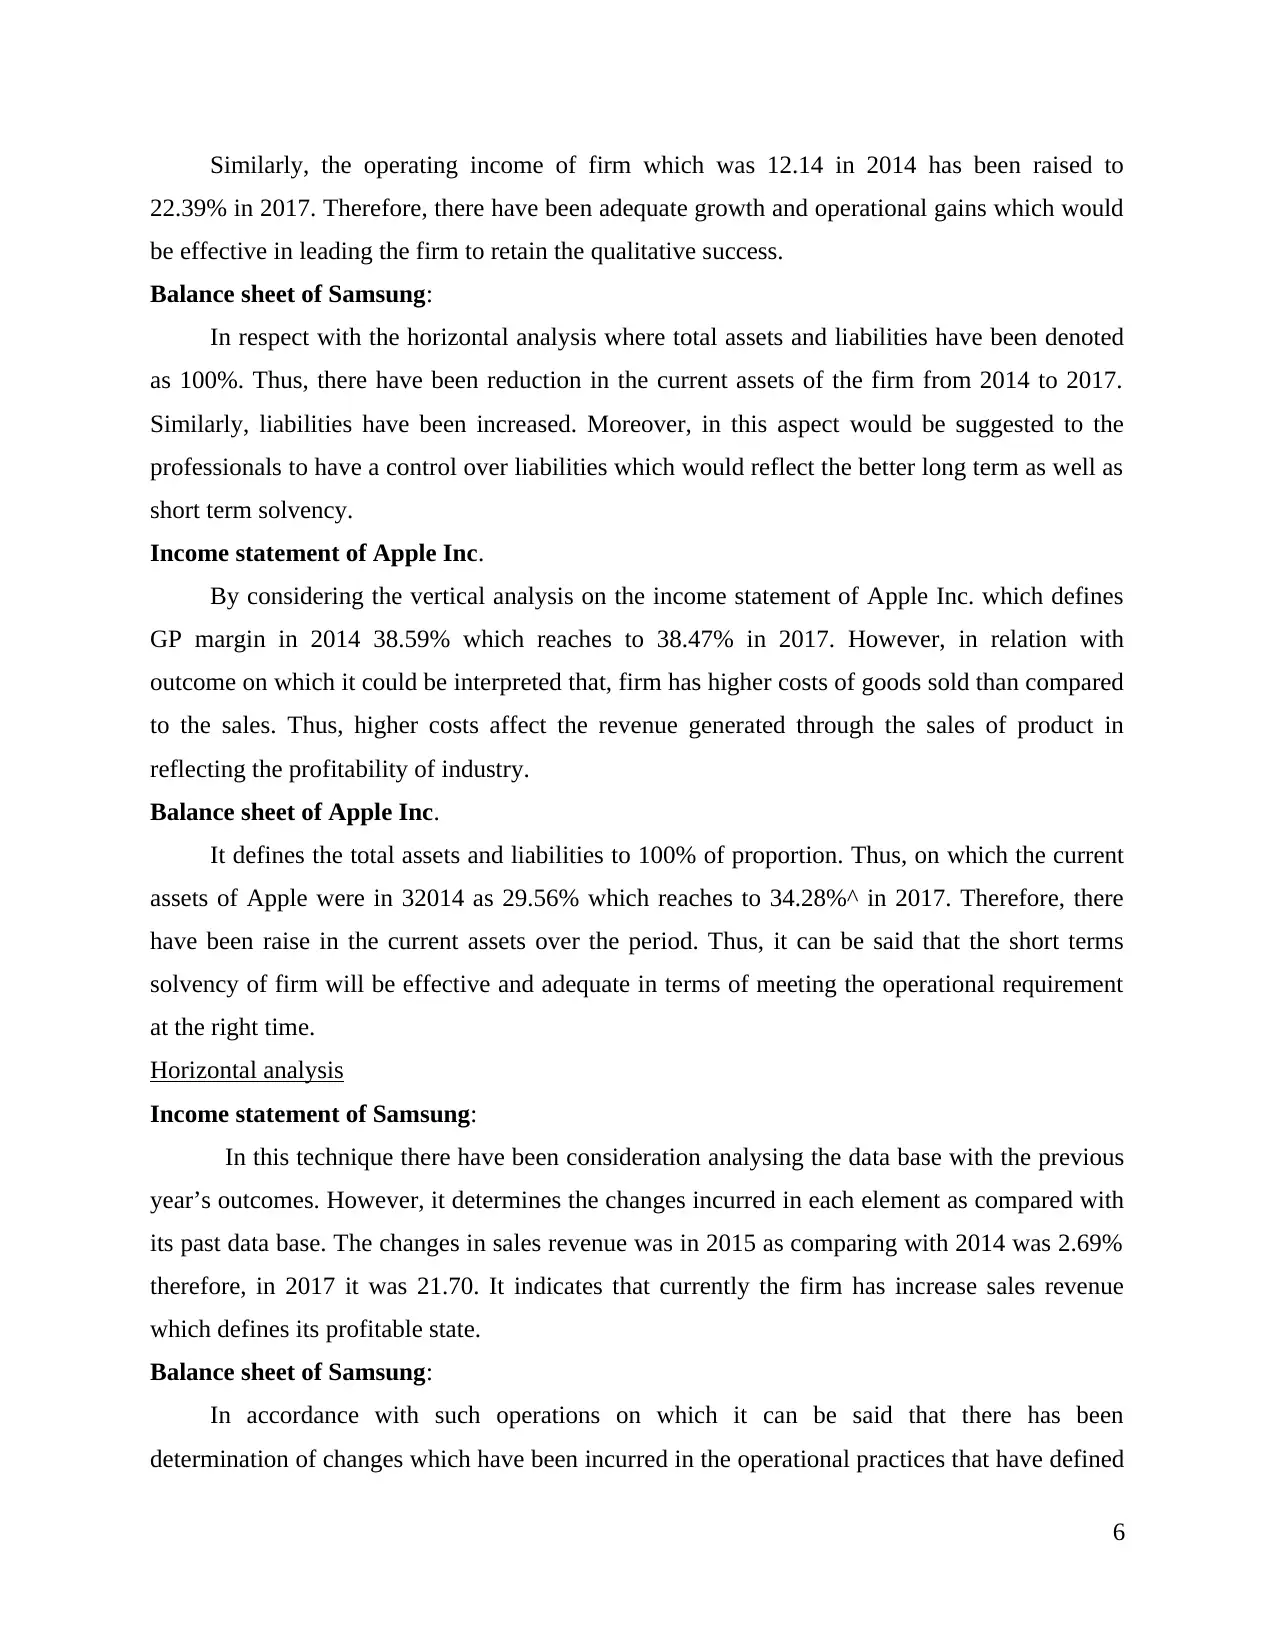
Similarly, the operating income of firm which was 12.14 in 2014 has been raised to
22.39% in 2017. Therefore, there have been adequate growth and operational gains which would
be effective in leading the firm to retain the qualitative success.
Balance sheet of Samsung:
In respect with the horizontal analysis where total assets and liabilities have been denoted
as 100%. Thus, there have been reduction in the current assets of the firm from 2014 to 2017.
Similarly, liabilities have been increased. Moreover, in this aspect would be suggested to the
professionals to have a control over liabilities which would reflect the better long term as well as
short term solvency.
Income statement of Apple Inc.
By considering the vertical analysis on the income statement of Apple Inc. which defines
GP margin in 2014 38.59% which reaches to 38.47% in 2017. However, in relation with
outcome on which it could be interpreted that, firm has higher costs of goods sold than compared
to the sales. Thus, higher costs affect the revenue generated through the sales of product in
reflecting the profitability of industry.
Balance sheet of Apple Inc.
It defines the total assets and liabilities to 100% of proportion. Thus, on which the current
assets of Apple were in 32014 as 29.56% which reaches to 34.28%^ in 2017. Therefore, there
have been raise in the current assets over the period. Thus, it can be said that the short terms
solvency of firm will be effective and adequate in terms of meeting the operational requirement
at the right time.
Horizontal analysis
Income statement of Samsung:
In this technique there have been consideration analysing the data base with the previous
year’s outcomes. However, it determines the changes incurred in each element as compared with
its past data base. The changes in sales revenue was in 2015 as comparing with 2014 was 2.69%
therefore, in 2017 it was 21.70. It indicates that currently the firm has increase sales revenue
which defines its profitable state.
Balance sheet of Samsung:
In accordance with such operations on which it can be said that there has been
determination of changes which have been incurred in the operational practices that have defined
6
the outcomes as changes in the total current assets was 8.40% in 2015 and reaches to 6.57%.
there has been reduction in the total current assets of the firm. On the other side in respect with
analysing the current liabilities of the firm on which it was 2.90% in 2015 and 2017 it reaches to
100%. Therefore in 2016 and 2017 the liabilities amount remains same.
Income statement of Apple Inc.
As per making analysis over the horizontal analysing of the income stamen of Apple Inc.
Thus, on which it can be said that there are changes in sales between 2014 and 2015 was 27.86%
while in accordance with determining the changes between 201+6 and 2017 on which it reflects
6.30% Thus, in relation with such aspects it can be said that there have been effective changes in
the operational ascertainment over increasing the sales volume of organisation.
Balance sheet of Apple Inc.
By considering the horizontal analysis over the balance sheet of Apple Inc. on which it can
be said that firm has effective ascertainment of operational practices. The current assets of firm
which were in 2014 and 2015 had defined the changes in percentage such as 30.42% in 2016 and
2017 which defines as 20.38%. However, in accordance with such operations on which it can be
said that, firm need to manage the short and long-term solvency. It can be done by recovering
receivables within limited time frame, managing cash flows, inventories etc.
Similarly, by reducing the liabilities it will be effective for the firm in relation with
managing all the debts which have been influencing he management of operational practices.
Thus, managing solvency will result in bringing long term advantages as well as will bring a
favourable disclosure among the external users. They would make investment decision as per
analysing the security of their investment funds into operations.
2. CSR report of Apple and Samsung
Apple report: the CSR of the company involves the environmental responsibility and the
reports enlighten the three main areas for themselves and the stakeholder as well. The Apple
have focuses on the area of reducing the impact on the climate change with use of renewable
energy sources, conservation of the precious resources for sustainable developments and to
pioneer the use of safer materials in its products and processes. The achievements of the Apple in
conservation of the energy in year 2016-2017 can be defined as, 96% of the energy used by
Apple in its global facilitates had come from renewable energy which reduced the carbon
emission by approximately 585000 metric tons.
7
⊘ This is a preview!⊘
Do you want full access?
Subscribe today to unlock all pages.
Trusted by 1+ million students worldwide
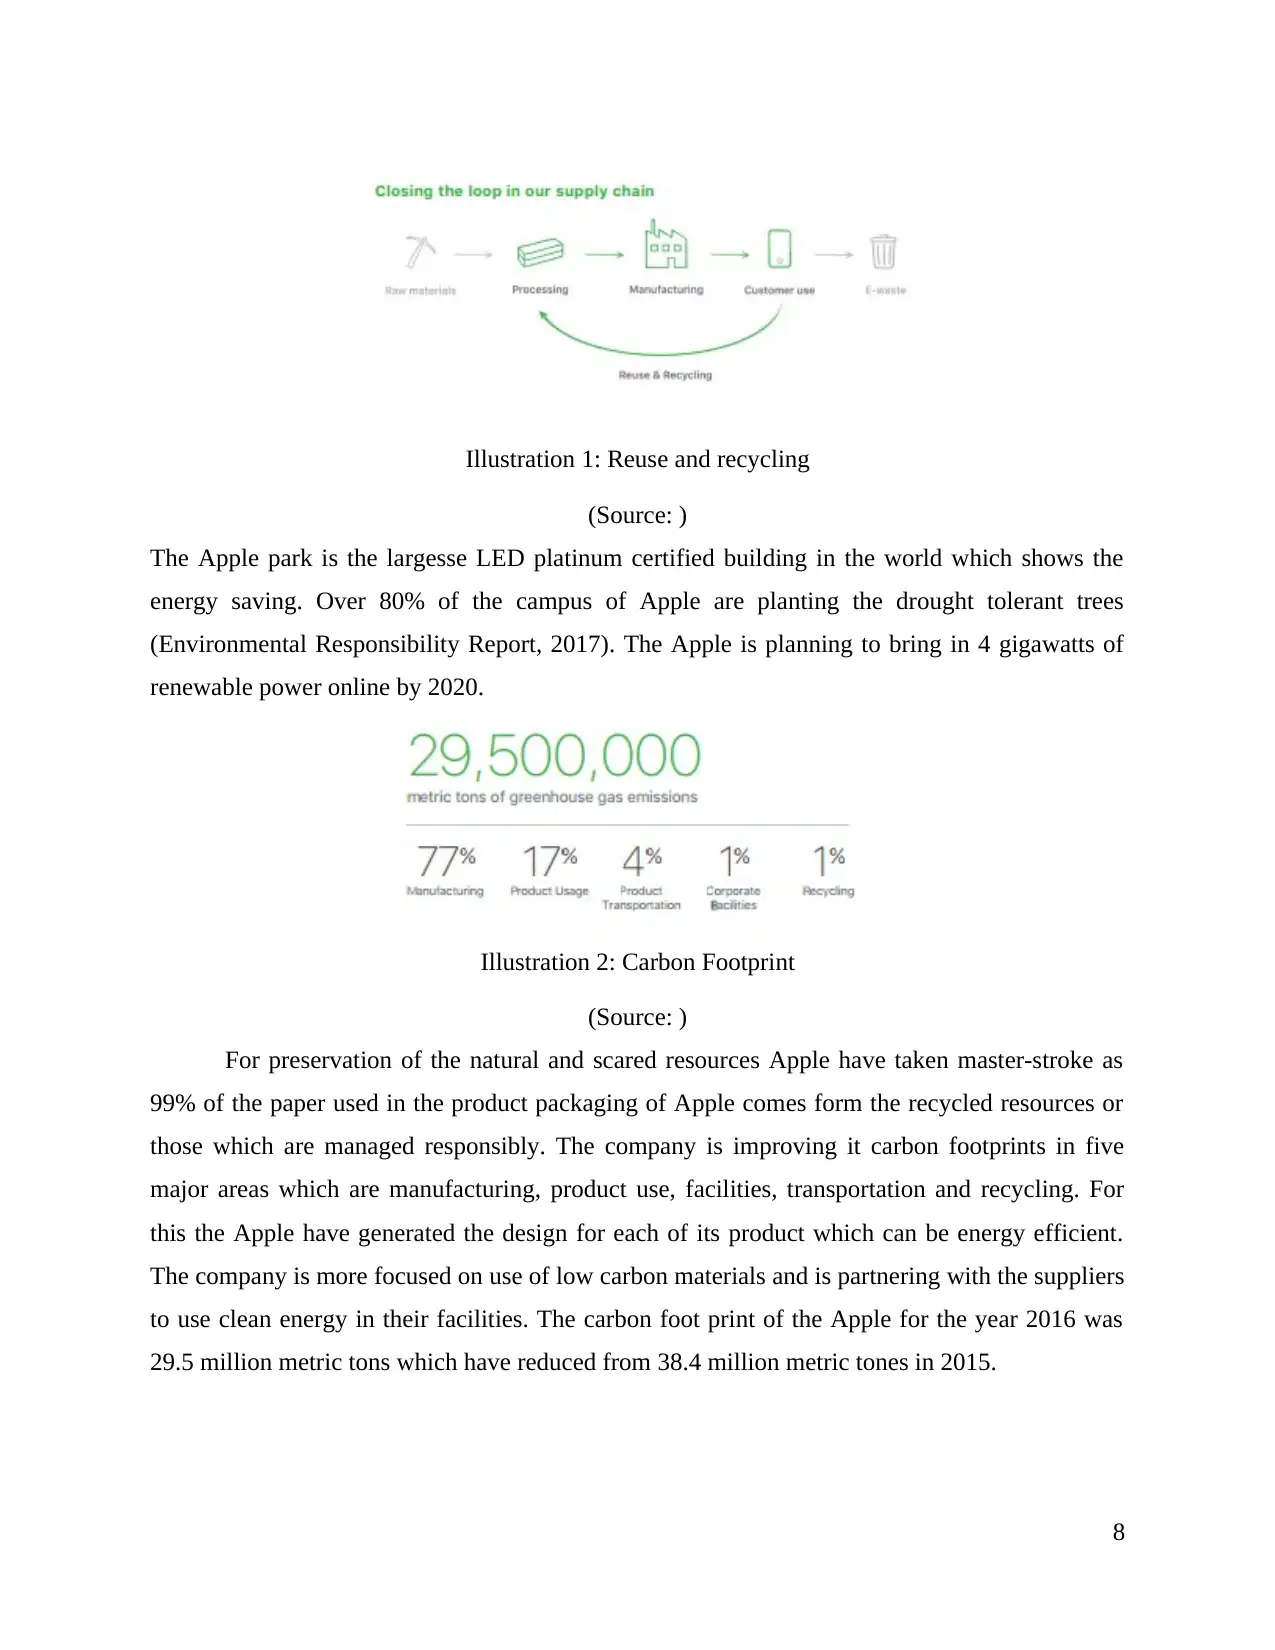
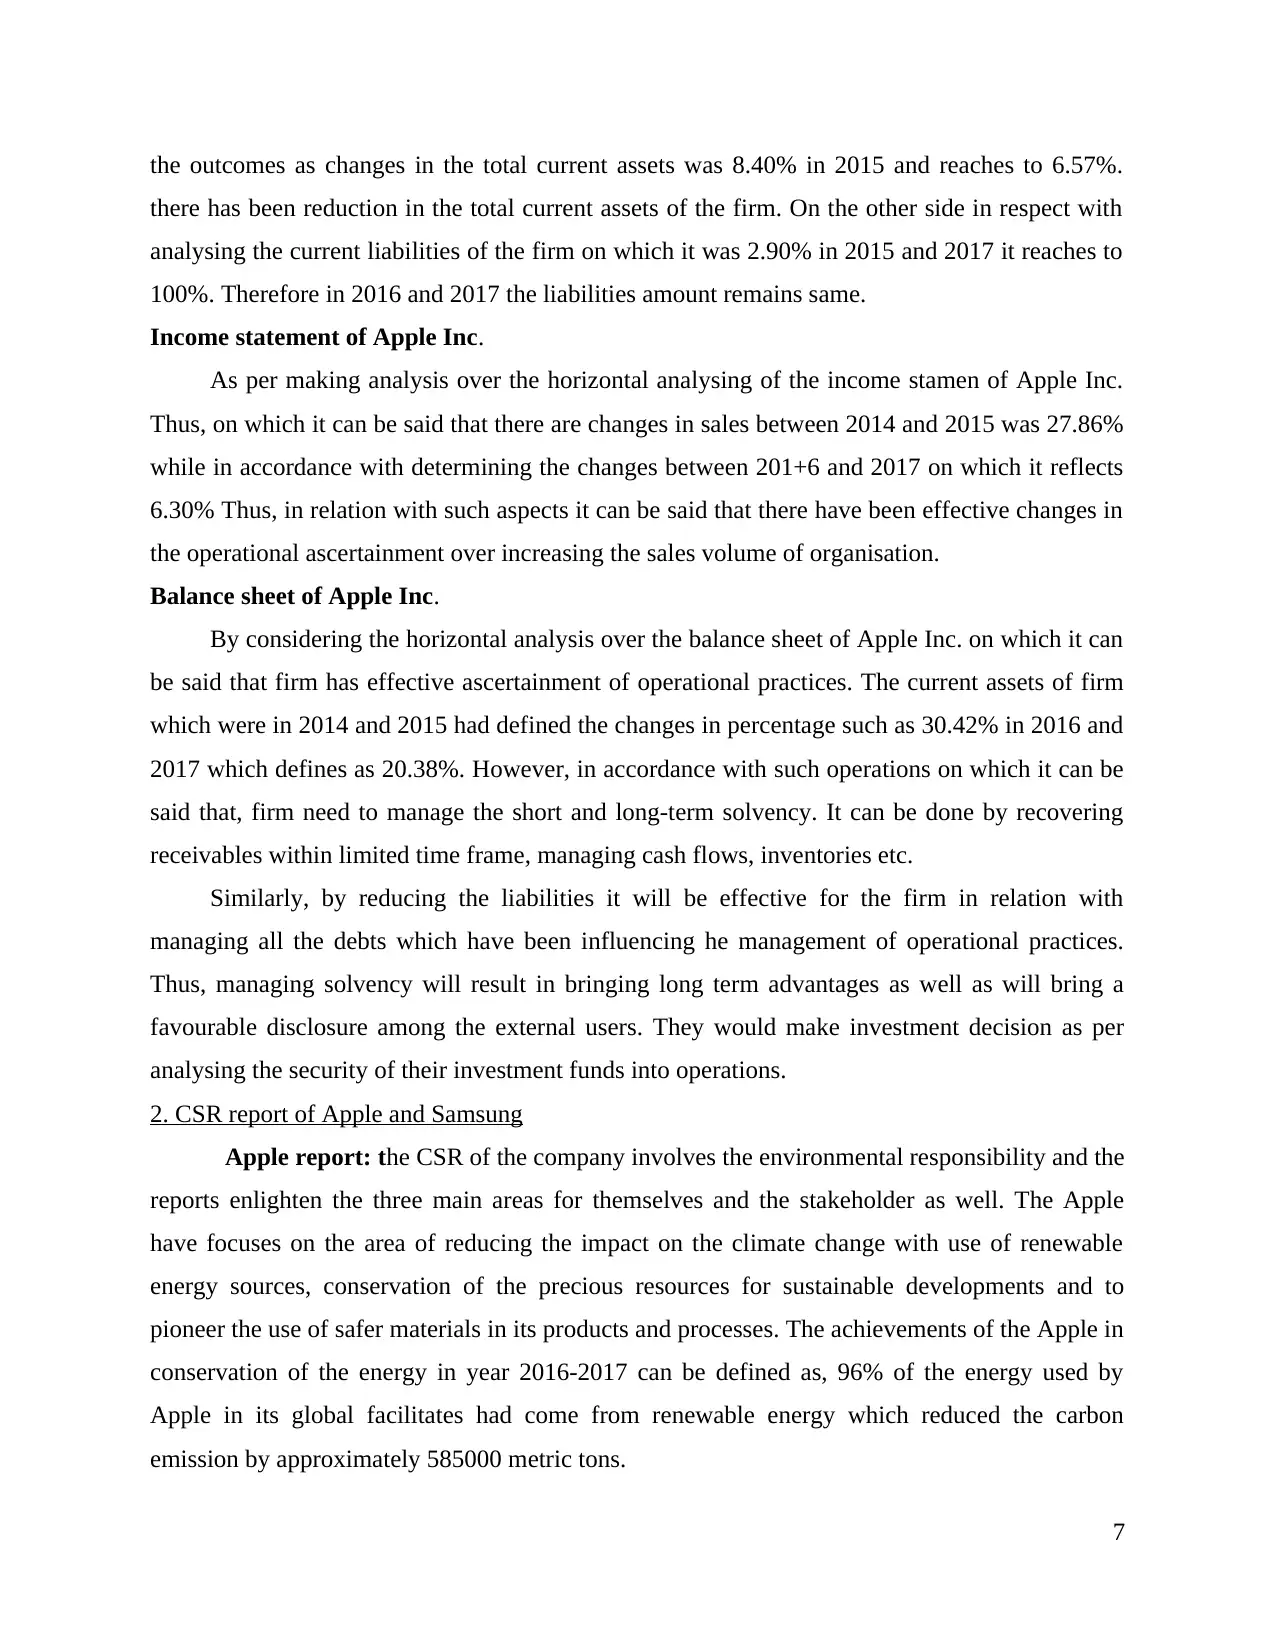
Illustration 1: Reuse and recycling
(Source: )
The Apple park is the largesse LED platinum certified building in the world which shows the
energy saving. Over 80% of the campus of Apple are planting the drought tolerant trees
(Environmental Responsibility Report, 2017). The Apple is planning to bring in 4 gigawatts of
renewable power online by 2020.
Illustration 2: Carbon Footprint
(Source: )
For preservation of the natural and scared resources Apple have taken master-stroke as
99% of the paper used in the product packaging of Apple comes form the recycled resources or
those which are managed responsibly. The company is improving it carbon footprints in five
major areas which are manufacturing, product use, facilities, transportation and recycling. For
this the Apple have generated the design for each of its product which can be energy efficient.
The company is more focused on use of low carbon materials and is partnering with the suppliers
to use clean energy in their facilities. The carbon foot print of the Apple for the year 2016 was
29.5 million metric tons which have reduced from 38.4 million metric tones in 2015.
8
(Source: )
The Apple park is the largesse LED platinum certified building in the world which shows the
energy saving. Over 80% of the campus of Apple are planting the drought tolerant trees
(Environmental Responsibility Report, 2017). The Apple is planning to bring in 4 gigawatts of
renewable power online by 2020.
Illustration 2: Carbon Footprint
(Source: )
For preservation of the natural and scared resources Apple have taken master-stroke as
99% of the paper used in the product packaging of Apple comes form the recycled resources or
those which are managed responsibly. The company is improving it carbon footprints in five
major areas which are manufacturing, product use, facilities, transportation and recycling. For
this the Apple have generated the design for each of its product which can be energy efficient.
The company is more focused on use of low carbon materials and is partnering with the suppliers
to use clean energy in their facilities. The carbon foot print of the Apple for the year 2016 was
29.5 million metric tons which have reduced from 38.4 million metric tones in 2015.
8
Paraphrase This Document
Need a fresh take? Get an instant paraphrase of this document with our AI Paraphraser
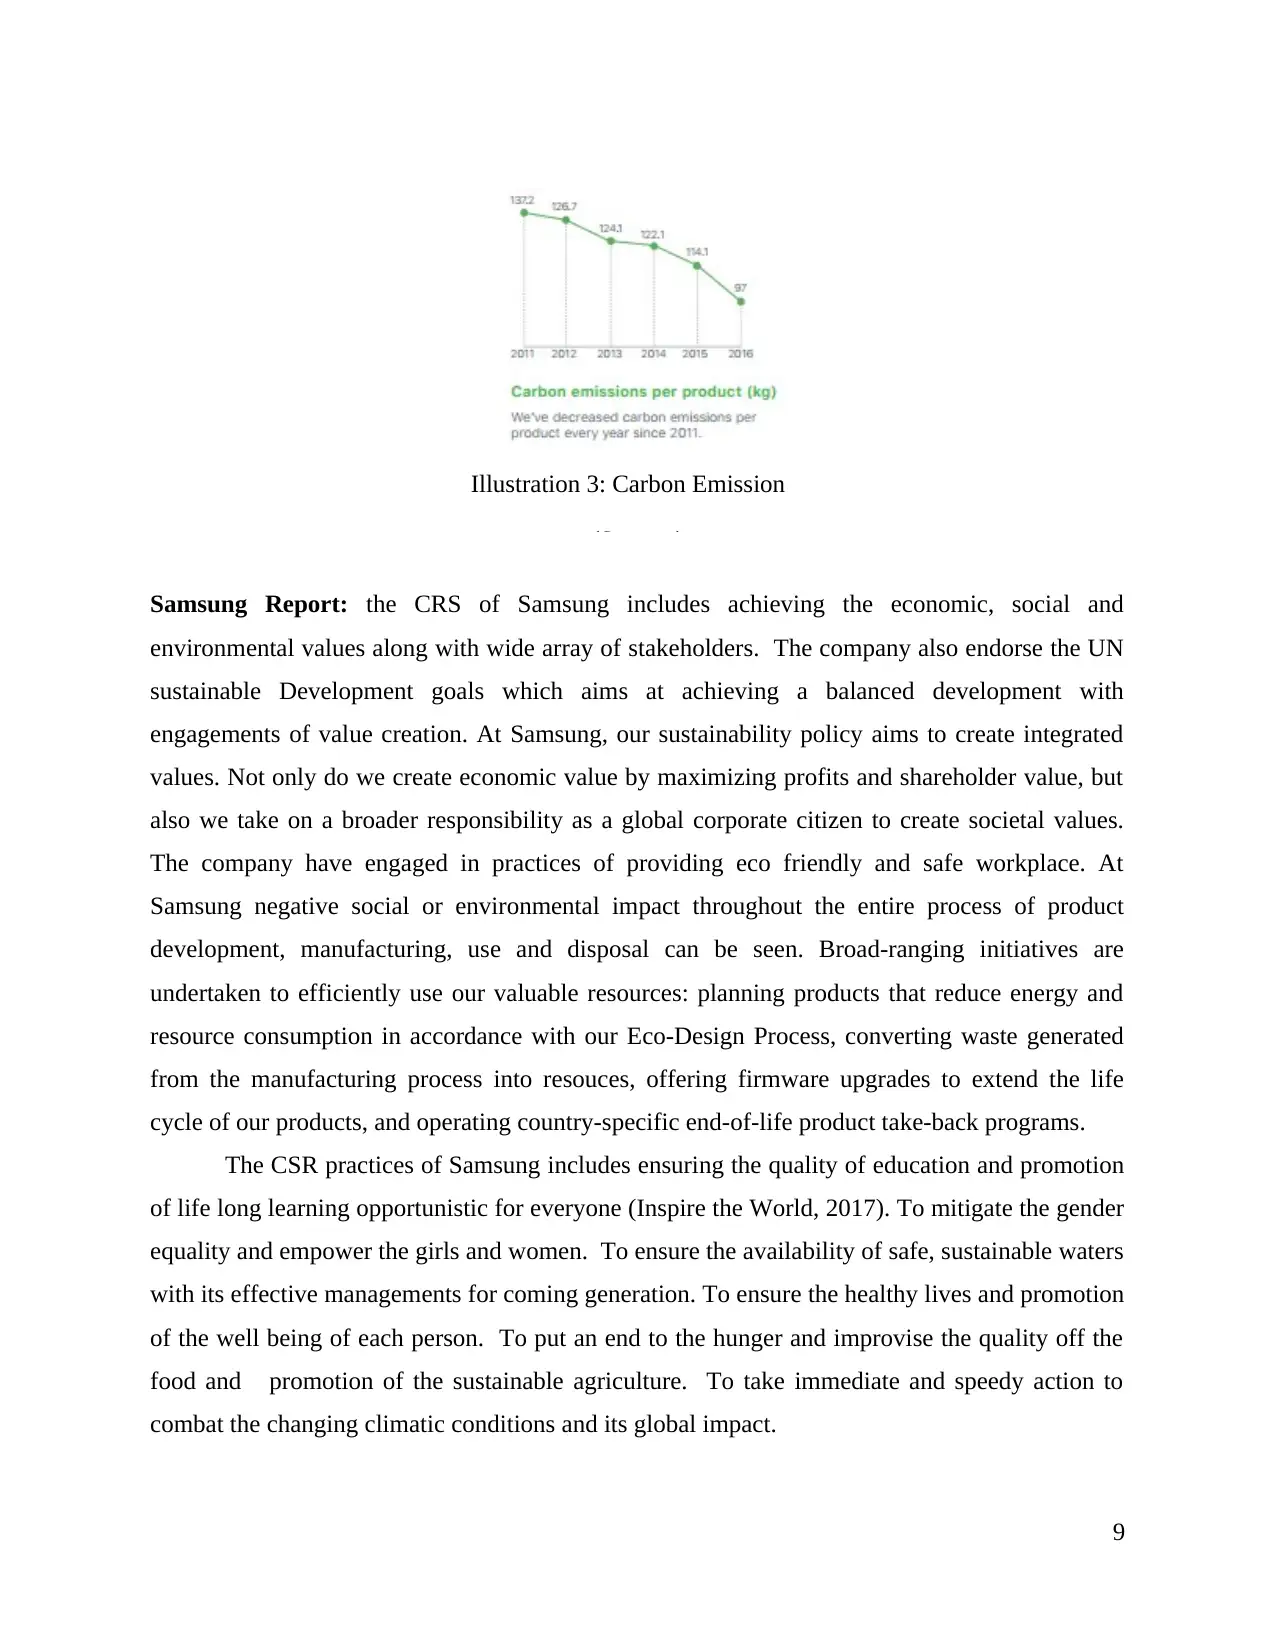
Illustration 3: Carbon Emission
(Source:)
Samsung Report: the CRS of Samsung includes achieving the economic, social and
environmental values along with wide array of stakeholders. The company also endorse the UN
sustainable Development goals which aims at achieving a balanced development with
engagements of value creation. At Samsung, our sustainability policy aims to create integrated
values. Not only do we create economic value by maximizing profits and shareholder value, but
also we take on a broader responsibility as a global corporate citizen to create societal values.
The company have engaged in practices of providing eco friendly and safe workplace. At
Samsung negative social or environmental impact throughout the entire process of product
development, manufacturing, use and disposal can be seen. Broad-ranging initiatives are
undertaken to efficiently use our valuable resources: planning products that reduce energy and
resource consumption in accordance with our Eco-Design Process, converting waste generated
from the manufacturing process into resouces, offering firmware upgrades to extend the life
cycle of our products, and operating country-specific end-of-life product take-back programs.
The CSR practices of Samsung includes ensuring the quality of education and promotion
of life long learning opportunistic for everyone (Inspire the World, 2017). To mitigate the gender
equality and empower the girls and women. To ensure the availability of safe, sustainable waters
with its effective managements for coming generation. To ensure the healthy lives and promotion
of the well being of each person. To put an end to the hunger and improvise the quality off the
food and promotion of the sustainable agriculture. To take immediate and speedy action to
combat the changing climatic conditions and its global impact.
9
It can be clearly seen the Apple is more focused on conservation the environment and is
dedicated towards the less use of energy and use all the renewable energy in all its facilities
around the world. Further more Apple is day by day increasing the use of carbon emission by use
of less carbon material in its products. Whereas, Samsung focuses on the all three factors of CRS
that is social economical and environmental. It also abides with the sustainable goals of the UN.
CONCLUSION
Above report summarised that company invest their money by evaluating financial
position of the company . Apple and Samsung company financial position can be evaluating by
using key ratios such as profitability ratio , liquidity ratio , solvency ratio and investment ratios.
Financial analysis is essential to comparison and also provide information to public. Profitability
ratio is essential to analysis profits which are generating by sales and also included liquidity ratio
that represent that company have sufficient liquidity to pay all debts of the company. All
financial analysts are important to all investors and customers of the company. It also concluded
that both company prepare corporate social responsibility that represent company's operational
performance that overall impact on business. CSR focus on economical responsibility and ethical
business practices that helps to improve public image and increased customers.
10
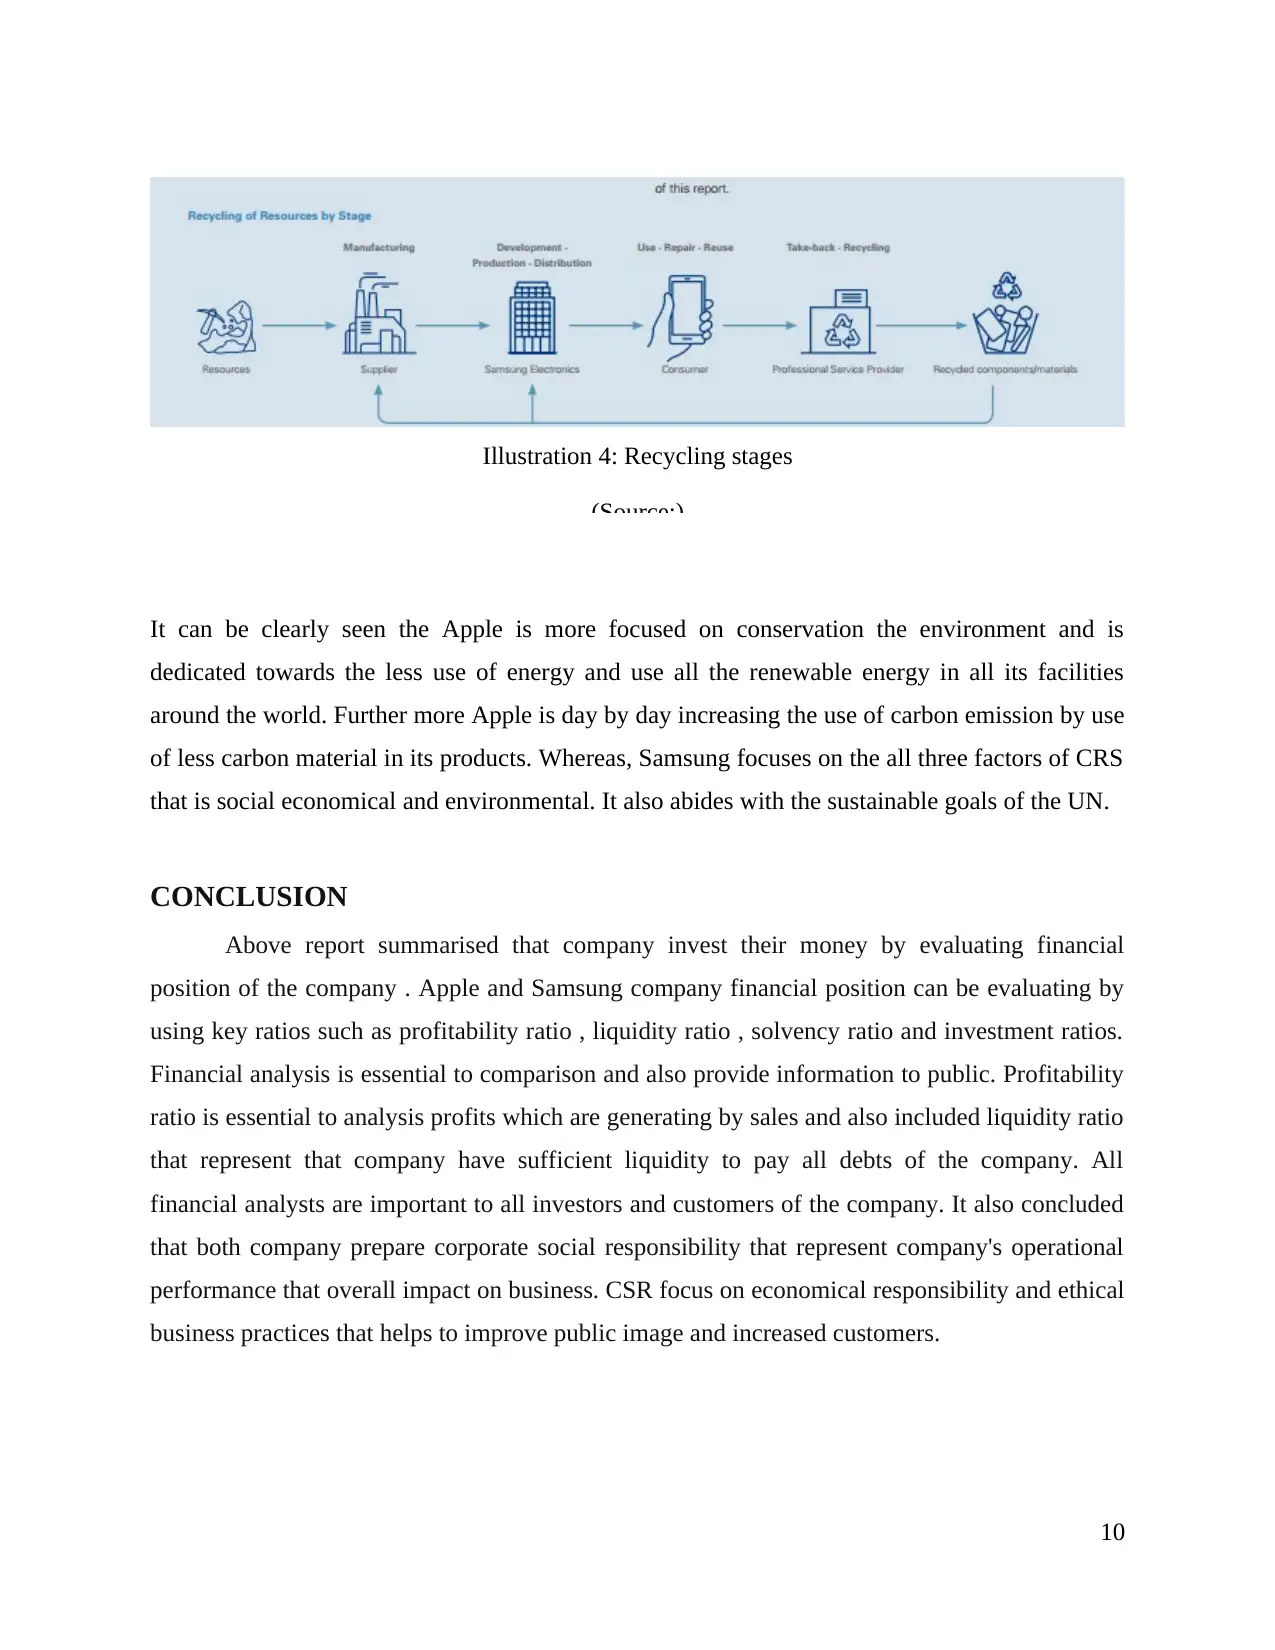
Illustration 4: Recycling stages
(Source:)
dedicated towards the less use of energy and use all the renewable energy in all its facilities
around the world. Further more Apple is day by day increasing the use of carbon emission by use
of less carbon material in its products. Whereas, Samsung focuses on the all three factors of CRS
that is social economical and environmental. It also abides with the sustainable goals of the UN.
CONCLUSION
Above report summarised that company invest their money by evaluating financial
position of the company . Apple and Samsung company financial position can be evaluating by
using key ratios such as profitability ratio , liquidity ratio , solvency ratio and investment ratios.
Financial analysis is essential to comparison and also provide information to public. Profitability
ratio is essential to analysis profits which are generating by sales and also included liquidity ratio
that represent that company have sufficient liquidity to pay all debts of the company. All
financial analysts are important to all investors and customers of the company. It also concluded
that both company prepare corporate social responsibility that represent company's operational
performance that overall impact on business. CSR focus on economical responsibility and ethical
business practices that helps to improve public image and increased customers.
10
Illustration 4: Recycling stages
(Source:)
⊘ This is a preview!⊘
Do you want full access?
Subscribe today to unlock all pages.
Trusted by 1+ million students worldwide
1 out of 18
Related Documents


Your All-in-One AI-Powered Toolkit for Academic Success.
+13062052269
info@desklib.com
Available 24*7 on WhatsApp / Email
![[object Object]](/_next/static/media/star-bottom.7253800d.svg)
Unlock your academic potential
Copyright © 2020–2026 A2Z Services. All Rights Reserved. Developed and managed by ZUCOL.