Financial Performance Comparison: Apple Inc. vs Samsung Corporation
VerifiedAdded on 2021/05/28
|6
|1233
|56
Report
AI Summary
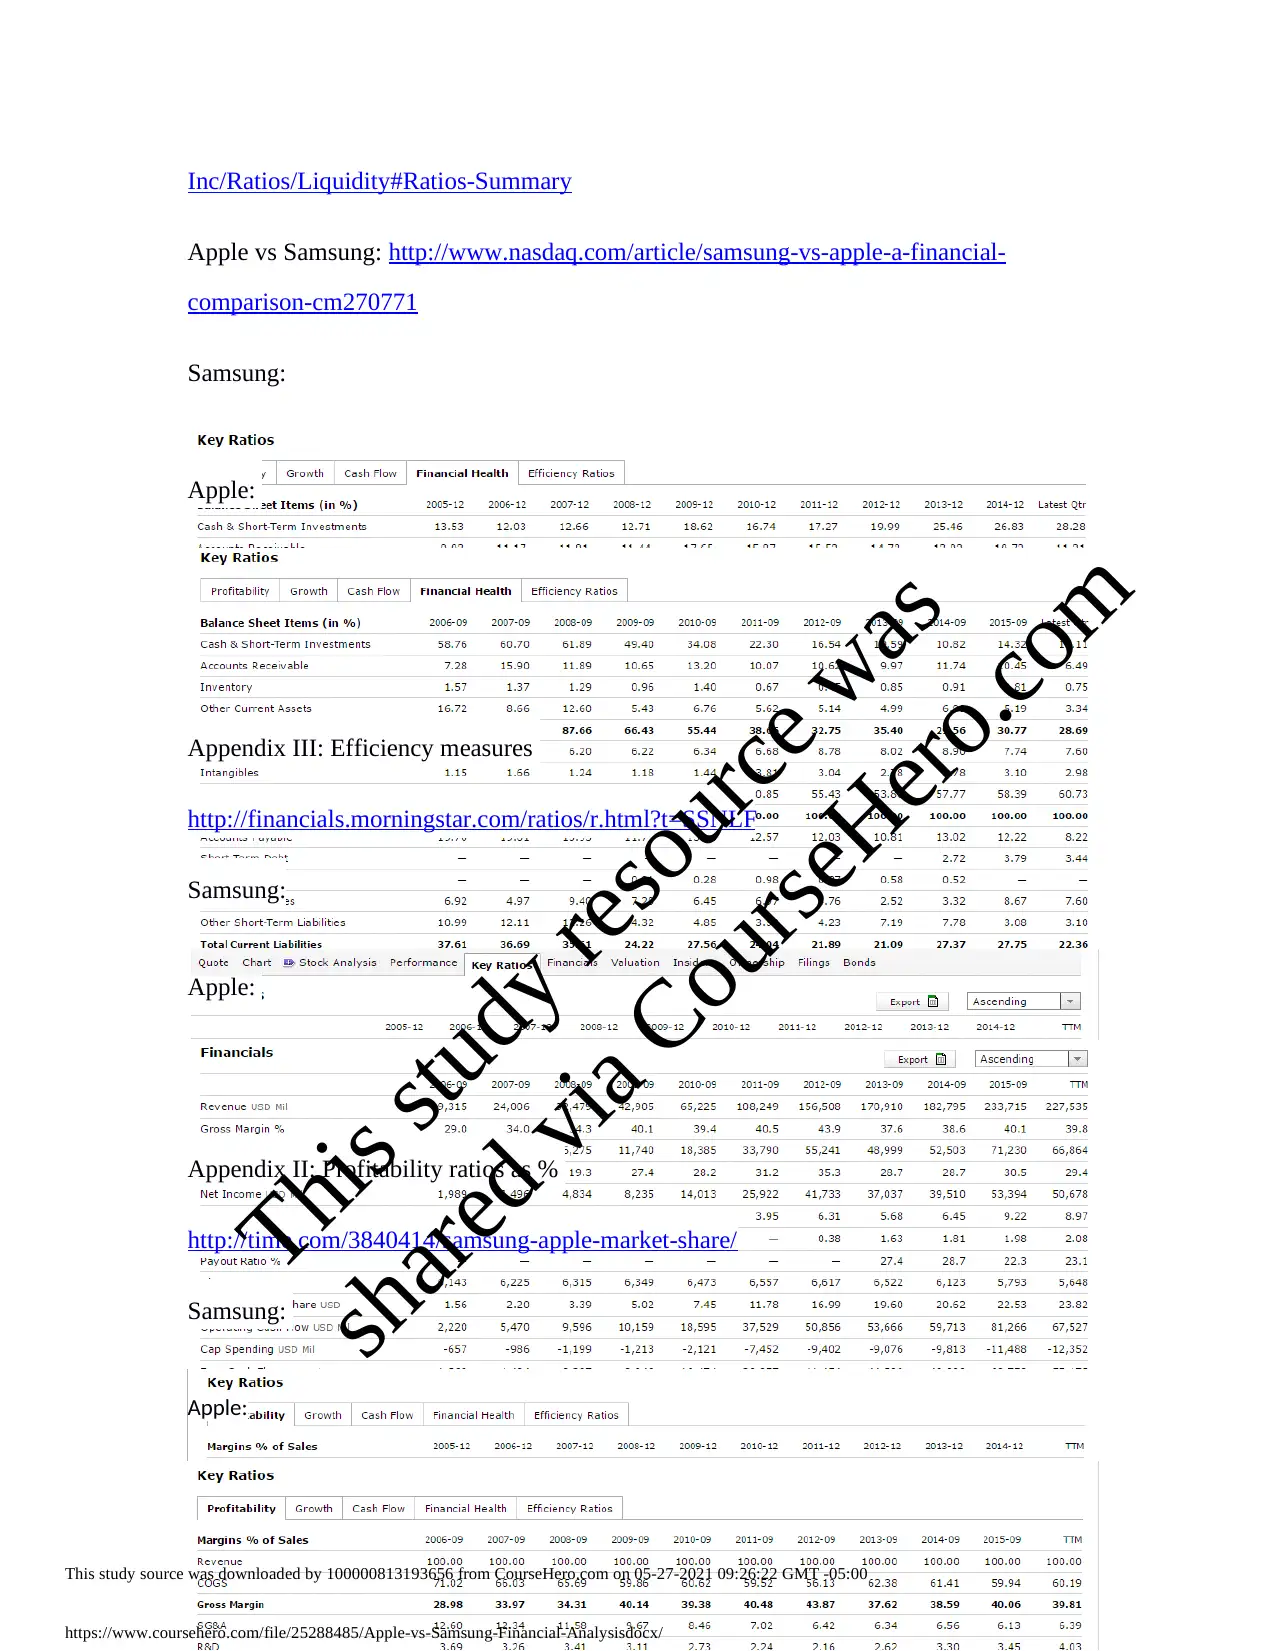
This report presents a comparative financial analysis of Apple Inc. and Samsung Corporation, focusing on key financial ratios to assess their performance. The analysis covers profitability, liquidity, financial leverage, and efficiency measures. Profitability is evaluated using return on assets, gross margin profit, operating margin, and return on equity, revealing Apple's stronger performance. Liquidity is assessed through current and quick ratios, showing Samsung's advantage in meeting short-term obligations. Financial leverage is examined, indicating Apple's higher reliance on loans. Efficiency is measured by asset turnover and receivables turnover rates, where Samsung demonstrates slightly better asset utilization. The report concludes with recommendations, suggesting Samsung could improve by focusing on areas where Apple excels, particularly profitability, and suggests reducing costs of goods sold. The analysis utilizes financial statements and data from their respective websites and provides charts in the appendix for reference.

Introduction
Financial analysis is an integral success factor in any business. Through financial
analysis, the business managers are able to picture to growth of the business, profitability,
risks factors, as well as predict the future of the business. Financial analyses are usually
based on the financial statements of the business recorded one several financial years. To
carry out the analysis, financial ratios are used, which compare the business performance
across the years. Since such ratios are based on the particular business performance, they
can be used to compare the business with its competitors. This makes it easy to determine
is the business is outperforming the competitors, and thus identify the areas of
improvement.
In this analysis, two companies will be used; Apple Inc. and the Samsung
Corporation. These two companies are from the same industry; computer and similar
devices manufacturers as well as the related software. Financial statements were obtained
from their respective websites, for the purpose of this analysis. The charts negated from
the analysis will be attached at the appendix section. The analysis was based on the
following areas.
• Profitability of the company
To determine the profitability of each company, profitability ratios were used. The
results from each ratio are explained below. The trends over the last five years are shown
in Appendix II attached at the end of this report.
• Return on Assets
This study source was downloaded by 100000813193656 from CourseHero.com on 05-27-2021 09:26:22 GMT -05:00
https://www.coursehero.com/file/25288485/Apple-vs-Samsung-Financial-Analysisdocx/
This study resource was
shared via CourseHero.com
Paraphrase This Document
Need a fresh take? Get an instant paraphrase of this document with our AI Paraphraser

The analysis showed that Apple has a healthier return on assets. While the
return in assets for Apple was 20.45%, Samsung has a ROA of 9.02%.
This an indication that Apple obtained more than double in return of every
unit of Asset in the company during the financial year, compared to
Samsung.
• Gross margin profit
Based on the gross margin profit ratio, Apple was more profitable that
Samsung during their latest reported financial years. Apple reported a
gross margin profit of 40.06, while Samsung has a gross margin profit of
37.79.
• Operating margin
During the 2015-09 financial year, Apple reported an operating margin of
30.48. On the other hand, Samsung had an operating margin of 12.14.
Under this ratio, it is clear that Apple was more profitable compared to
Samsung.
• Return on equity
As per the latest reported financial year’s statements, Apple had a ROE
46.25, whereas Samsung had a ROE of 13.09. This is a clear indication
that Apple was more profitable on this indicator than Samsung.
• Liquidity
Liquidity is the ability of a firm to meet its short term obligations. A company
with a high liquidity is considered to be in a healthier financial status than that
which has a low liquidity ratio. The trends in liquidity of the two firms are shown
This study source was downloaded by 100000813193656 from CourseHero.com on 05-27-2021 09:26:22 GMT -05:00
https://www.coursehero.com/file/25288485/Apple-vs-Samsung-Financial-Analysisdocx/
This study resource was
shared via CourseHero.com

in appendix I.
• Current ratio
The current ratio for the Apple Company as reported in the latest financial
year was 1.11, while that of Samsung was 2.21. This shows that Samsung
was in a better position to meet its short—term obligations as compared to
the Apple Company.
• Quick ratio
Apple’s quick ratio in the latest reported financial year was 0.89, while
that of Samsung was 1.73. This shows that Samsung had a higher liquidity
than Apple.
• Financial leverage
Apple’s financial leverage was 2.43, while that of Samsung was 1.42. This
shows that Apple obtained much of its financing from Loans, which may
indicate a potential risk, in case of failure to generate profits from the
borrowed money. In that case, Samsung is in a healthier financial status
based on this measure.
• Measures of efficiency
The measures of efficiency evaluate the ability of the copay to generate revenue
from the assets. The trends in these ratios are shown in Appendix III.
• Asset turnover rate
The assets turnover rate reported by the Apple Company in its latest
financial statement was 0.89, whereas that of the Samsung Company was
This study source was downloaded by 100000813193656 from CourseHero.com on 05-27-2021 09:26:22 GMT -05:00
https://www.coursehero.com/file/25288485/Apple-vs-Samsung-Financial-Analysisdocx/
This study resource was
shared via CourseHero.com
⊘ This is a preview!⊘
Do you want full access?
Subscribe today to unlock all pages.

Trusted by 1+ million students worldwide

0.92. This shows that Samsung was slightly more efficient than Apple Inc.
however, the difference was small, and thus considering the trend over the
last year would add more information. The trend shows that Samsung has
been more efficient in utilizing its assets than Apple Inc.
• Receivables turnover rate
The receivable’s turnover for the Apple Company during the last reported
financial year was 13.62, whereas that of the Samsung Company was 7.84.
This shows that it took Apple more time for the goods sold on credit to be
paid for, as compared to the Samsung Company. From the efficiency point
of view, Samsung was more efficient compared to the Apple Company.
Recommendation/ Conclusion
From the analysis it was clear that Samsung Company outperformed the industry
frontrunner; Apple Inc. for this reason, if the Samsung company could identify the areas
in which it was outperformed by its competitor Apple and do something, it could emerge
a superpower. The analysis revealed that Apple was better in profitability, and thus
Samsung should work to uplift its levels of profitability. This can be achieved by
reducing the COGs, which remain higher, compared to those incurred by the Apple
Company.
Appendix: I – Liquidity comparison charts
Apple: https://www.stock-analysis-on.net/NASDAQ/Company/Apple-
This study source was downloaded by 100000813193656 from CourseHero.com on 05-27-2021 09:26:22 GMT -05:00
https://www.coursehero.com/file/25288485/Apple-vs-Samsung-Financial-Analysisdocx/
This study resource was
shared via CourseHero.com
Paraphrase This Document
Need a fresh take? Get an instant paraphrase of this document with our AI Paraphraser

Inc/Ratios/Liquidity#Ratios-Summary
Apple vs Samsung: http://www.nasdaq.com/article/samsung-vs-apple-a-financial-
comparison-cm270771
Samsung:
Apple:
Appendix III: Efficiency measures
http://financials.morningstar.com/ratios/r.html?t=SSNLF
Samsung:
Apple:
Appendix II: Profitability ratios as %
http://time.com/3840414/samsung-apple-market-share/
Samsung:
Apple:
This study source was downloaded by 100000813193656 from CourseHero.com on 05-27-2021 09:26:22 GMT -05:00
https://www.coursehero.com/file/25288485/Apple-vs-Samsung-Financial-Analysisdocx/
This study resource was
shared via CourseHero.com

This study source was downloaded by 100000813193656 from CourseHero.com on 05-27-2021 09:26:22 GMT -05:00
https://www.coursehero.com/file/25288485/Apple-vs-Samsung-Financial-Analysisdocx/
This study resource was
shared via CourseHero.com
Powered by TCPDF (www.tcpdf.org)
https://www.coursehero.com/file/25288485/Apple-vs-Samsung-Financial-Analysisdocx/
This study resource was
shared via CourseHero.com
Powered by TCPDF (www.tcpdf.org)
⊘ This is a preview!⊘
Do you want full access?
Subscribe today to unlock all pages.

Trusted by 1+ million students worldwide
1 out of 6
Related Documents

Your All-in-One AI-Powered Toolkit for Academic Success.
+13062052269
info@desklib.com
Available 24*7 on WhatsApp / Email
Unlock your academic potential
Copyright © 2020–2025 A2Z Services. All Rights Reserved. Developed and managed by ZUCOL.