Applied Advanced Analytics: Monte Carlo and Bootstrap Sampling Report

Verified

Added on  2023/03/17

|14
|1452
|66
Report
AI Summary
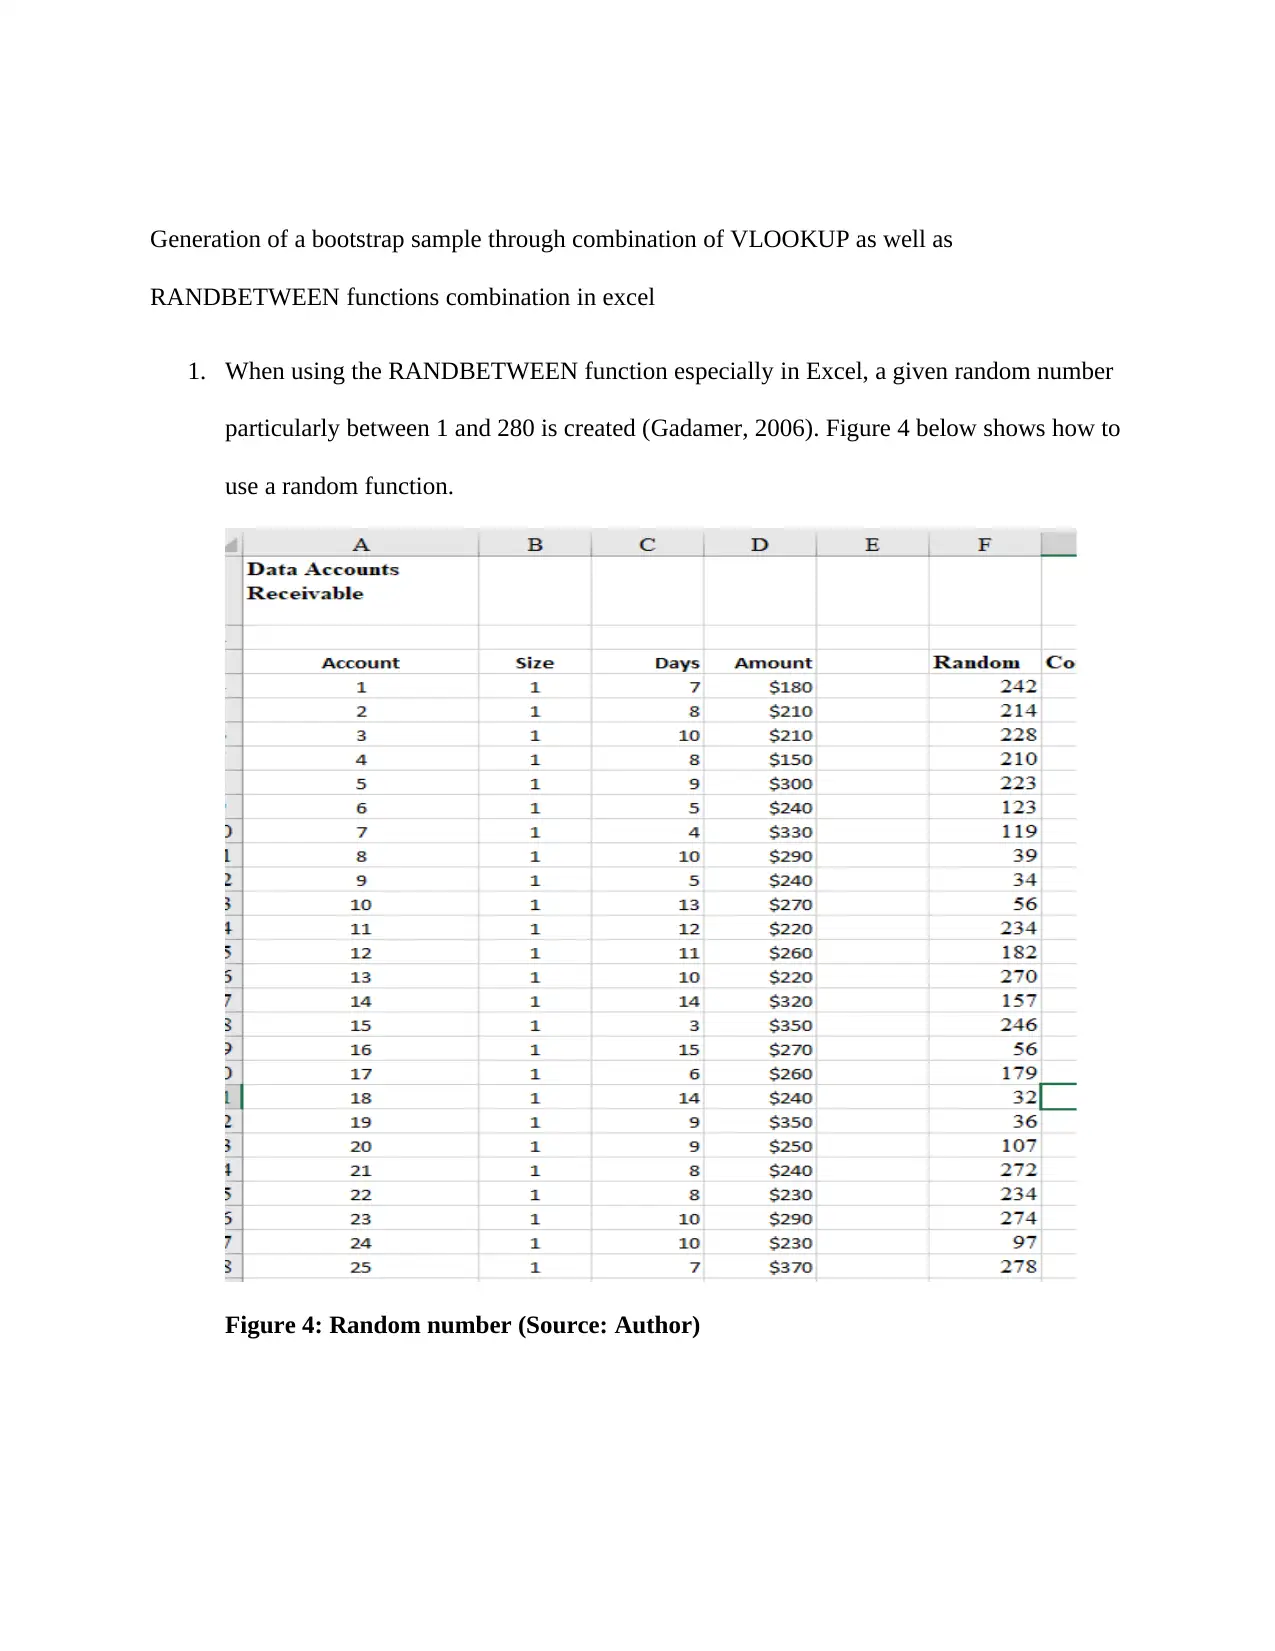
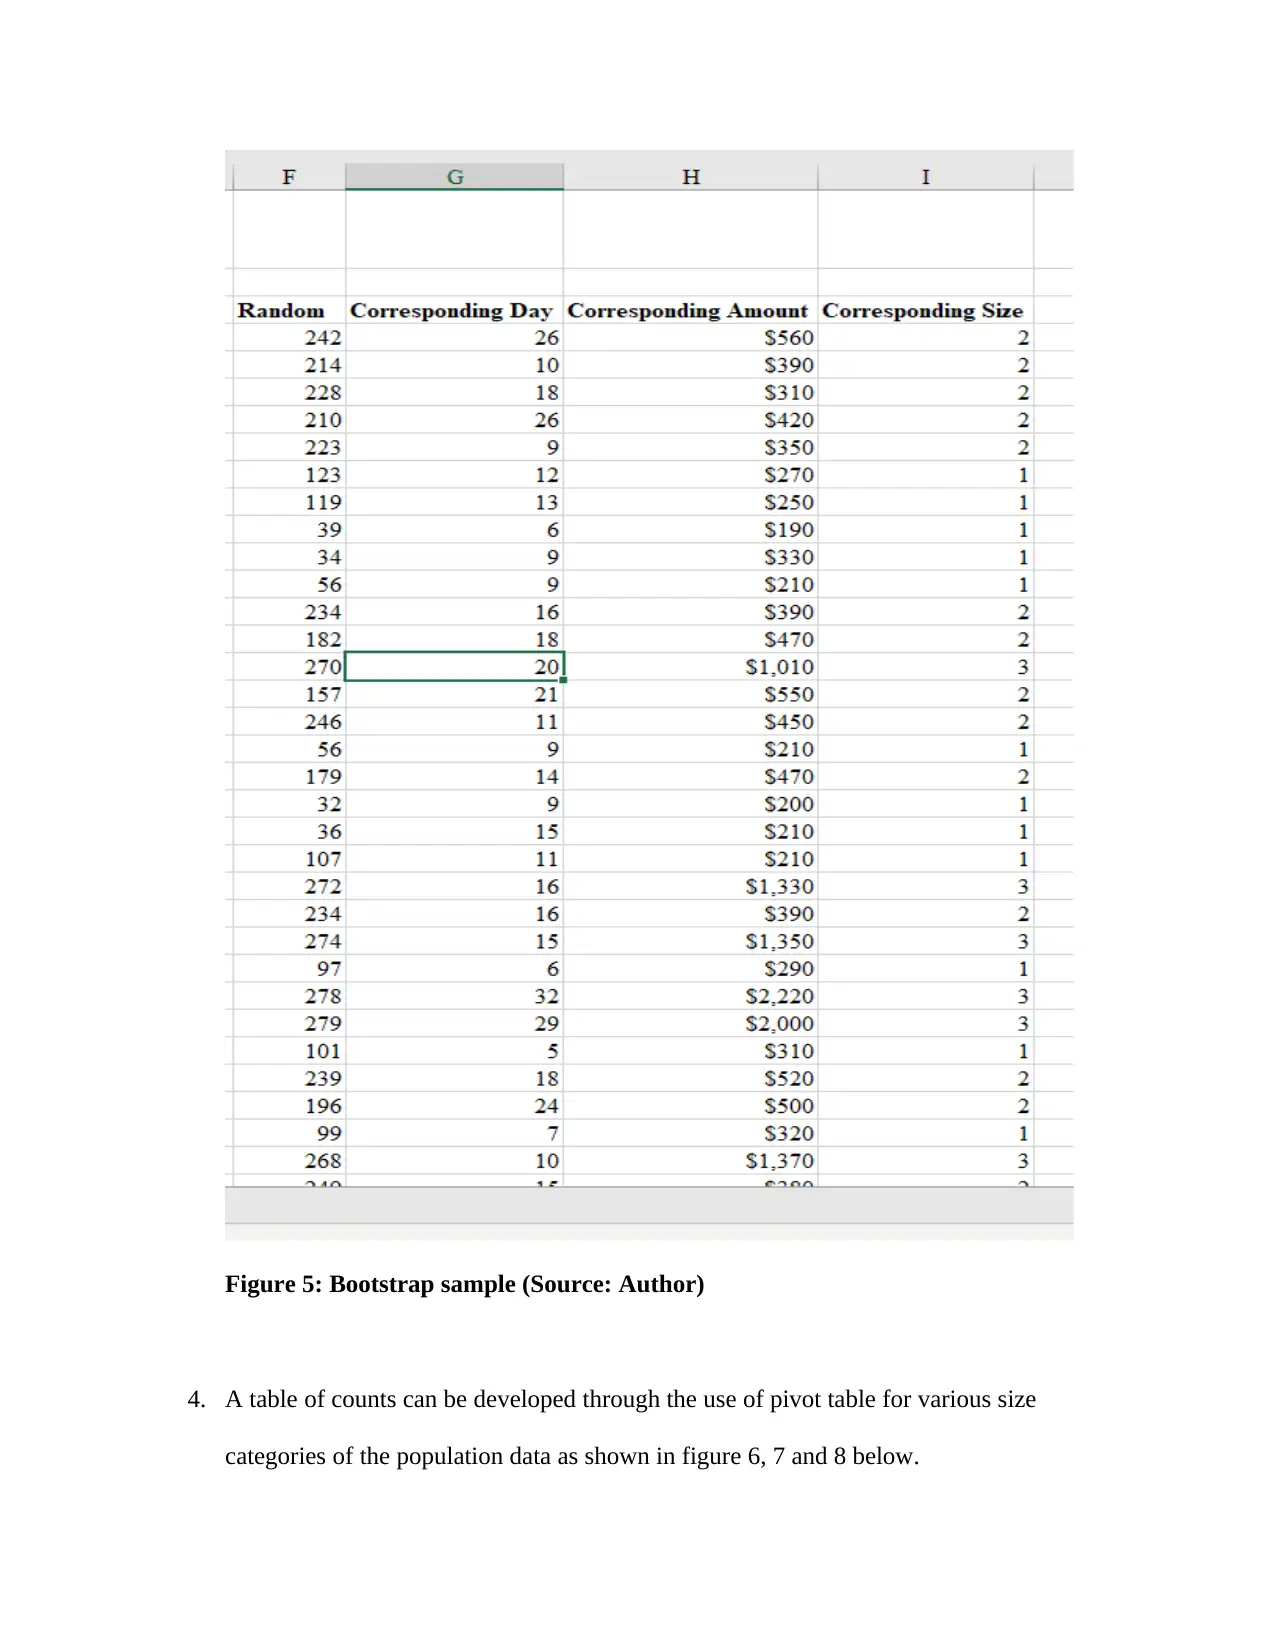
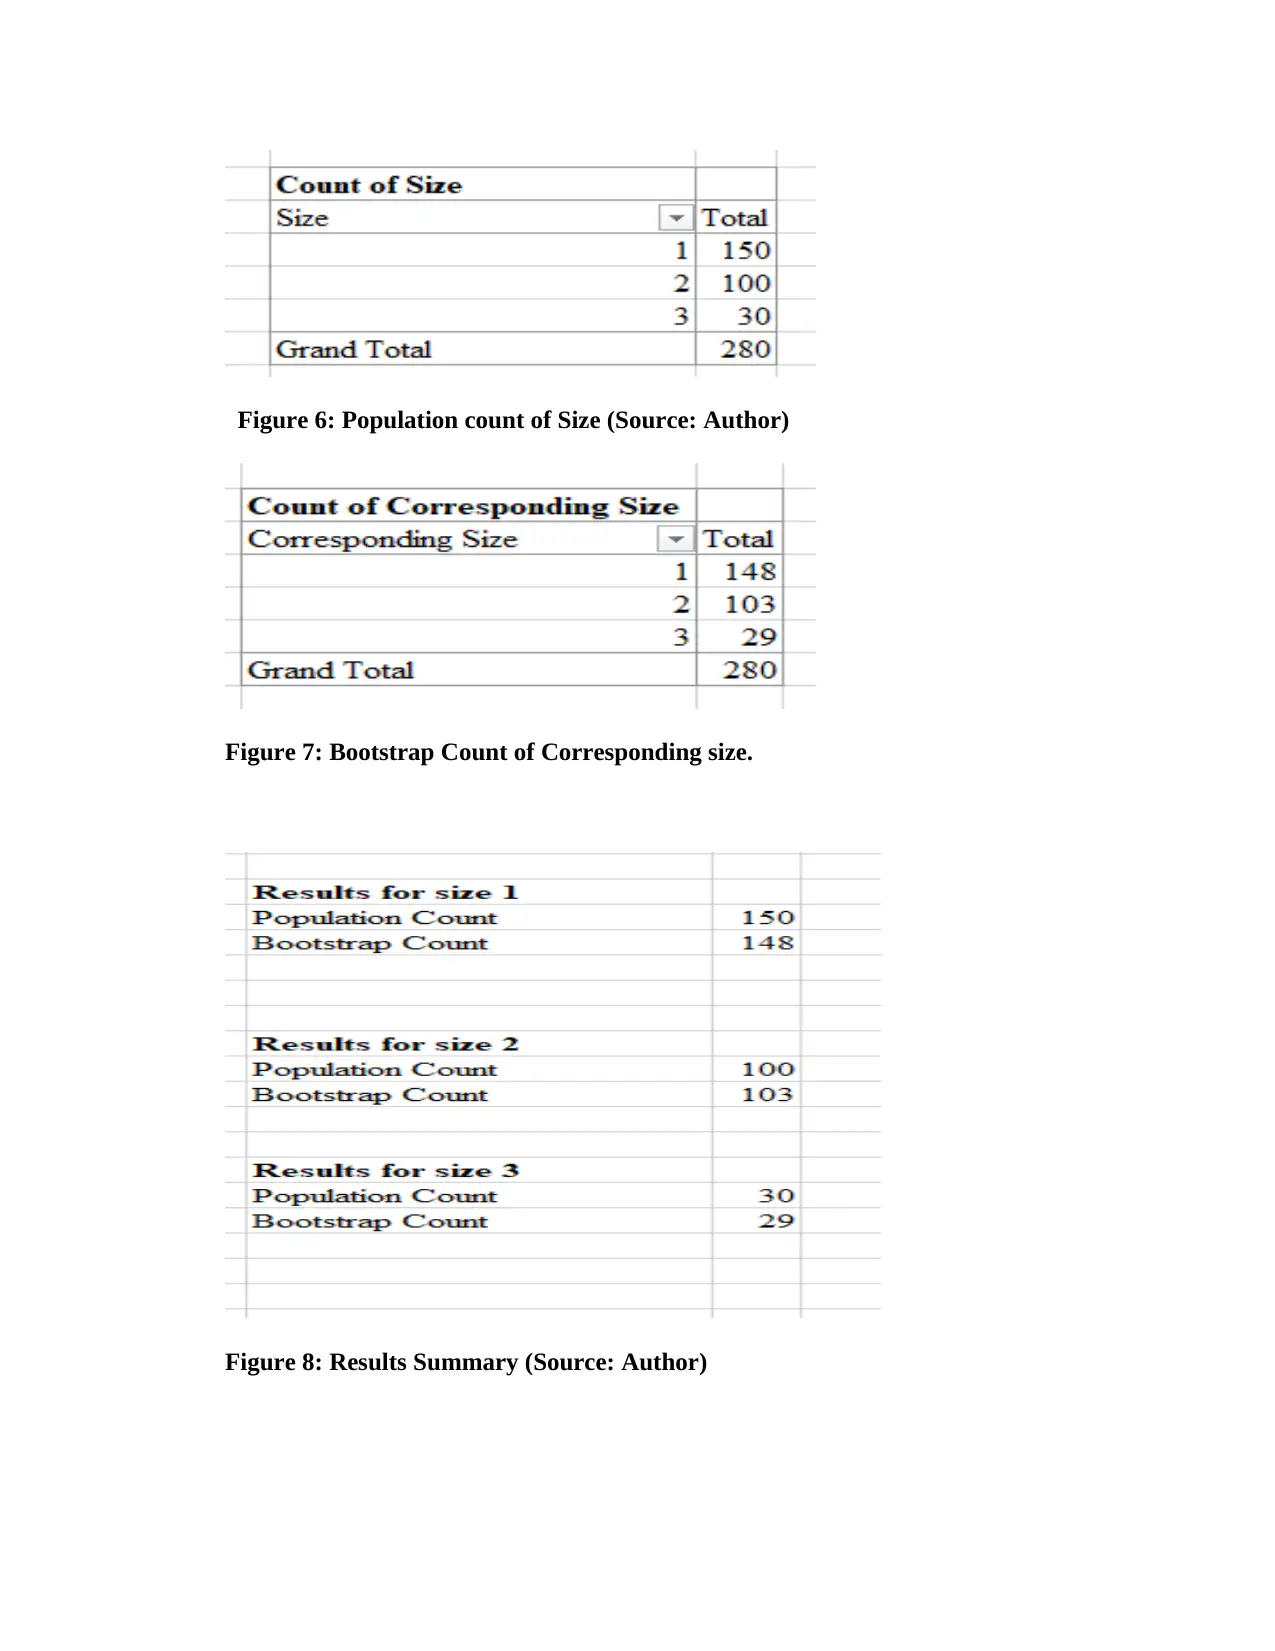
This report explores data sampling techniques, focusing on probability sampling, Monte Carlo simulation, and Bootstrap simulation within the context of applied advanced analytics. The introduction highlights the increasing reliance of businesses on data analytics for decision-making and growth, emphasizing the importance of analyzing populations and samples to identify trends and predict performance. The report then delves into probability sampling methods, including simple random sampling, and contrasts it with quota sampling, explaining the advantages of random sampling. The core of the report covers Monte Carlo and Latin Hypercube simulations, detailing their application in assessing risks and uncertainties, particularly in financial and project management sectors. It describes the process of generating random numbers and the benefits of Latin Hypercube sampling. The report concludes by explaining the bootstrap simulation technique, which is used for resampling data, and demonstrates its application using a sample accounts receivable dataset. The analysis includes the generation of bootstrap samples using Excel functions, the creation of count tables via pivot tables, and the calculation of mean and standard deviation for both the bootstrap sample and the original population data. The conclusion reiterates the importance of data sampling techniques in analyzing large populations and making informed decisions, emphasizing the need for measurable, goal-oriented, and practical sampling designs. The references provided support the methods and concepts discussed.
Document Page
Applied Advanced Analytics
Name
Institutional Affiliation
tabler-icon-diamond-filled.svg

Paraphrase This Document

Need a fresh take? Get an instant paraphrase of this document with our AI Paraphraser
Document Page
Table of Contents
Introduction 3
Probability Sampling 3
Monte Carlos Simulation 4
Bootstrap Simulation Sampling 6
Conclusion 12
Reference 13
Document Page
Introduction
Currently, the use of data analytics has continuously been basic. Most companies depend
on data and it guides their decisions for development as well their growth. Data analytics is also
used to analyze populations and samples of population and it is subsequently essential in
assessing potential trends. The results from analysis are helpful in predicting and enhancing
company’s performance (Albright & Winston, 2017).The paper does not only discuss the
application of data sampling techniques but also describe the subsequent importance of data in
the current business organizations. Data sampling can be described as the analysis of an entire
population by observing a segment or sample of the whole population (Emory, & William,
1976). The analysis normally focuses on the behavior and characteristics of the given population.
The method for sampling uses probability and non-probability sampling techniques and
moreover, a good sampling design must be measurable, goal oriented, cheap to handle and must
also be practical.
Probability Sample
One of the probability sampling technique is simple random. It involves all samples
exhibiting equal chance to be selected and they include for instance, drawing of the card,
throwing of the die, tossing a coin to determine the sample selection procedure (Parkinson,
&Drislane, 2011). Tossing a coin and using the head to determine sample selection is one among
the best and efficient sampling methods since it do not involve difficult processes (Festinger,
Leon &, Katz, Daniel 1976).
The procedures involved when using simple random sampling technique include
Defining of the population from which to draw the sample
Document Page
Justification as a proper criteria to approve the selected sample size
The population listing
Units Selection o
Random numbers fixing
Sample Selection
Quota sampling on the other hand, is a not a probability sampling methods and its usage
is common when surveying the population with small samples. When using Quota sampling, the
researchers must select the samples as provided by the fixed quota. The population is divided
into smaller groups after which the researcher ascertains the proportion of the samples to be
chosen from the smaller groups established (Sharon, 2010). Samples from each subgroup is
selected with the consideration of the proportion. Simple random sampling however, is in many
case rated high as compared to quota sampling technique and this is because it employs the
probability techniques to gather the sample respondents. Besides, the sample selected through
quota sampling is prone to biasness. Due to this, simple random sampling remains to be the best
method.
Monte Carlo Simulation and Latin Hypercube Sampling
Monte Carlo Simulation method employed probability method which in many instances is
used in the determination of the effects of risks and uncertainty (Hunter, &Dantzker, 2011).The
technique appears to be so common in financial organizations and in the project management
sectors alongside other models designed for forecasting(Albright & Winston, 2017).
Part (a) Monte Carlo Sampling
In a Monte Carlo sampling, RAND () function is useful in creating random numbers with a 1000
column. Notably, without freezing the values; a uniform distribution between 0 and 1 is
tabler-icon-diamond-filled.svg

Paraphrase This Document

Need a fresh take? Get an instant paraphrase of this document with our AI Paraphraser
Document Page
applicable. For instance, the use of COUNTIF function aid in counting the values of the digits
between 0 and 1 as well as between 0.1 and 0.2 progressively. However, each given interval
must contain all values of about 1/10.
Figure 1: Random sample
Document Page
Figure 2: Range (Source: Author)
Part (b) Latin Hypercube Sampling
Repeat part (a), by generating a second random numbers column. However, generate the first
100 values as uniform particularly at a range of 0 to 0.1. As well, in the next 100 values as
uniform create values within the range of 0.1 to 0.2 up to 0.9-1. Notably, a formula like
0.5+0.1*RAND() is useful in creating a random that is uniformly distributed like 0.5 to 0.6
Document Page
Figure 3: Random Sample of Latin Hypercube Sampling (Source: Author)
Figure 5: Latin Hypercube Sampling Range (Source: Author)
It is worth noting that, Latin Hypercube sampling is advantageous since they provide
sample distributions that are more uniform for every distribution as compared to Monte Carlo
tabler-icon-diamond-filled.svg

Paraphrase This Document

Need a fresh take? Get an instant paraphrase of this document with our AI Paraphraser
Document Page
sampling. Besides, Latin Hypercube sampling technique is capable of reducing noise especially
when the results in question depends on either two or multiple uncertain quantities which have
effects that are comparable on the result.
Bootstrap Simulation
In the events when bootstrap is used, the data should be resampled will appropriate
replacement(Albright & Winston, 2017). The use of bootstrap technique is mostly common with
researchers attempting to analyze statistics on a population with aspects like standard deviation
and mean (Houser, 2008).
Bootstrap Simulation on the Data Sample Accounts Receivable
Figure 3: Original
Data Sample (source:
Author)
Document Page
Generation of a bootstrap sample through combination of VLOOKUP as well as
RANDBETWEEN functions combination in excel
1. When using the RANDBETWEEN function especially in Excel, a given random number
particularly between 1 and 280 is created (Gadamer, 2006). Figure 4 below shows how to
use a random function.
Figure 4: Random number (Source: Author)
Document Page
2. Construction of the Corresponding columns particularly through VLOOKUP function
use.
Corresponding size, Corresponding day, as well as Corresponding amount.
3. A Sample of a bootstrap sample developed in the range F3: I283 is shown in figure 5
below.
tabler-icon-diamond-filled.svg

Paraphrase This Document

Need a fresh take? Get an instant paraphrase of this document with our AI Paraphraser
Document Page
Figure 5: Bootstrap sample (Source: Author)
4. A table of counts can be developed through the use of pivot table for various size
categories of the population data as shown in figure 6, 7 and 8 below.
Document Page
Figure 6: Population count of Size (Source: Author)
Figure 7: Bootstrap Count of Corresponding size.
Figure 8: Results Summary (Source: Author)
chevron_up_icon
1 out of 14
circle_padding
hide_on_mobile
zoom_out_icon
[object Object]