Assessment 1: Applied Business Research Data Analysis
VerifiedAdded on 2023/01/16
|21
|3914
|42
Report
AI Summary
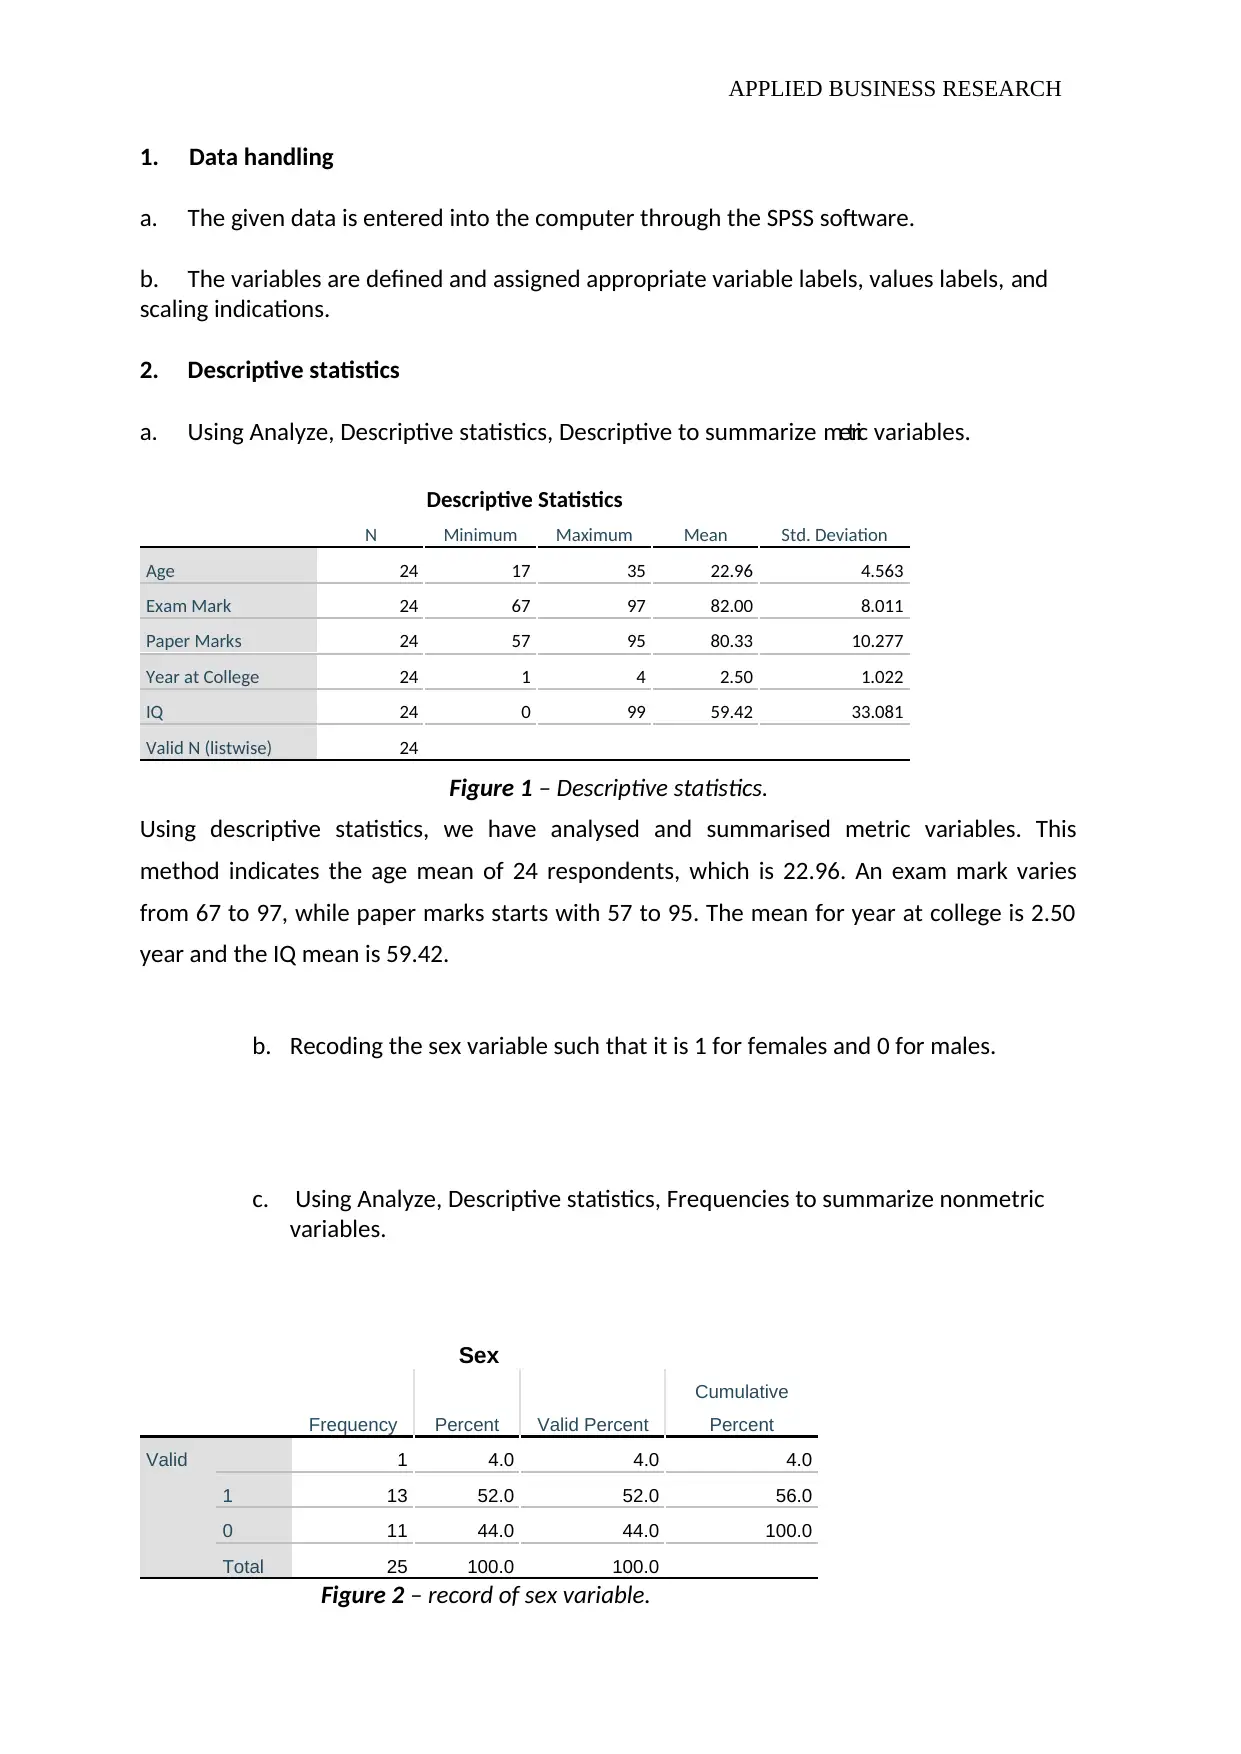
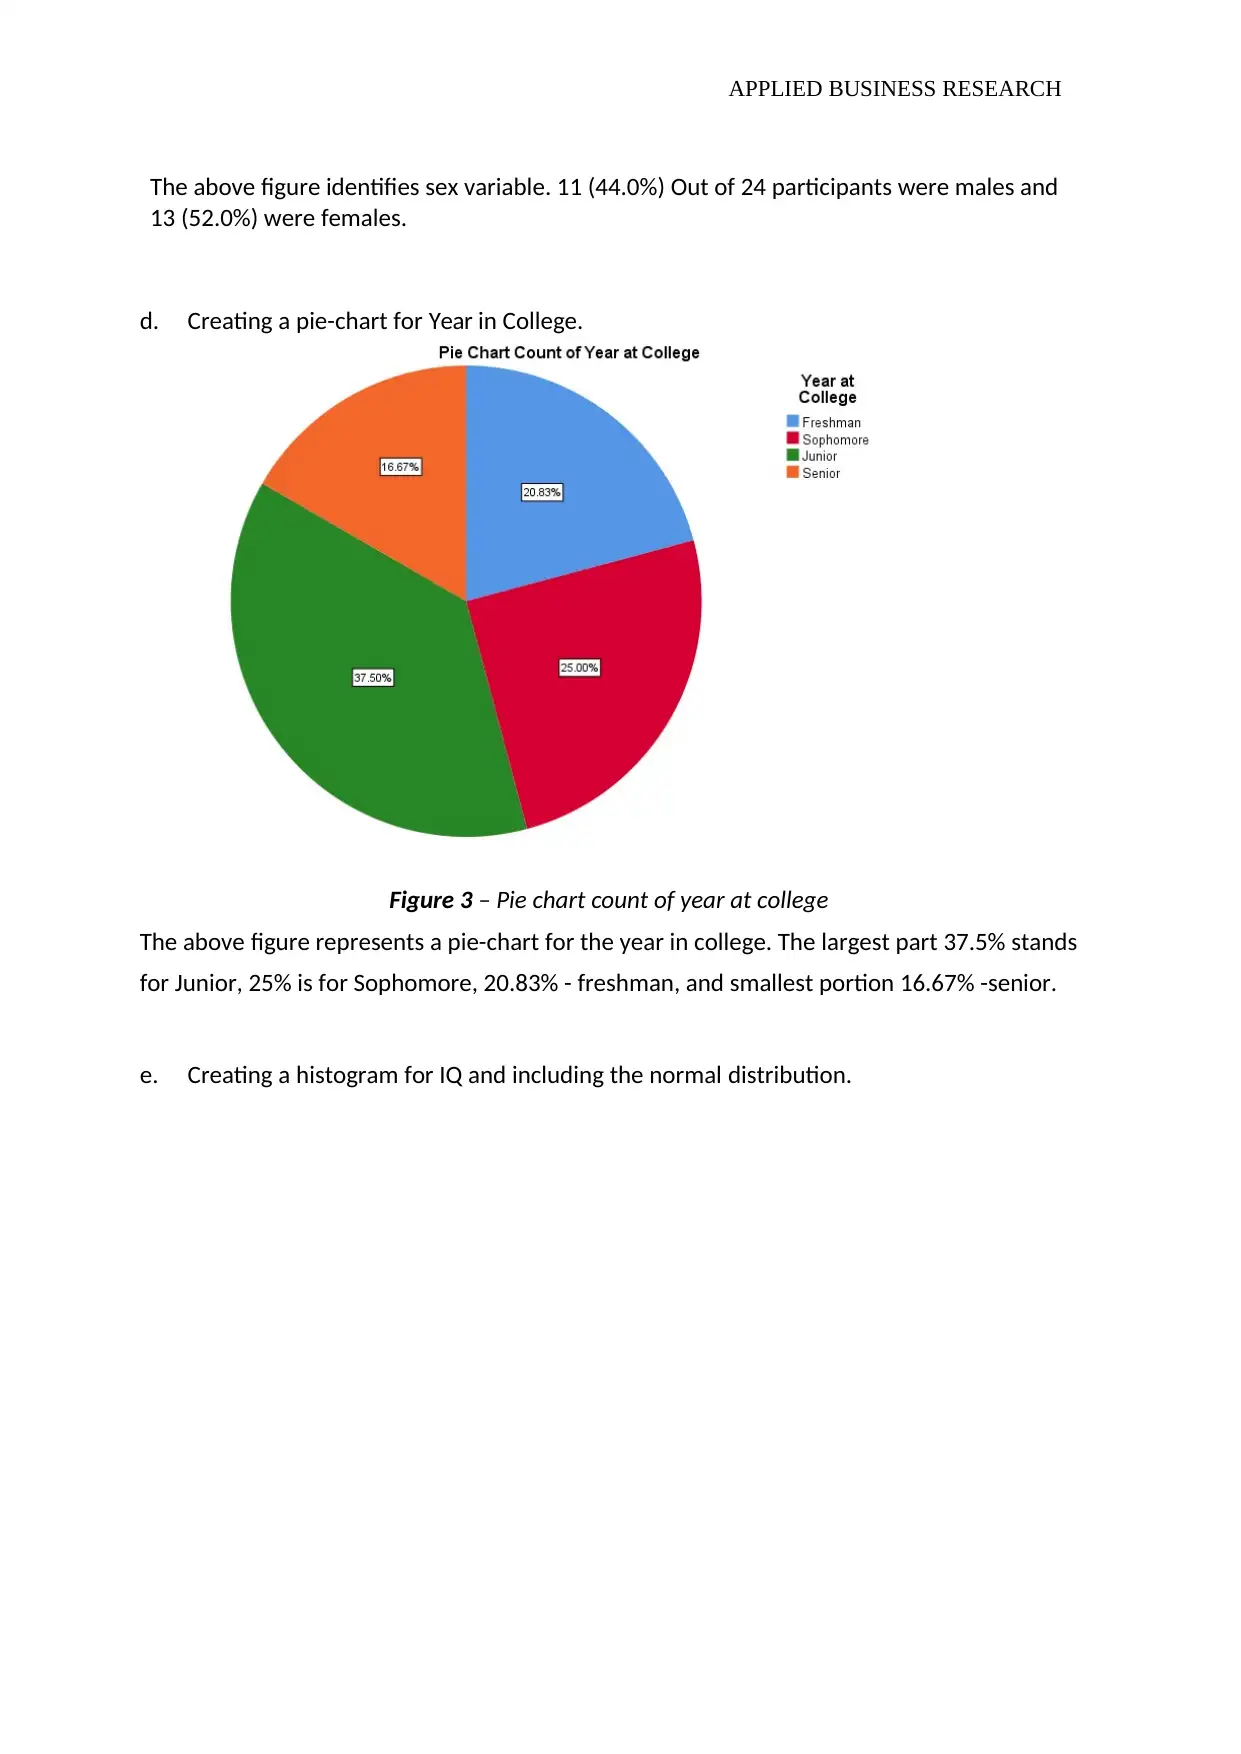
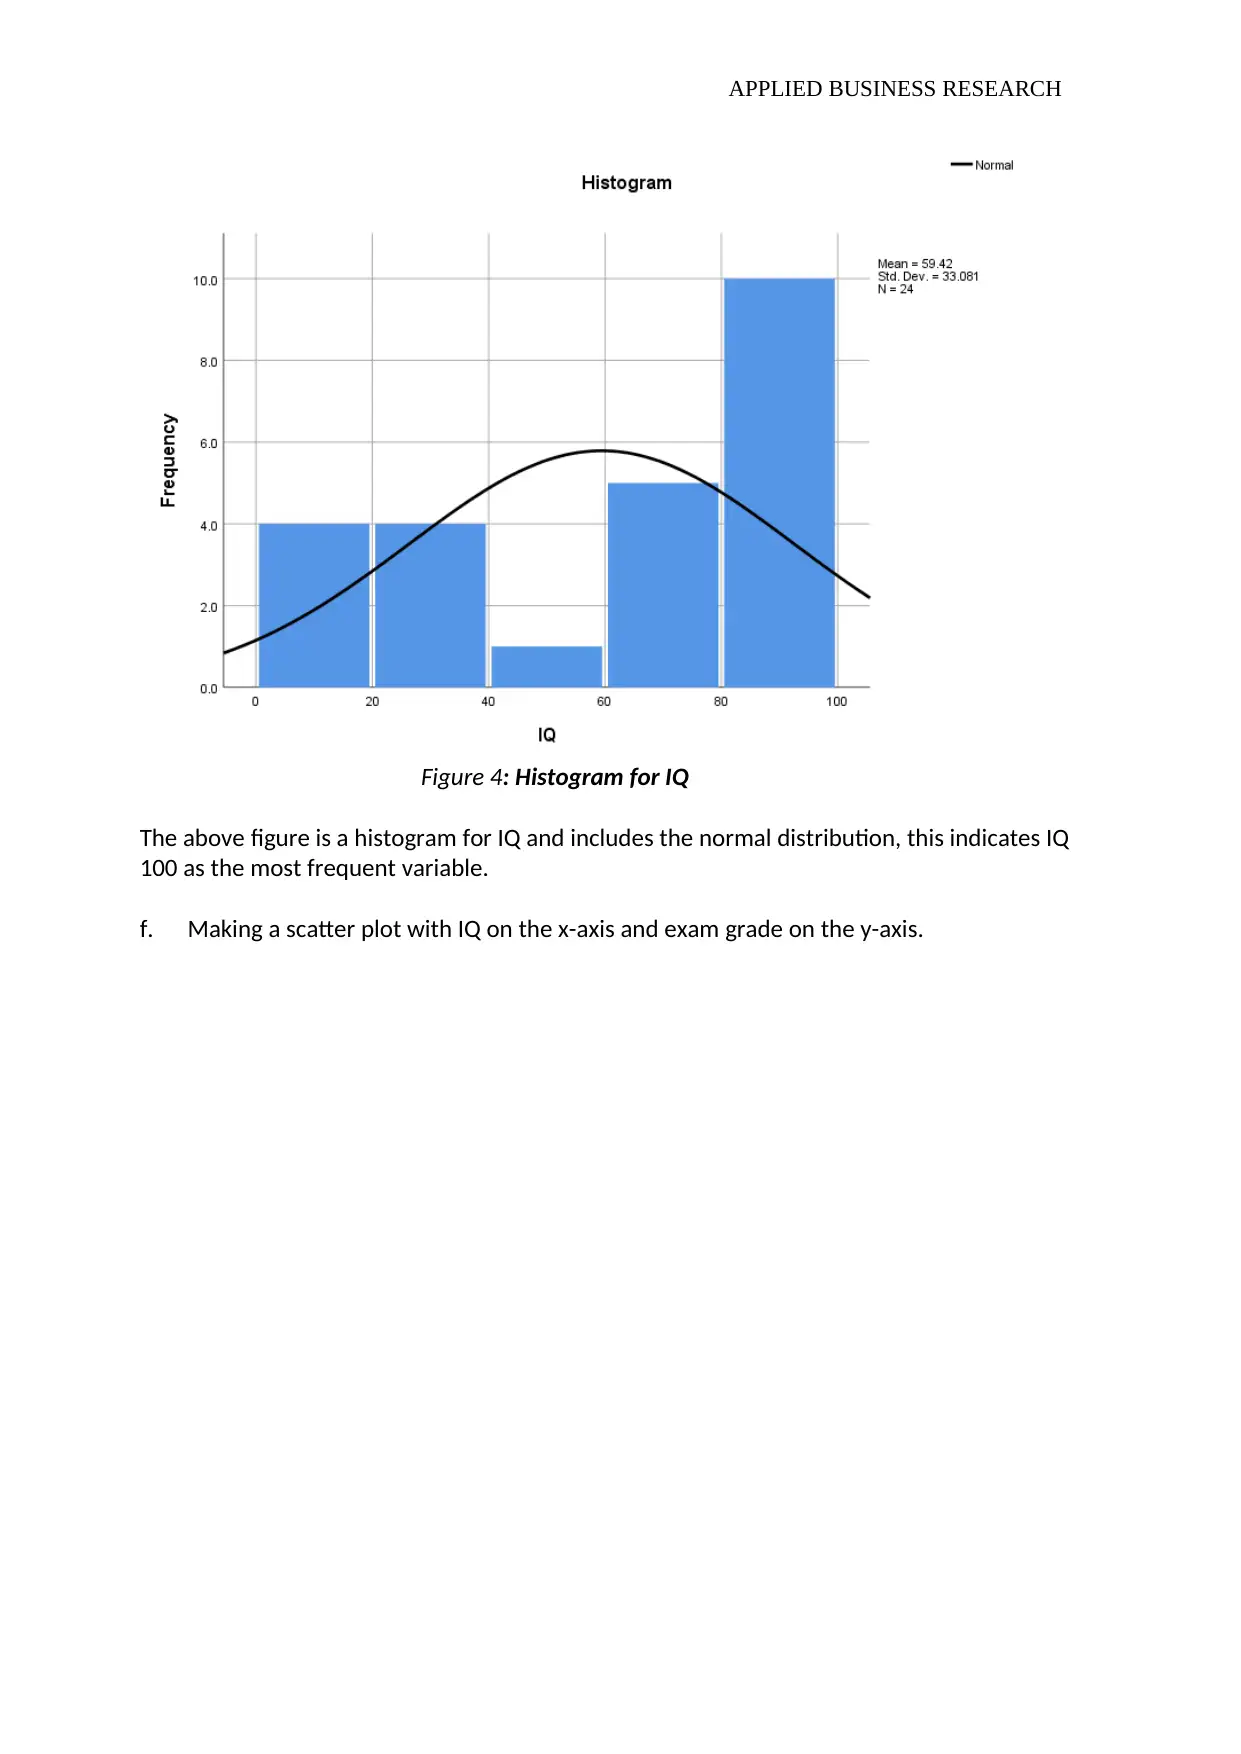
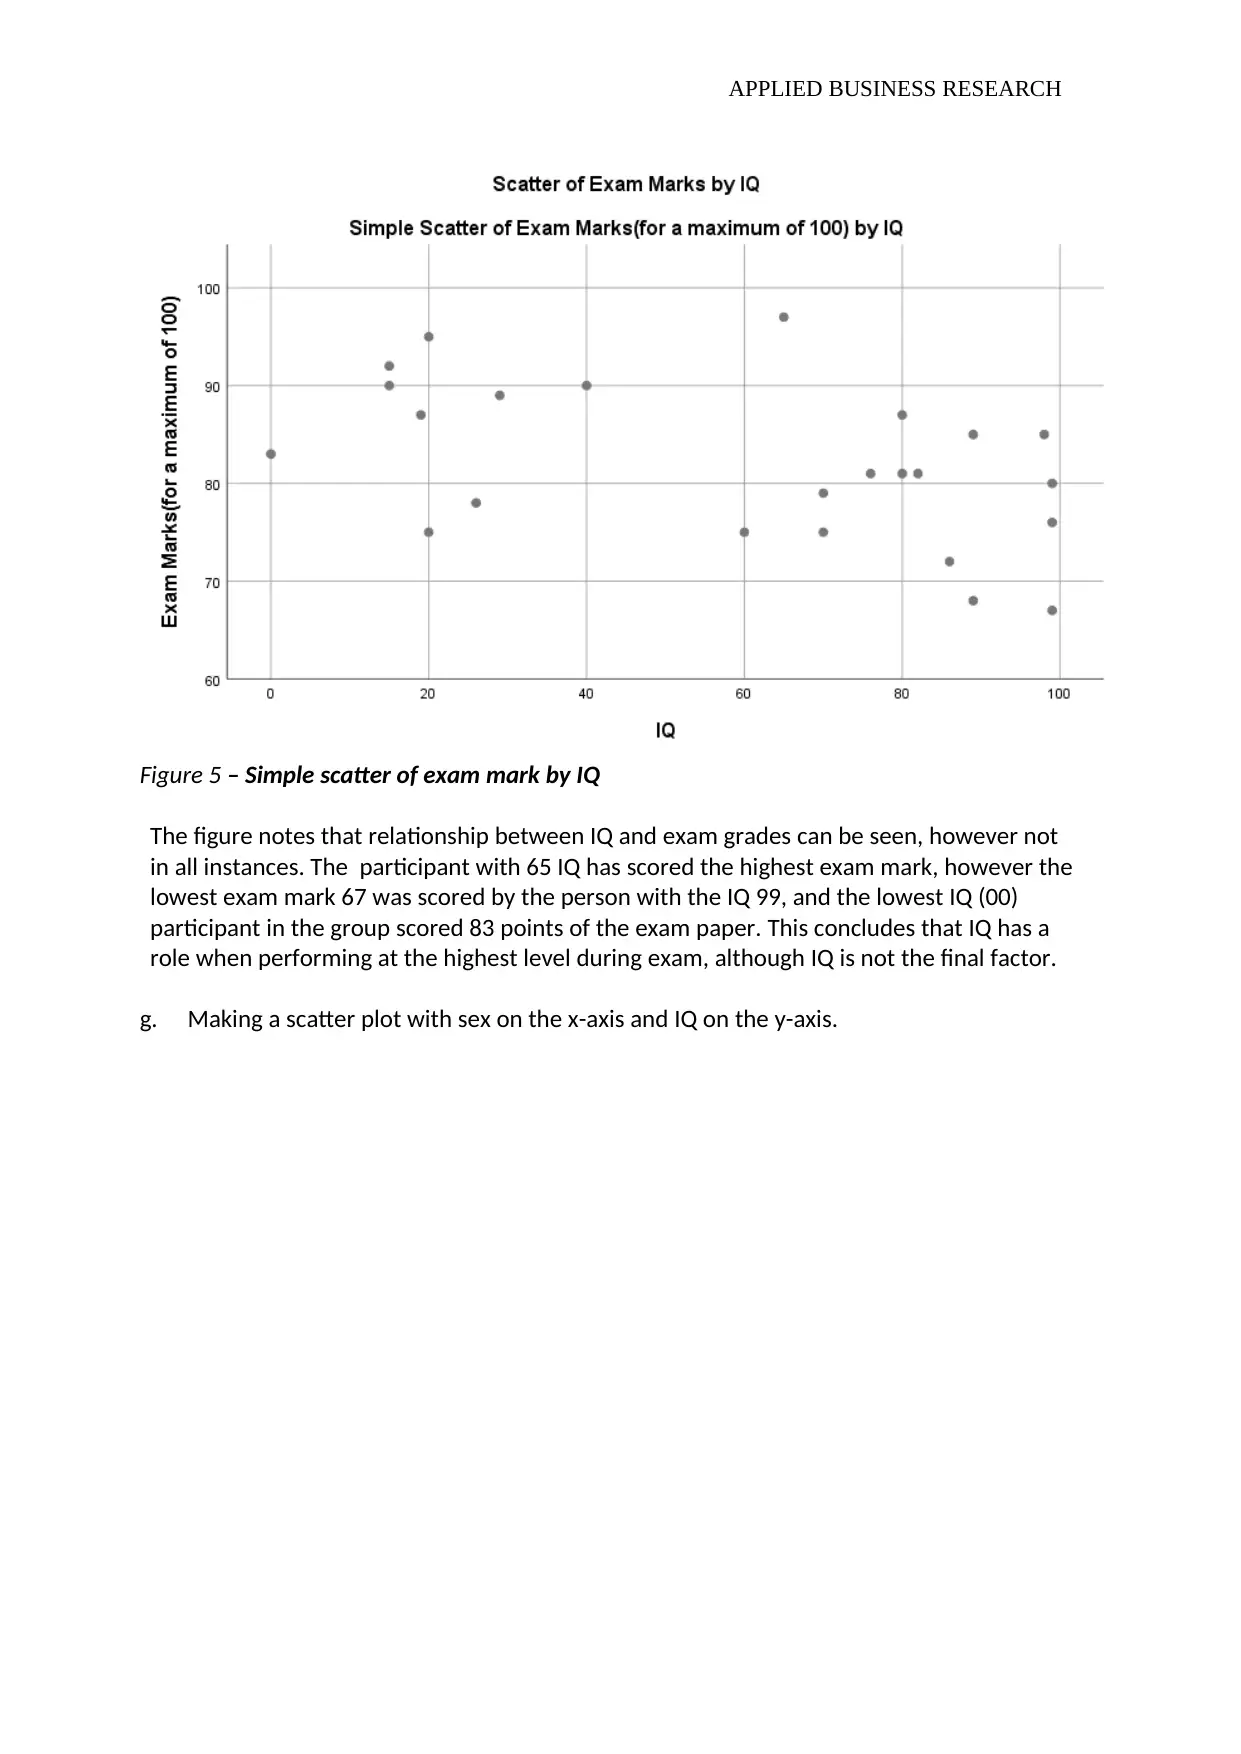
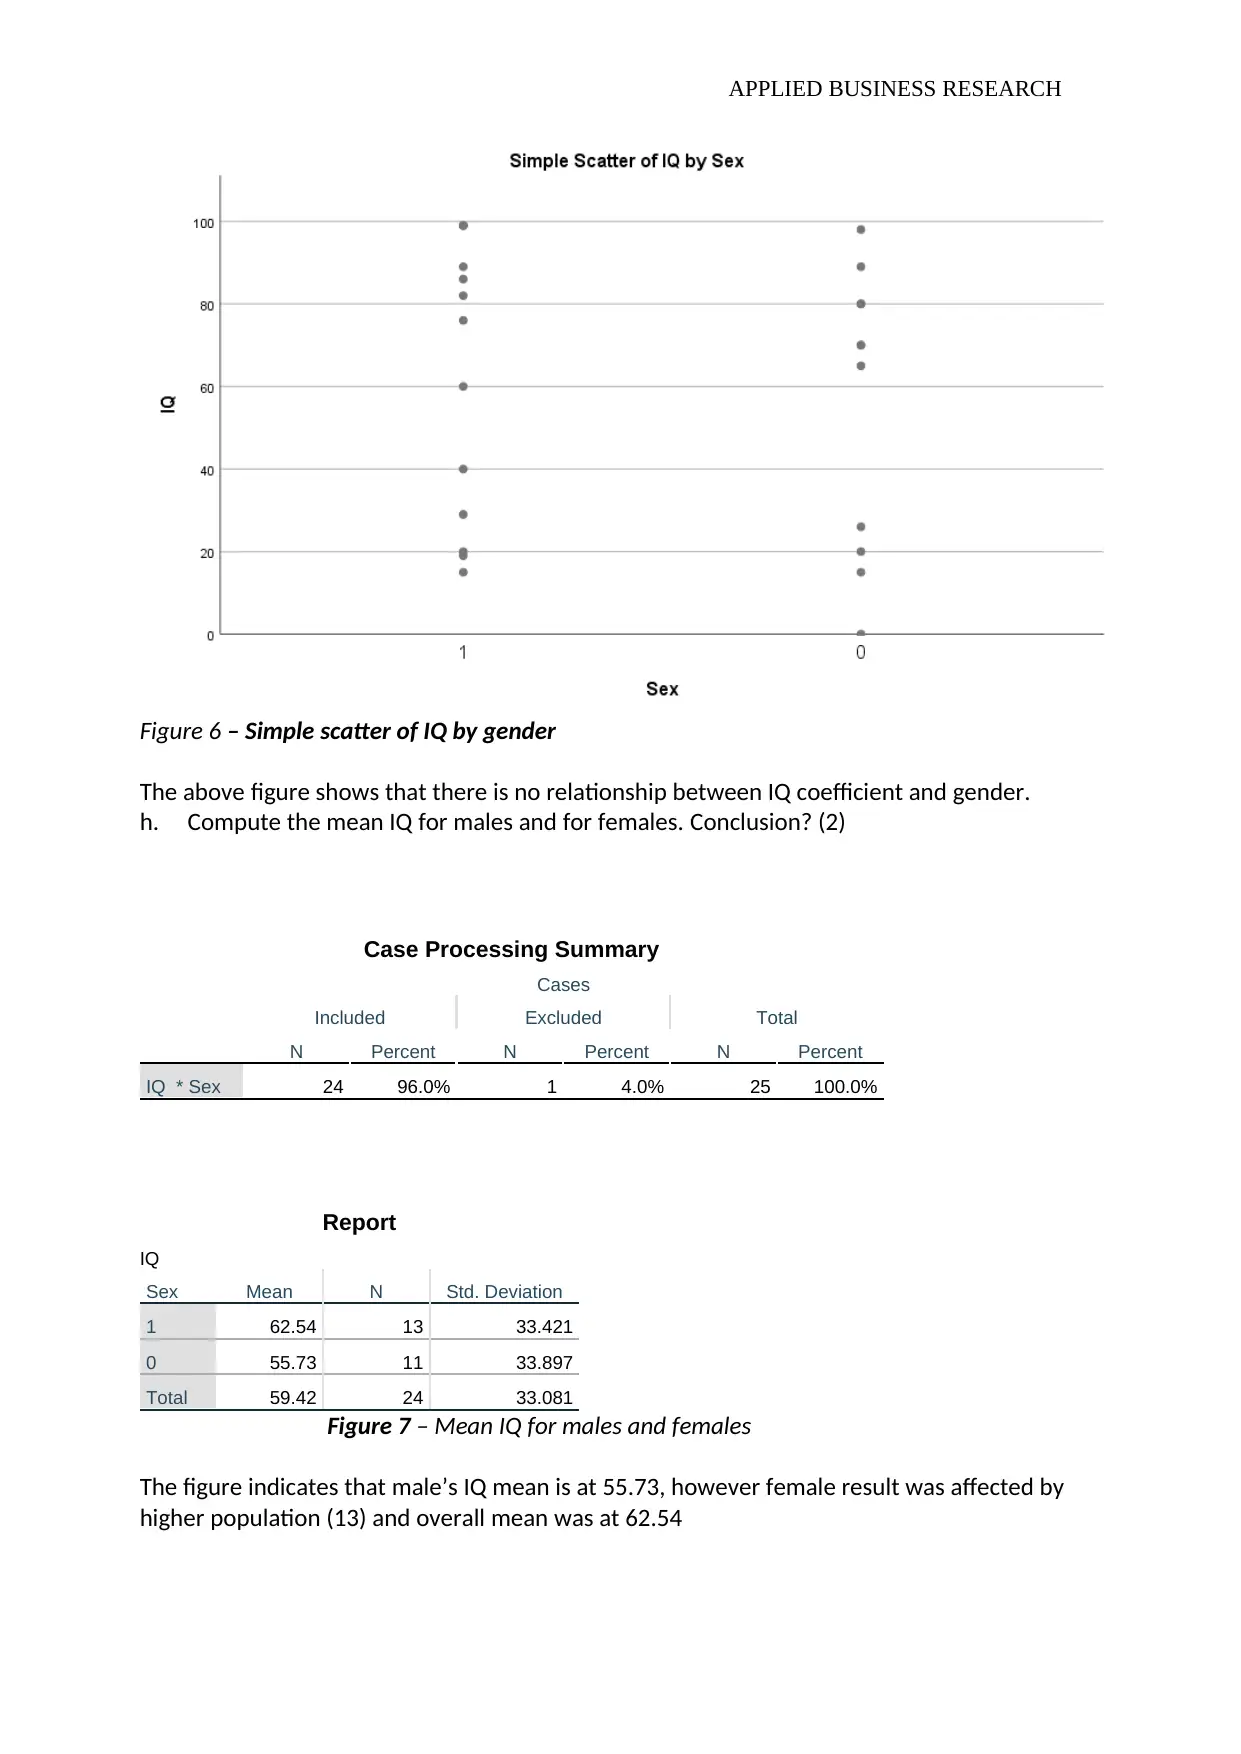
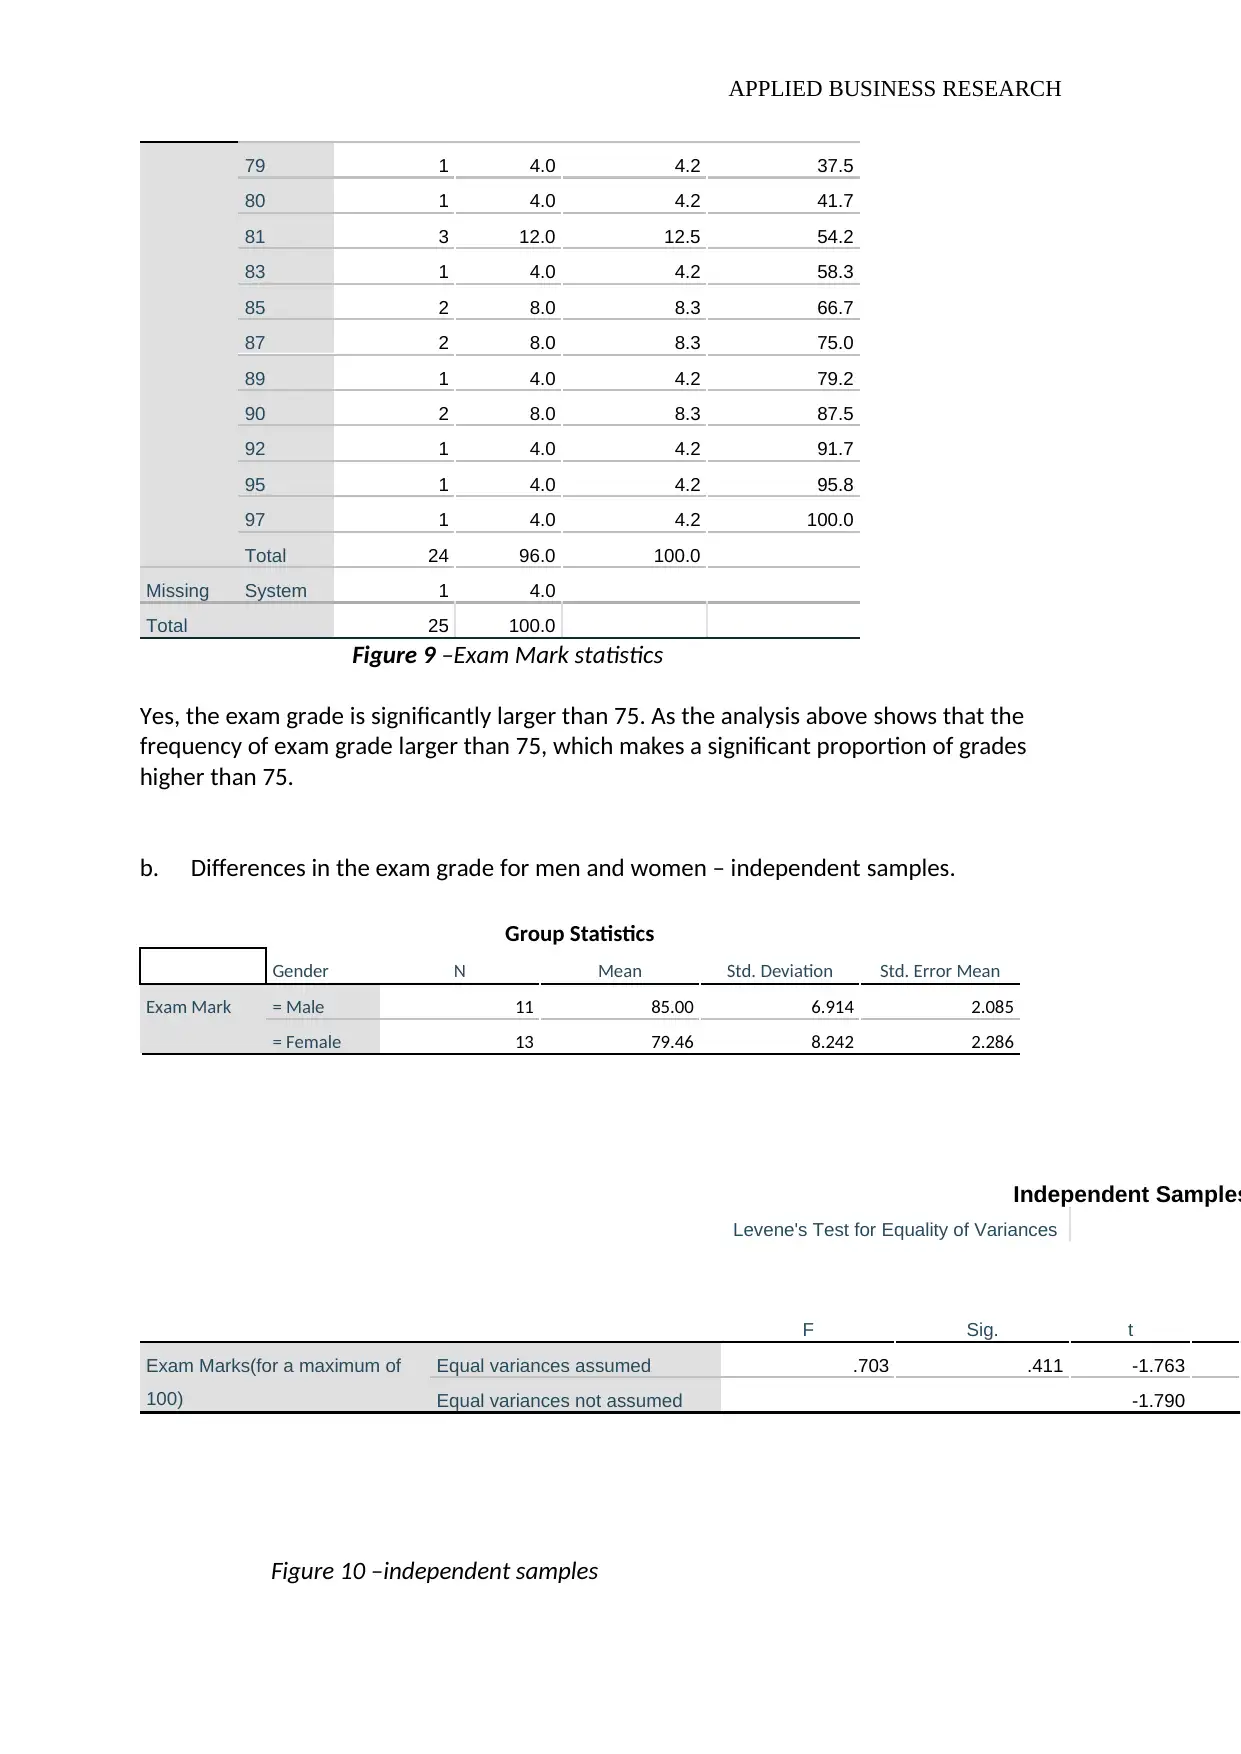
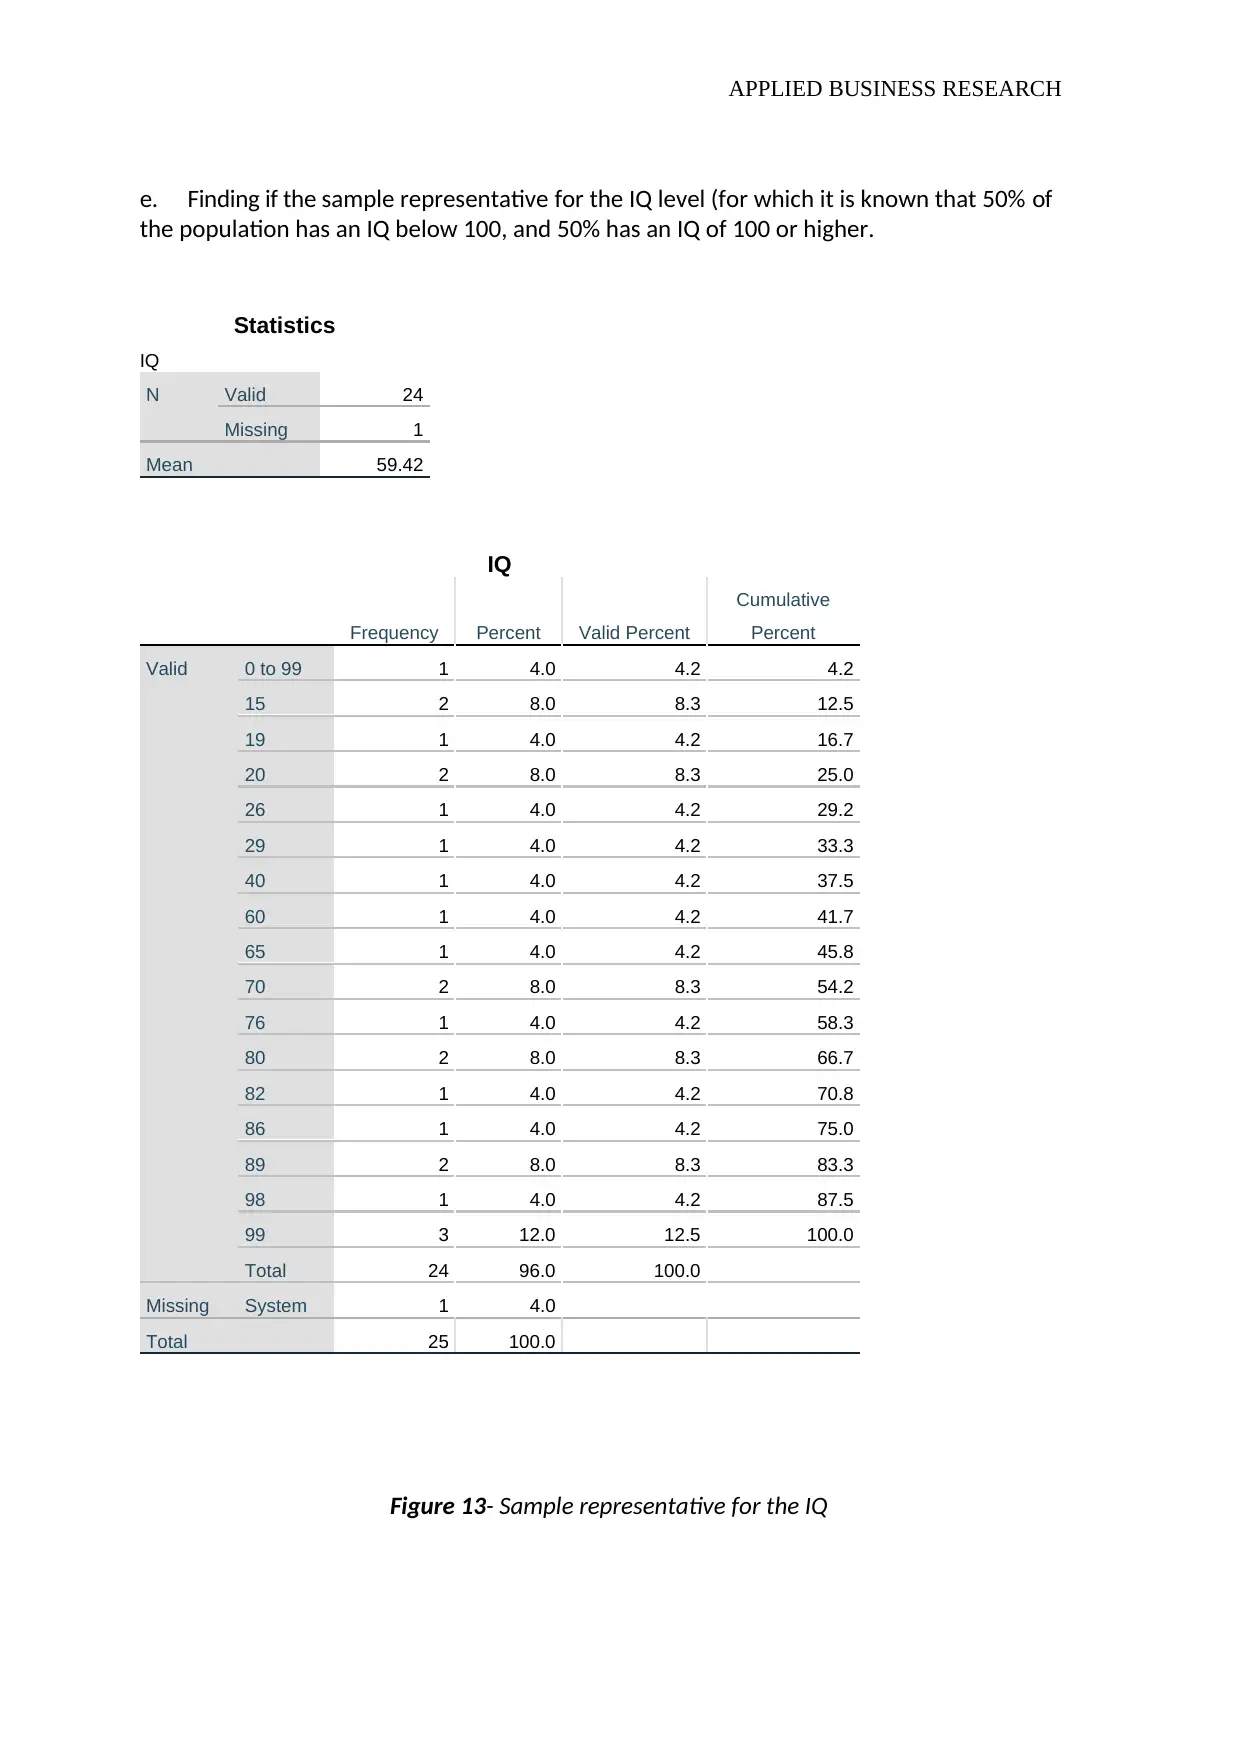
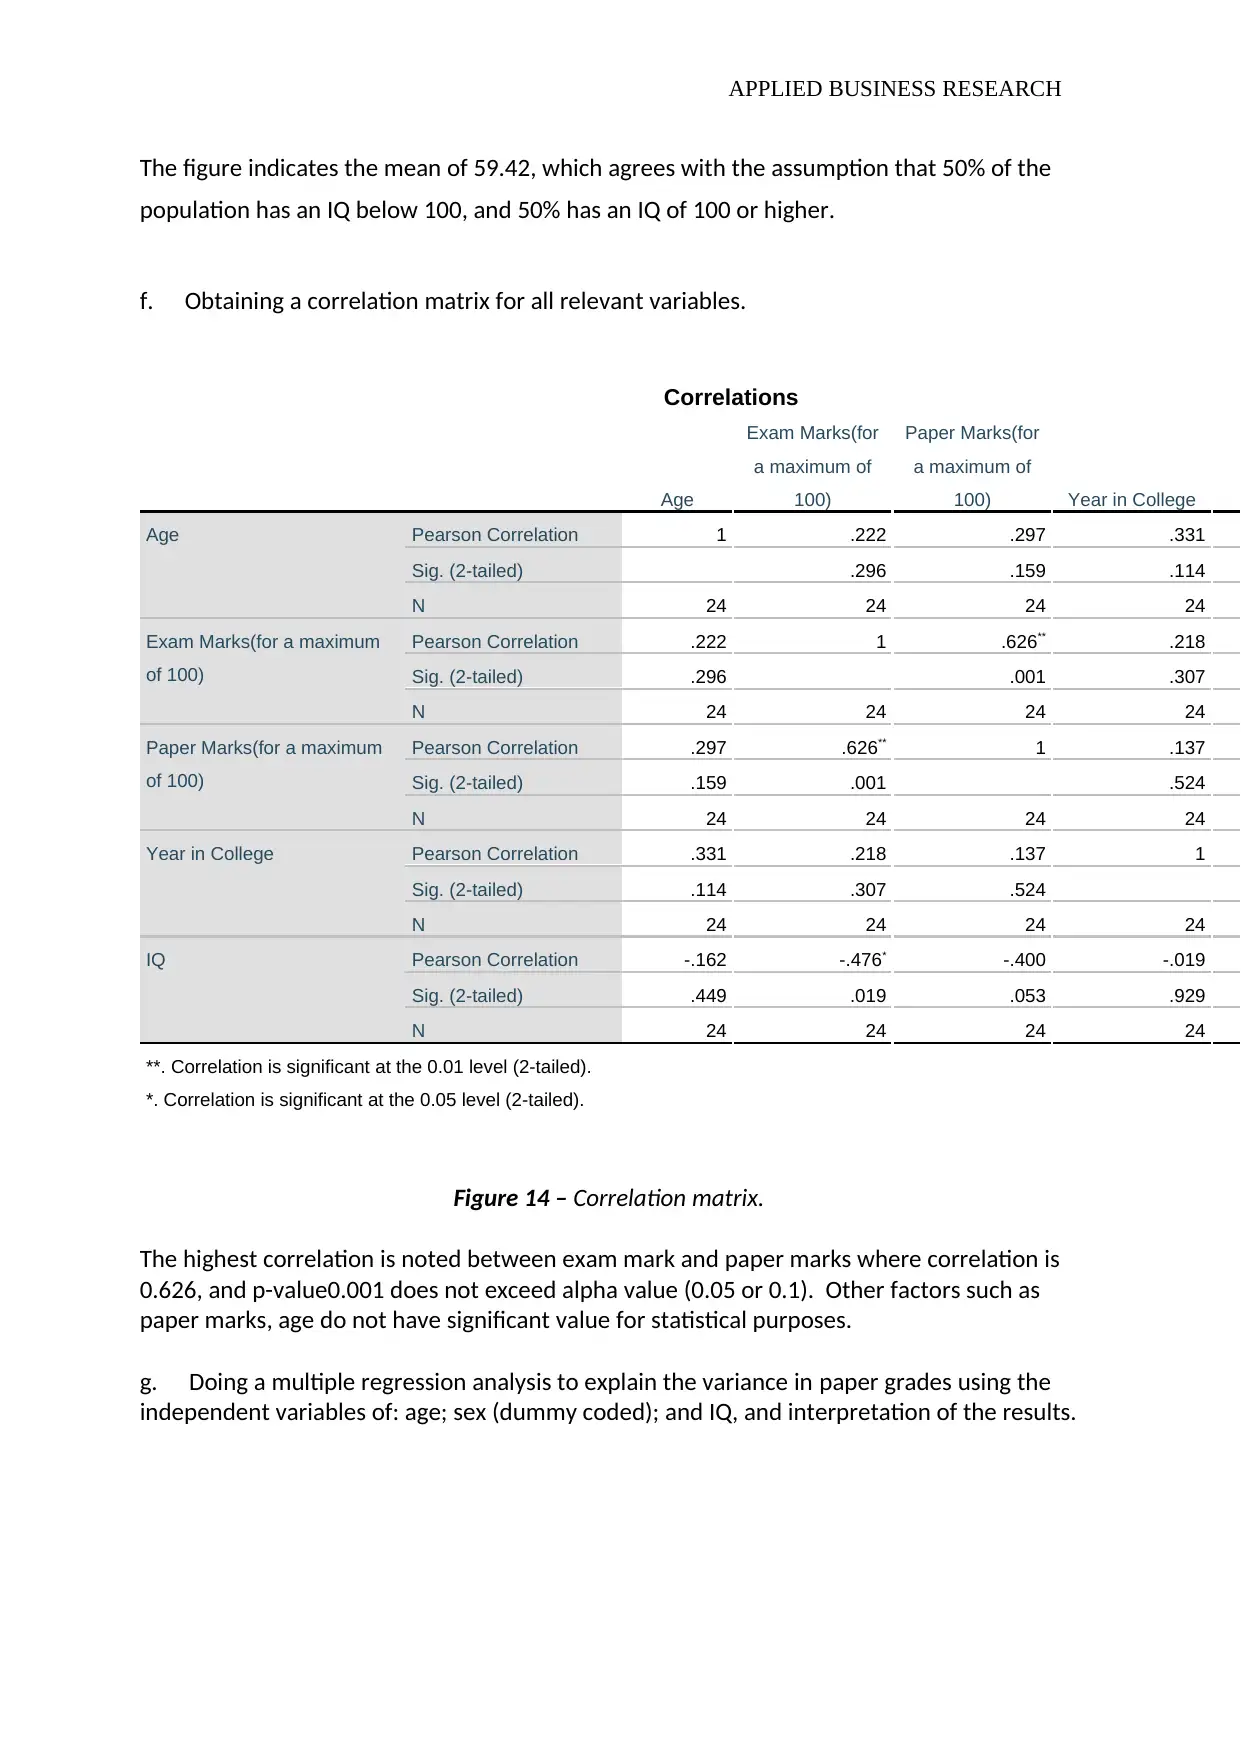
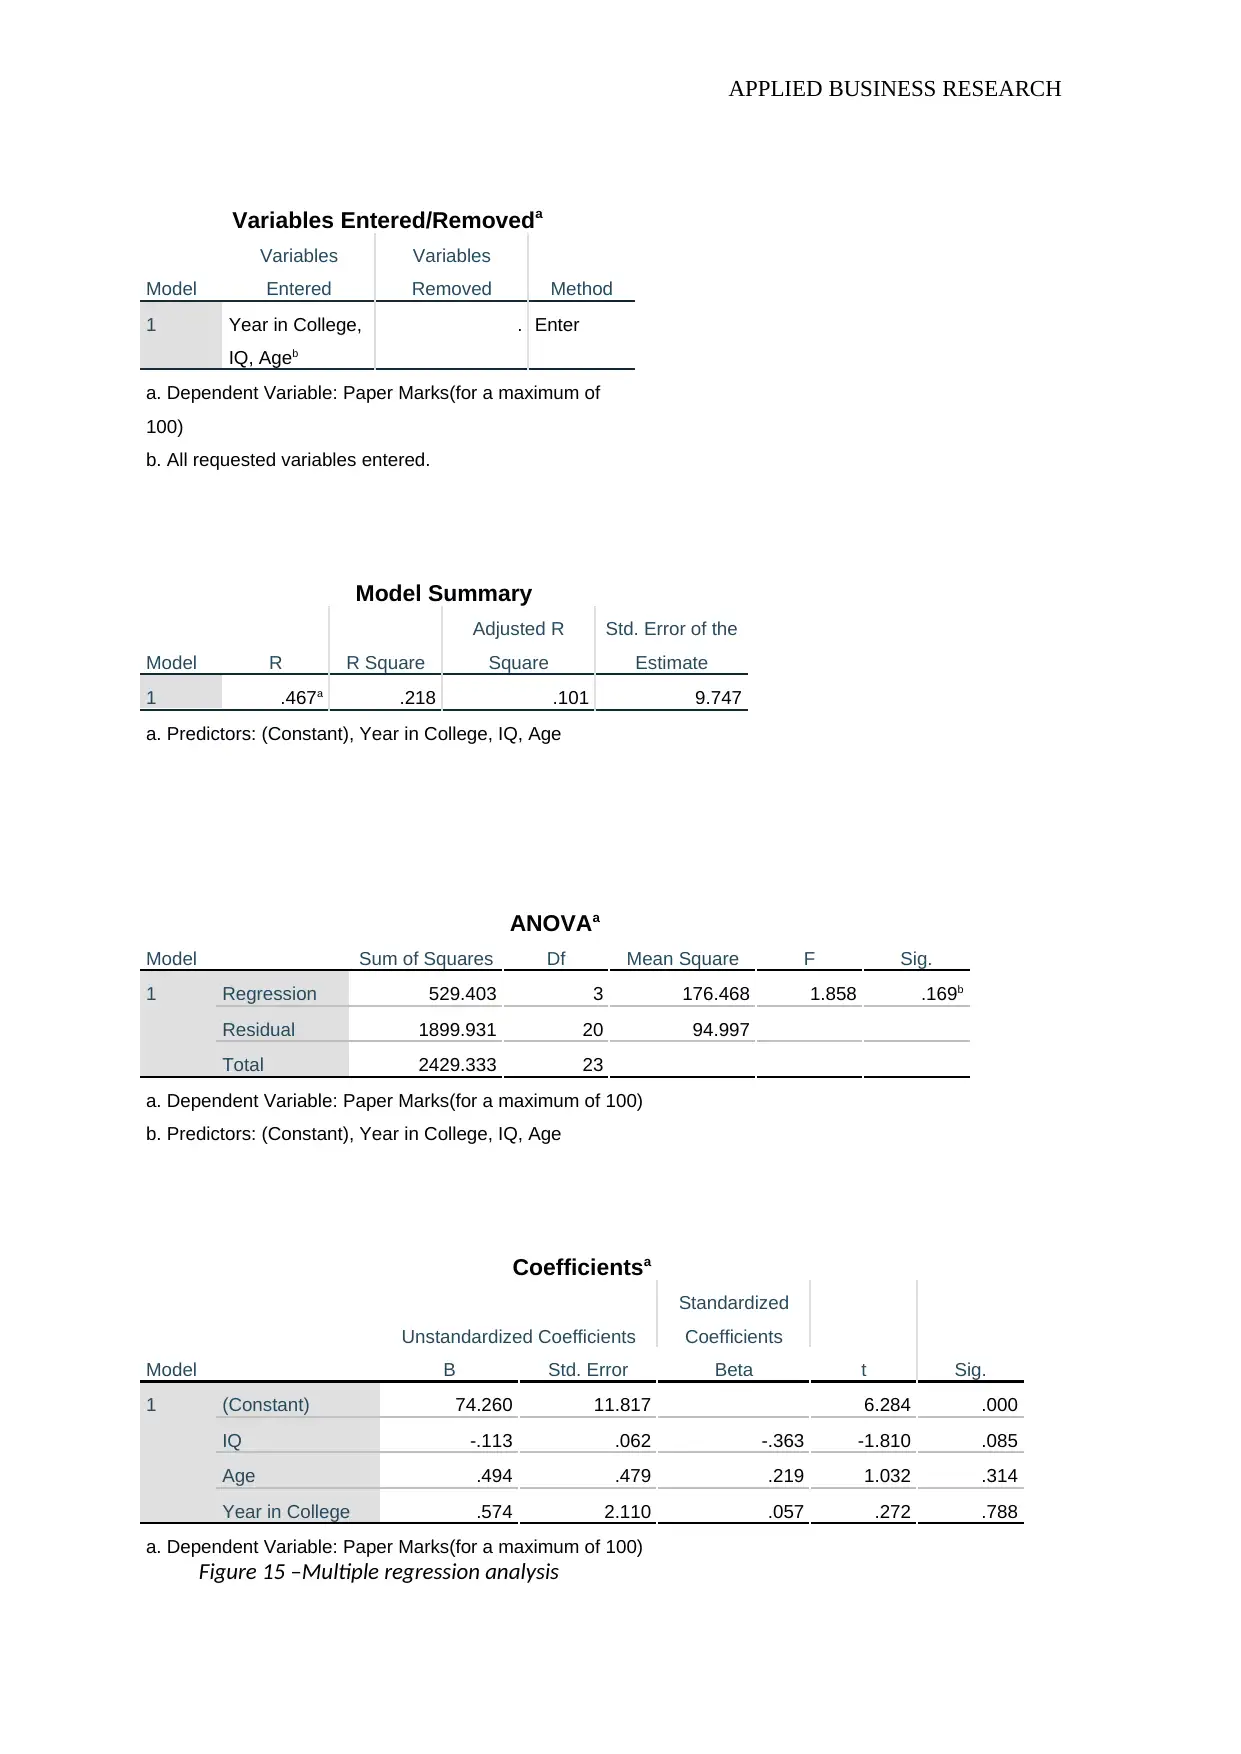
This report presents an analysis of business research data, encompassing both quantitative and qualitative methodologies. The quantitative section utilizes SPSS software to perform descriptive statistics, analyze variable relationships, and conduct regression analysis. Key findings include summaries of metric and non-metric variables, creation of charts and histograms, and the exploration of relationships between variables such as IQ, exam grades, and gender. The report also examines differences in exam and paper grades across different groups. Furthermore, the qualitative aspect involves content analysis of interview transcripts, identifying themes and patterns related to corporate culture assessment. The analysis includes the creation of a dummy variable for IQ, and a correlation matrix for relevant variables to explain the variance in paper grades using age, sex and IQ. The report concludes with a multiple regression analysis to explain the variance in paper grades, with interpretation of the results and key findings.

APPLIED BUSINESS RESEARCH
Assessment 1
Data Analysis
Submitted by:
Assessment 1
Data Analysis
Submitted by:
Paraphrase This Document
Need a fresh take? Get an instant paraphrase of this document with our AI Paraphraser

APPLIED BUSINESS RESEARCH
1. Data handling
a. The given data is entered into the computer through the SPSS software.
b. The variables are defined and assigned appropriate variable labels, values labels, and
scaling indications.
2. Descriptive statistics
a. Using Analyze, Descriptive statistics, Descriptive to summarize metric variables.
Descriptive Statistics
N Minimum Maximum Mean Std. Deviation
Age 24 17 35 22.96 4.563
Exam Mark 24 67 97 82.00 8.011
Paper Marks 24 57 95 80.33 10.277
Year at College 24 1 4 2.50 1.022
IQ 24 0 99 59.42 33.081
Valid N (listwise) 24
Figure 1 – Descriptive statistics.
Using descriptive statistics, we have analysed and summarised metric variables. This
method indicates the age mean of 24 respondents, which is 22.96. An exam mark varies
from 67 to 97, while paper marks starts with 57 to 95. The mean for year at college is 2.50
year and the IQ mean is 59.42.
b. Recoding the sex variable such that it is 1 for females and 0 for males.
c. Using Analyze, Descriptive statistics, Frequencies to summarize nonmetric
variables.
Sex
Frequency Percent Valid Percent
Cumulative
Percent
Valid 1 4.0 4.0 4.0
1 13 52.0 52.0 56.0
0 11 44.0 44.0 100.0
Total 25 100.0 100.0
Figure 2 – record of sex variable.

APPLIED BUSINESS RESEARCH
The above figure identifies sex variable. 11 (44.0%) Out of 24 participants were males and
13 (52.0%) were females.
d. Creating a pie-chart for Year in College.
Figure 3 – Pie chart count of year at college
The above figure represents a pie-chart for the year in college. The largest part 37.5% stands
for Junior, 25% is for Sophomore, 20.83% - freshman, and smallest portion 16.67% -senior.
e. Creating a histogram for IQ and including the normal distribution.
⊘ This is a preview!⊘
Do you want full access?
Subscribe today to unlock all pages.

Trusted by 1+ million students worldwide

APPLIED BUSINESS RESEARCH
Figure 4: Histogram for IQ
The above figure is a histogram for IQ and includes the normal distribution, this indicates IQ
100 as the most frequent variable.
f. Making a scatter plot with IQ on the x-axis and exam grade on the y-axis.
Figure 4: Histogram for IQ
The above figure is a histogram for IQ and includes the normal distribution, this indicates IQ
100 as the most frequent variable.
f. Making a scatter plot with IQ on the x-axis and exam grade on the y-axis.
Paraphrase This Document
Need a fresh take? Get an instant paraphrase of this document with our AI Paraphraser

APPLIED BUSINESS RESEARCH
Figure 5 – Simple scatter of exam mark by IQ
The figure notes that relationship between IQ and exam grades can be seen, however not
in all instances. The participant with 65 IQ has scored the highest exam mark, however the
lowest exam mark 67 was scored by the person with the IQ 99, and the lowest IQ (00)
participant in the group scored 83 points of the exam paper. This concludes that IQ has a
role when performing at the highest level during exam, although IQ is not the final factor.
g. Making a scatter plot with sex on the x-axis and IQ on the y-axis.

APPLIED BUSINESS RESEARCH
Figure 6 – Simple scatter of IQ by gender
The above figure shows that there is no relationship between IQ coefficient and gender.
h. Compute the mean IQ for males and for females. Conclusion? (2)
Case Processing Summary
Cases
Included Excluded Total
N Percent N Percent N Percent
IQ * Sex 24 96.0% 1 4.0% 25 100.0%
Report
IQ
Sex Mean N Std. Deviation
1 62.54 13 33.421
0 55.73 11 33.897
Total 59.42 24 33.081
Figure 7 – Mean IQ for males and females
The figure indicates that male’s IQ mean is at 55.73, however female result was affected by
higher population (13) and overall mean was at 62.54
⊘ This is a preview!⊘
Do you want full access?
Subscribe today to unlock all pages.

Trusted by 1+ million students worldwide

APPLIED BUSINESS RESEARCH
i. A new dummy variable, IQdum is created, which is 1 if the IQ is larger than or equal to
100, and 0 else.
j. Creation of a cross table between IQdum and Year in College.
Year in College * IQ_dum Crosstabulation
IQ_dum
Totalelse
Year in College Freshman Count 5 5
% within Year in College 100.0% 100.0%
Sophomore Count 6 6
% within Year in College 100.0% 100.0%
Junior Count 9 9
% within Year in College 100.0% 100.0%
Senior Count 4 4
% within Year in College 100.0% 100.0%
Total Count 24 24
% within Year in College 100.0% 100.0%
Figure 8 – Dummy IQ*Year at college crosstabultion
The above figure represents results where a new dummy variable – ‘Dummy IQ’ which
states year at college percentage when IQ is between 1 and 99 and when IQ is 100 or
greater.
The table is interpreted according to following forms:
This is the column percentage (i.e., out of the 24 who are with dummy IQ 1 to 99, 5 are
freshman, 6 are sophomore , 9 are junior , 4 are senior .
But, facing limitations our population is relatively small size and does not reflect acctual
findings.
3. Data analysis
a. Finding if the exam grade is significantly larger than 75
Exam Marks(for a maximum of 100)
Frequency Percent Valid Percent
Cumulative
Percent
Valid 67 1 4.0 4.2 4.2
68 1 4.0 4.2 8.3
72 1 4.0 4.2 12.5
75 3 12.0 12.5 25.0
76 1 4.0 4.2 29.2
78 1 4.0 4.2 33.3
Paraphrase This Document
Need a fresh take? Get an instant paraphrase of this document with our AI Paraphraser

APPLIED BUSINESS RESEARCH
79 1 4.0 4.2 37.5
80 1 4.0 4.2 41.7
81 3 12.0 12.5 54.2
83 1 4.0 4.2 58.3
85 2 8.0 8.3 66.7
87 2 8.0 8.3 75.0
89 1 4.0 4.2 79.2
90 2 8.0 8.3 87.5
92 1 4.0 4.2 91.7
95 1 4.0 4.2 95.8
97 1 4.0 4.2 100.0
Total 24 96.0 100.0
Missing System 1 4.0
Total 25 100.0
Figure 9 –Exam Mark statistics
Yes, the exam grade is significantly larger than 75. As the analysis above shows that the
frequency of exam grade larger than 75, which makes a significant proportion of grades
higher than 75.
b. Differences in the exam grade for men and women – independent samples.
Group Statistics
Gender N Mean Std. Deviation Std. Error Mean
Exam Mark = Male 11 85.00 6.914 2.085
= Female 13 79.46 8.242 2.286
Independent Samples
Levene's Test for Equality of Variances
F Sig. t
Exam Marks(for a maximum of
100)
Equal variances assumed .703 .411 -1.763
Equal variances not assumed -1.790
Figure 10 –independent samples

APPLIED BUSINESS RESEARCH
The figure illustrates that exam grades are relatively close for both genders, and there are
no significant differences. Below is presented a graphical presentation of both genders’
exam results. We can see that the group means are statistically not significantly different
because the value in the "Sig. (2-tailed)" row is greater than 0.05.
c. Is there a significant difference between the exam grade and the paper grade? – paired
samples. (2)
Figure 11- Paired samples statistics
The figure indicates that there is no significant difference between exam mark and paper
mark. Exam mark standard deviation is at 8.011, while paper marks 10.277.
Paired Samples Correlations
N Correlation Sig.
Pair 1 Exam Mark & Paper Marks 24 .626 .001
d. Finding differences in the paper grade for the four year groups
Case Processing Summary
Cases
Included Excluded Total
N Percent N Percent N Percent
Paper Marks * Year at
College
24 96.0% 1 4.0% 25 100.0%
Report
Paper Marks
Year at College Mean N Std. Deviation
Freshman 79.40 5 3.782
Sophomore 78.00 6 12.474
Junior 81.33 9 12.971
Senior 82.75 4 7.719
Total 80.33 24 10.277
Figure 12 – Paper grade differences
The above figure notes that there are no significant differences between all four-year
groups, mean is around 80% for all four groups
⊘ This is a preview!⊘
Do you want full access?
Subscribe today to unlock all pages.

Trusted by 1+ million students worldwide

APPLIED BUSINESS RESEARCH
e. Finding if the sample representative for the IQ level (for which it is known that 50% of
the population has an IQ below 100, and 50% has an IQ of 100 or higher.
IQ
Frequency Percent Valid Percent
Cumulative
Percent
Valid 0 to 99 1 4.0 4.2 4.2
15 2 8.0 8.3 12.5
19 1 4.0 4.2 16.7
20 2 8.0 8.3 25.0
26 1 4.0 4.2 29.2
29 1 4.0 4.2 33.3
40 1 4.0 4.2 37.5
60 1 4.0 4.2 41.7
65 1 4.0 4.2 45.8
70 2 8.0 8.3 54.2
76 1 4.0 4.2 58.3
80 2 8.0 8.3 66.7
82 1 4.0 4.2 70.8
86 1 4.0 4.2 75.0
89 2 8.0 8.3 83.3
98 1 4.0 4.2 87.5
99 3 12.0 12.5 100.0
Total 24 96.0 100.0
Missing System 1 4.0
Total 25 100.0
Figure 13- Sample representative for the IQ
Statistics
IQ
N Valid 24
Missing 1
Mean 59.42
Paraphrase This Document
Need a fresh take? Get an instant paraphrase of this document with our AI Paraphraser

APPLIED BUSINESS RESEARCH
The figure indicates the mean of 59.42, which agrees with the assumption that 50% of the
population has an IQ below 100, and 50% has an IQ of 100 or higher.
f. Obtaining a correlation matrix for all relevant variables.
Correlations
Age
Exam Marks(for
a maximum of
100)
Paper Marks(for
a maximum of
100) Year in College
Age Pearson Correlation 1 .222 .297 .331
Sig. (2-tailed) .296 .159 .114
N 24 24 24 24
Exam Marks(for a maximum
of 100)
Pearson Correlation .222 1 .626** .218
Sig. (2-tailed) .296 .001 .307
N 24 24 24 24
Paper Marks(for a maximum
of 100)
Pearson Correlation .297 .626** 1 .137
Sig. (2-tailed) .159 .001 .524
N 24 24 24 24
Year in College Pearson Correlation .331 .218 .137 1
Sig. (2-tailed) .114 .307 .524
N 24 24 24 24
IQ Pearson Correlation -.162 -.476* -.400 -.019
Sig. (2-tailed) .449 .019 .053 .929
N 24 24 24 24
**. Correlation is significant at the 0.01 level (2-tailed).
*. Correlation is significant at the 0.05 level (2-tailed).
Figure 14 – Correlation matrix.
The highest correlation is noted between exam mark and paper marks where correlation is
0.626, and p-value0.001 does not exceed alpha value (0.05 or 0.1). Other factors such as
paper marks, age do not have significant value for statistical purposes.
g. Doing a multiple regression analysis to explain the variance in paper grades using the
independent variables of: age; sex (dummy coded); and IQ, and interpretation of the results.

APPLIED BUSINESS RESEARCH
Variables Entered/Removeda
Model
Variables
Entered
Variables
Removed Method
1 Year in College,
IQ, Ageb
. Enter
a. Dependent Variable: Paper Marks(for a maximum of
100)
b. All requested variables entered.
Model Summary
Model R R Square
Adjusted R
Square
Std. Error of the
Estimate
1 .467a .218 .101 9.747
a. Predictors: (Constant), Year in College, IQ, Age
ANOVAa
Model Sum of Squares Df Mean Square F Sig.
1 Regression 529.403 3 176.468 1.858 .169b
Residual 1899.931 20 94.997
Total 2429.333 23
a. Dependent Variable: Paper Marks(for a maximum of 100)
b. Predictors: (Constant), Year in College, IQ, Age
Coefficientsa
Model
Unstandardized Coefficients
Standardized
Coefficients
t Sig.B Std. Error Beta
1 (Constant) 74.260 11.817 6.284 .000
IQ -.113 .062 -.363 -1.810 .085
Age .494 .479 .219 1.032 .314
Year in College .574 2.110 .057 .272 .788
a. Dependent Variable: Paper Marks(for a maximum of 100)
Figure 15 –Multiple regression analysis
⊘ This is a preview!⊘
Do you want full access?
Subscribe today to unlock all pages.

Trusted by 1+ million students worldwide
1 out of 21

Your All-in-One AI-Powered Toolkit for Academic Success.
+13062052269
info@desklib.com
Available 24*7 on WhatsApp / Email
Unlock your academic potential
Copyright © 2020–2025 A2Z Services. All Rights Reserved. Developed and managed by ZUCOL.