Data Management in Education System: Analysis for Decision Making
VerifiedAdded on 2022/09/05
|12
|5718
|18
Report
AI Summary
This report presents an applied research study on data management within the education system, specifically focusing on Al-Farabi Kazakh National University (KazNU). The research addresses the need for a unified data management strategy to enhance decision-making in the context of digital transformation. The study highlights the importance of an information and analytical system (IAS) to integrate disparate data from various university sources and provides a map model for analyzing key issues. The research also explores the design and implementation of an IAS using Microsoft Power BI, visualizing key business processes and identifying bottlenecks. The introduction of such a system aims to facilitate prompt decision-making and improve the overall management of the university's scientific and educational activities. The report reviews existing literature and systems, emphasizing the limitations of current statistical reports and the advantages of business intelligence platforms for comprehensive data analysis. The methodology involves the integration of various databases and the use of cloud-based data warehousing to support advanced analytical services. The findings underscore the potential of IAS to improve the quality of education and provide a more effective approach to data management within higher education institutions.
Applied research of data management in the
education system for decision-making on the
example of Al-Farabi Kazakh National University
Galimkair Mutanov1, Zhanl Mamykova1,*, Oksana Kopnova1, and Mukhtar Bolatkhan1
1Al-Farabi Kazakh National University, al-Farabi Ave. 71, 050040 Almaty, Republic of Kazakhstan
Abstract. In the context of the university digital transformation, the
development of digitalization processes, it is necessary to introduce a data
management culture. In most cases, this approach does not allow to see a big
picture, as well as to identify “bottlenecks”. There is a need to develop a
unified data management strategy, which will assess the value of IT
technology, and ensure the adoption of effective decisions. This article
highlights the conceptual issues of data management strategies in higher
education, using the example of the university. The place of the data
processing strategy within the university’s information space is considered
a map model for analyzing key issues for decision making. The basic
principles of organizing a data strategy for the university are determined.
There is also considered an approach to designing and implementing an
information and analytical system on the Microsoft Power BI cloud-based
business analysis platform, which integrates all disparate data from
university’s corporate information systems and transactional data sources.
The analysis of reports of key business processes of the university is carried
out, in which the formulation of research questions is shown, and there have
been given conclusions to these issues. Introduction of the information and
analytical system in the contour of the university’s corporate information
system will contribute to the early identification of bottlenecks in the
organization of the educational system and prompt decision-making in a
systematic and comprehensive analysis of the main business processes of
the educational organization through building a data map and visualizing all
statistical reports.
1 Introduction
To make managerial decisions, the leader needs to operate with all data flows within the
organization’s information space. The sources of data for the information flows of space are
corporate information systems. Each of them automates key business processes and often
does not have consolidated data. There is a need to a qualitative improvement of the
information and analytical support in educational institutions, including educational
processes at all levels.
*Corresponding author: Zhanl.Mamykova@kaznu.kz
© The Authors, published by EDP Sciences. This is an open access article distributed under the terms of the Creative Commons
Attribution License 4.0 (http://creativecommons.org/licenses/by/4.0/).
E3S Web of Conferences 159, 09003 (2020)
BTSES-2020
https://doi.org/10.1051/e3sconf/202015909003
Paraphrase This Document
Need a fresh take? Get an instant paraphrase of this document with our AI Paraphraser
The work of the information and analytical system (IAS) is based on the application of
knowledge about the organization of the university’s business processes, methods and
models for working with data, data analysis and monitoring, data interpretation, so that IAS
users have the opportunity to offer objective solutions to emerging issues, and adopt more
objective management solutions.
IAS should allow to contribute to the implementation of such tasks at the university as
improving the management of the university and the processes of scientific and educational
activities (SEA); improving the quality of education; assistance in the tasks of advanced
training of teaching staff and the effective use of pedagogical potential; identification of the
reasons for educational failure; assessment of the effectiveness of educational complexes;
control over the organization of the educational process.
The implementation of information and analytical support systems in the field of
education involves systematic research and changes affecting all levels of education
management.
Today, Kazakhstan education system does not have such a management document as
“Data Management Strategy”. There are only statistical reports in the current system for
which there is no any visualization system or even an analytical module that would allow
us to evaluate the development scenarios of the education system. In the world practice of
the education system, there is no such a document. Now the CIO of the leading world
companies speaks about the need to develop such a document and design a methodology
for studying and using the data generated in the system and organization. It will save the
company’s significant financial resources when introducing new projects. Thus, in the
digital transformation era and the data mining technologies development, there is a revision
of decision-making processes by adding a process for treatment and managing data.
2 Literature and systems review
The system of information and analytical support in the field of education should fulfill a
number of complex tasks aimed at the development of the education system in accordance
with the target orientation and the current categorial work of educational institutions.
Articles [3–4] mention the work of Russian colleagues Mitin, A. and Falicheva, T. on the
development of an Information and analytical system for monitoring the quality of
professional training. The core of this IAS is a combination of two interconnected data
warehouses: a knowledge base and a database of reference books about employees, students,
employers and other quantitative indicators of the educational institution.
In Kazakhstan Information and analytical system developed by the Committee on
Statistics of the Ministry of National Economy of the Republic of Kazakhstan focused on the
provision of statistical data on various indicators of education, economy, services market,
labor and employment innovations. This system also contains the ability to build analytical
reports on selected indicators. The analysis of dynamic rows allows you to calculate the
increase and growth rate, absolute growth, the average value of indicators in the dynamics,
the rows tendency - trend, asymmetry and excess. [5].
Thus, from the systems review [1-17] we see that these software products contain
summary statistical data on quantitative indicators. They focused on providing only key
parameters of the education system and do not allow in-depth analysis. Presented systems
are information databases, which provide information for analytical data processing. Another
significant drawback of such systems is the lack of communication with the primary source
of information, and as a result, the question arises of the relevance of the provided data.
Indirect connections of the education development in these systems are not viewed. Built-in
algorithms for data analysis in these systems are not obvious and therefore cause more
2
E3S Web of Conferences 159, 09003 (2020)
BTSES-2020
https://doi.org/10.1051/e3sconf/202015909003
questions than answers. They do not allow a detailed analysis of the data sources and to
evaluate the entire depth of the analyzed situation.
To implement an information and analytical system, an environment is needed that would
make it possible to combine data from disparate systems together, significantly reduce the
labor costs of producing reports, and improve the quality of information for making strategic
decisions. Such a function was taken over by business analytical systems (Business
Intelligence or abbreviated BI-systems) developed on the basis of cloud platforms, which are
designed to receive real-time information for making strategic decisions in real time. The
following platforms are distinguished for processing and analyzing data and presenting them
in as reports forms: Microsoft Business Intelligence; Oracle Business Intelligence; SAP
Business Objects; QlikView; Qlik Sense; Deductor; Prognoz Platform. Analysis of these
systems allow to conclude that the Microsoft Business Intelligence platform is best suited for
the education system, due to the fact that it provides fast analysis of a large amount of data.
It allows to visualize the results of processing a data array with the personalization capacity,
supports the capacity to collaborate with data by placing data on an LDAP server, provides
secure publication of dashboards and view them from any device with Internet access. It is a
real-time reporting system, and it allows to work in groups with data and automatic data
synchronization for all users.
The literature review of information systems and problems in data management allowed
to determine the approach to conducting applied research on data management in the
education system to make decisions by designing and developing an information and
analytical support system using the example of a higher education institution to accumulate
an array of information indicators in purpose to analyze contribution of all subjects of
scientific and educational activities to the overall result of the university development
strategy, depending on their role And objectively assess the compliance of their actual
activities and the planned development of the required parameters.
3 Methods of research and design of IAS
The complex task of university management is to improve the quality of the scientific and
educational process, which requires systematic and timely analysis of comprehensive and
reliable information about the status of the university. The solution to this task is possible by
introducing modern information technologies into the university management process and
constantly improving them. Therefore, higher educational institutions are constantly
searching for effective ways to manage scientific and educational activities (SEA), in
connection with which the university’s information infrastructure is developing.
The information infrastructure is a combination of solutions of own and local
developments and forms the information space of the university. Own developments can be
attributed information systems for the automation of educational activities, scientific work of
students and faculty, the use of distance learning technologies, as well as indicators for the
implementation of the indicative plan. Local developments present as solution of third-party
and performs the functions of automating financial and economic activities, an electronic
document management system, using management software to administer key resources and
services, training software and IT service resource management software solutions.
Often, managers face with the problem of obtaining actual and reliable data, which is
stored in disparate local systems of the university’s information space. Structural departments
heads face the same problem during the period of writing reports and various inspections
aimed at education monitoring. The preparation of analytical reports takes a large amount of
time and additional load on the teaching and support staff. Therefore, the need has ripened
for the creation of information and analytical systems that allow to consolidate data of
3
E3S Web of Conferences 159, 09003 (2020)
BTSES-2020
https://doi.org/10.1051/e3sconf/202015909003
⊘ This is a preview!⊘
Do you want full access?
Subscribe today to unlock all pages.
Trusted by 1+ million students worldwide
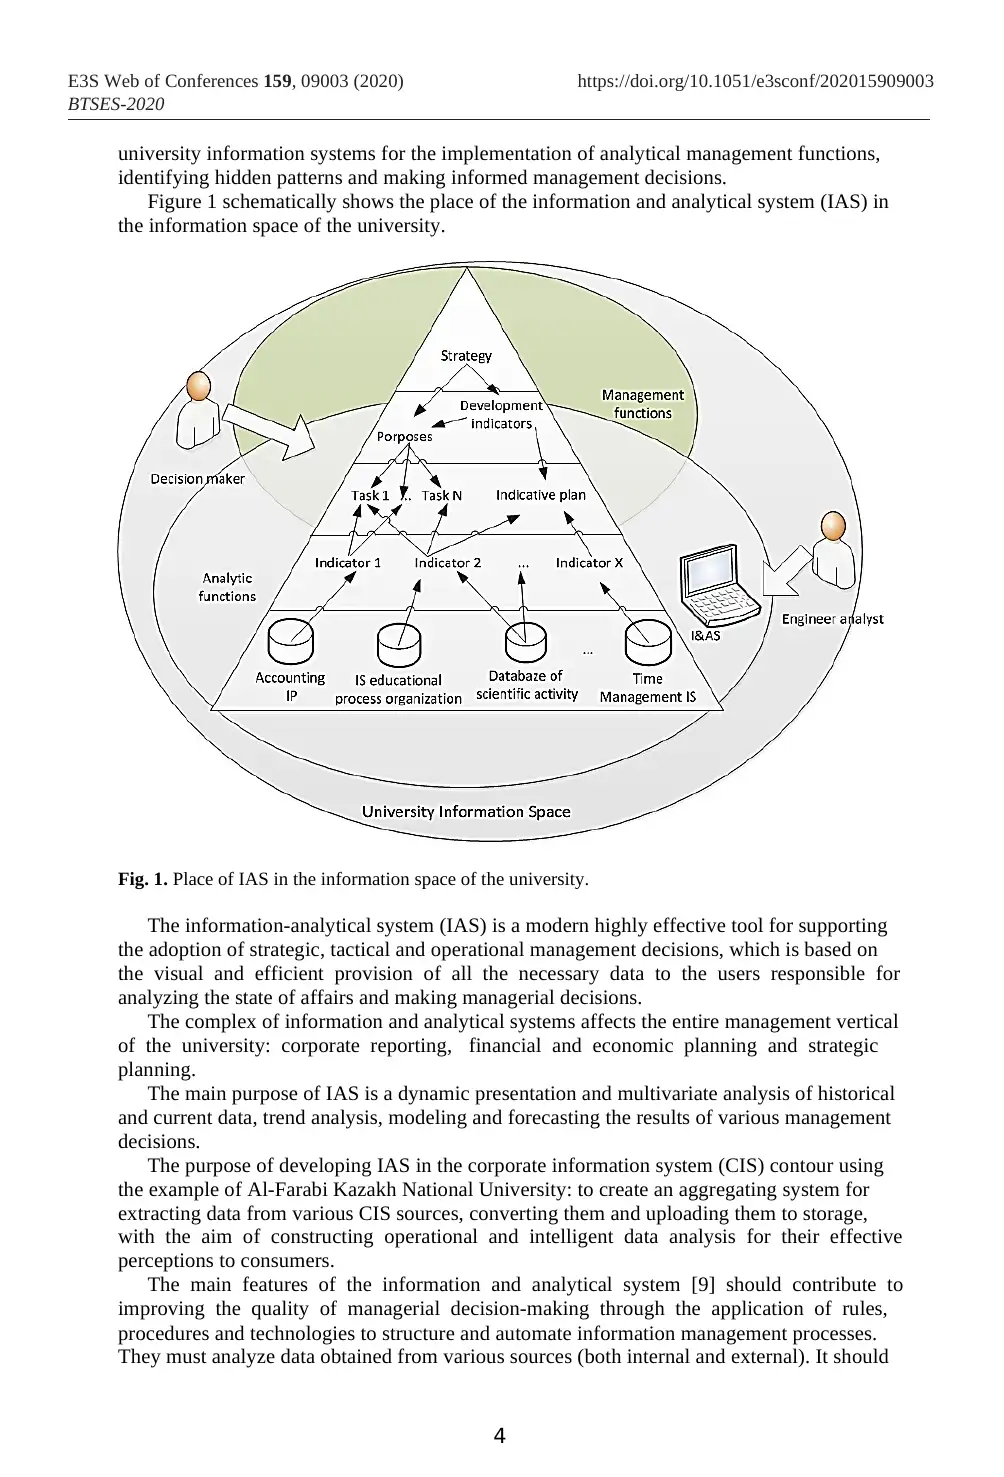
university information systems for the implementation of analytical management functions,
identifying hidden patterns and making informed management decisions.
Figure 1 schematically shows the place of the information and analytical system (IAS) in
the information space of the university.
Fig. 1. Place of IAS in the information space of the university.
The information-analytical system (IAS) is a modern highly effective tool for supporting
the adoption of strategic, tactical and operational management decisions, which is based on
the visual and efficient provision of all the necessary data to the users responsible for
analyzing the state of affairs and making managerial decisions.
The complex of information and analytical systems affects the entire management vertical
of the university: corporate reporting, financial and economic planning and strategic
planning.
The main purpose of IAS is a dynamic presentation and multivariate analysis of historical
and current data, trend analysis, modeling and forecasting the results of various management
decisions.
The purpose of developing IAS in the corporate information system (CIS) contour using
the example of Al-Farabi Kazakh National University: to create an aggregating system for
extracting data from various CIS sources, converting them and uploading them to storage,
with the aim of constructing operational and intelligent data analysis for their effective
perceptions to consumers.
The main features of the information and analytical system [9] should contribute to
improving the quality of managerial decision-making through the application of rules,
procedures and technologies to structure and automate information management processes.
They must analyze data obtained from various sources (both internal and external). It should
4
E3S Web of Conferences 159, 09003 (2020)
BTSES-2020
https://doi.org/10.1051/e3sconf/202015909003
Paraphrase This Document
Need a fresh take? Get an instant paraphrase of this document with our AI Paraphraser
be a separate software product that functions separately from affiliated systems, but has two-
way interaction with them.
To implement IAS, such methods and models as programming technologies, information
systems developing, database theory, statistics, artificial intelligence, machine learning, data
mining, economic and mathematical modeling were used.
The information and analytical system is a platform in which databases (MSSQL,
MySQL, etc.) of disparate information systems of the organization’s information
infrastructure and transactional data sources are integrated. This data integration is
accumulating at the cloud data warehouse level. The cloud architecture of the platform allows
you to connect various data intelligent services like Microsoft Azure Learning, Analysis
Services and Google Analytics. In order to use a systematic approach, as well as apply
methods and models of economic and mathematical modeling and Intelligent Data Analysis,
you can build visualization services and predictive analytics. Using Power BI, you can
securely publish reports to your organization and set up automatic data updates so that all
users receive up-to-date information.
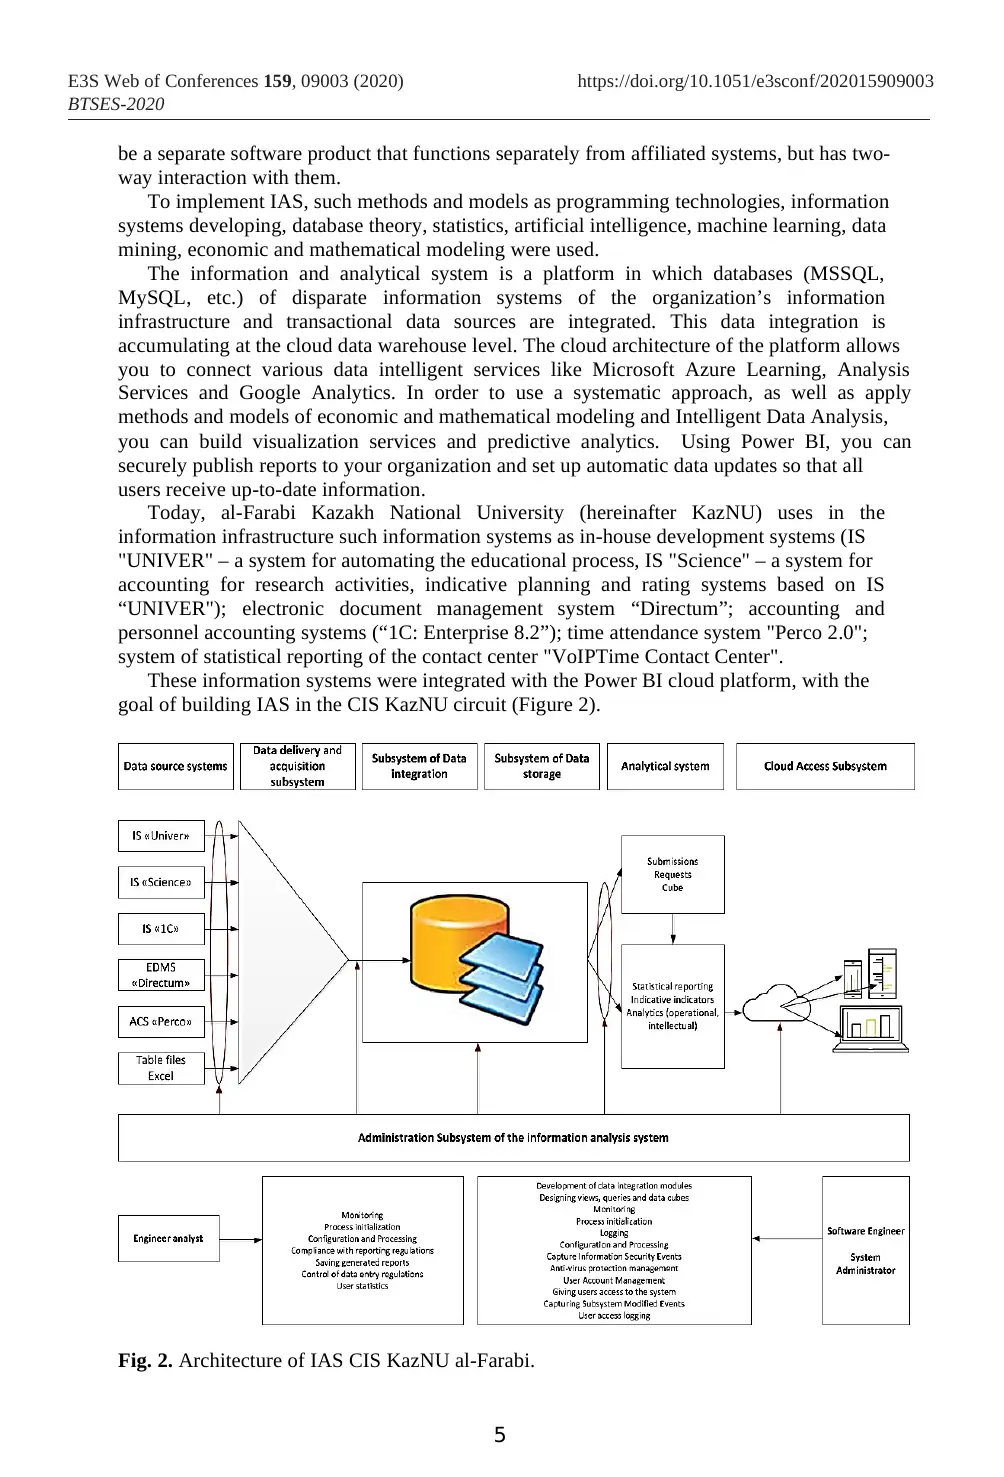
Today, al-Farabi Kazakh National University (hereinafter KazNU) uses in the
information infrastructure such information systems as in-house development systems (IS
"UNIVER" – a system for automating the educational process, IS "Science" – a system for
accounting for research activities, indicative planning and rating systems based on IS
“UNIVER"); electronic document management system “Directum”; accounting and
personnel accounting systems (“1C: Enterprise 8.2”); time attendance system "Perco 2.0";
system of statistical reporting of the contact center "VoIPTime Contact Center".
These information systems were integrated with the Power BI cloud platform, with the
goal of building IAS in the CIS KazNU circuit (Figure 2).
Fig. 2. Architecture of IAS CIS KazNU al-Farabi.
5
E3S Web of Conferences 159, 09003 (2020)
BTSES-2020
https://doi.org/10.1051/e3sconf/202015909003
way interaction with them.
To implement IAS, such methods and models as programming technologies, information
systems developing, database theory, statistics, artificial intelligence, machine learning, data
mining, economic and mathematical modeling were used.
The information and analytical system is a platform in which databases (MSSQL,
MySQL, etc.) of disparate information systems of the organization’s information
infrastructure and transactional data sources are integrated. This data integration is
accumulating at the cloud data warehouse level. The cloud architecture of the platform allows
you to connect various data intelligent services like Microsoft Azure Learning, Analysis
Services and Google Analytics. In order to use a systematic approach, as well as apply
methods and models of economic and mathematical modeling and Intelligent Data Analysis,
you can build visualization services and predictive analytics. Using Power BI, you can
securely publish reports to your organization and set up automatic data updates so that all
users receive up-to-date information.
Today, al-Farabi Kazakh National University (hereinafter KazNU) uses in the
information infrastructure such information systems as in-house development systems (IS
"UNIVER" – a system for automating the educational process, IS "Science" – a system for
accounting for research activities, indicative planning and rating systems based on IS
“UNIVER"); electronic document management system “Directum”; accounting and
personnel accounting systems (“1C: Enterprise 8.2”); time attendance system "Perco 2.0";
system of statistical reporting of the contact center "VoIPTime Contact Center".
These information systems were integrated with the Power BI cloud platform, with the
goal of building IAS in the CIS KazNU circuit (Figure 2).
Fig. 2. Architecture of IAS CIS KazNU al-Farabi.
5
E3S Web of Conferences 159, 09003 (2020)
BTSES-2020
https://doi.org/10.1051/e3sconf/202015909003
In the context of the digital transformation of the university, the development of
digitalization processes, it is necessary to introduce a culture of data management: collection,
analysis, communication, identification of “bottlenecks”, understanding, application, tools,
management strategy, result orientation. It will assess the value of IT technology, and ensure
the adoption of effective decisions.
There is a problem here – data management is still under development in many
institutions. You need to start with simple tasks, and make efforts to build the entire model
of data management of the learning process.
Thus, work is underway at Al-Farabi Kazakh National University to develop a data
management strategy based on methods for determining how data is collected, stored,
processed and used for various tasks of developing an education and decision-making system
that allows you to build an information and analytical system, which integrates and
accumulates disparate data of corporate information systems, provides an analysis of the state
of scientific and educational activities of organizing education in the main areas of
development, which are formalized as: the quality of educational services, research potential,
innovative orientation, information and technical and technological infrastructure.
Without a data management strategy, an organization / university will be forced to engage
in numerous data-related initiatives that are probably to be carried out by various business
groups / departments. Initiatives can be analytics of data (based on statistical reports);
business analytics (statistical and managerial reports, visualization, infographics); master
data management (processing, storage, strategic indicators, reports).
In this regard, the authors of this article identified the basic principles of organizing a data
strategy for a university, such as:
- Strategic priorities that are consistent with the University Development Strategy for
the long term; the availability of skills and abilities to work with data.
- Data requirements: what data that creates value is needed; data type (structured,
unstructured); data category (internal / external); data collection method; data quality and
consistency.
- Data management: responsibility for: ensuring accuracy, completeness and relevance;
data collection: collection method, integration mechanisms, permissions, GDPR security;
data storage: reliability, security, trust; access to data: method, users, decision-makers, risks,
security; data use: method (open / closed), data presentation format, legality.
- Technology for working with data: requirements for hardware and software; data
collection; storage and organization of data; processing (analysis) of data (statistical methods,
machine and deep learning algorithms) to extract ideas; information transfer (reports,
visualization charts).
- Information on the adoption of data: the use of data as a predicting intelligence in
making internal and external decisions; preparation and implementation of an action plan for
the use of data and the introduction of change management; role of responsible executors.
- Analytics: development of dashboards and infographics; tuning data for the research
questions; building predicting models; study of forecast data and refinement of data to obtain
competitive advantages.
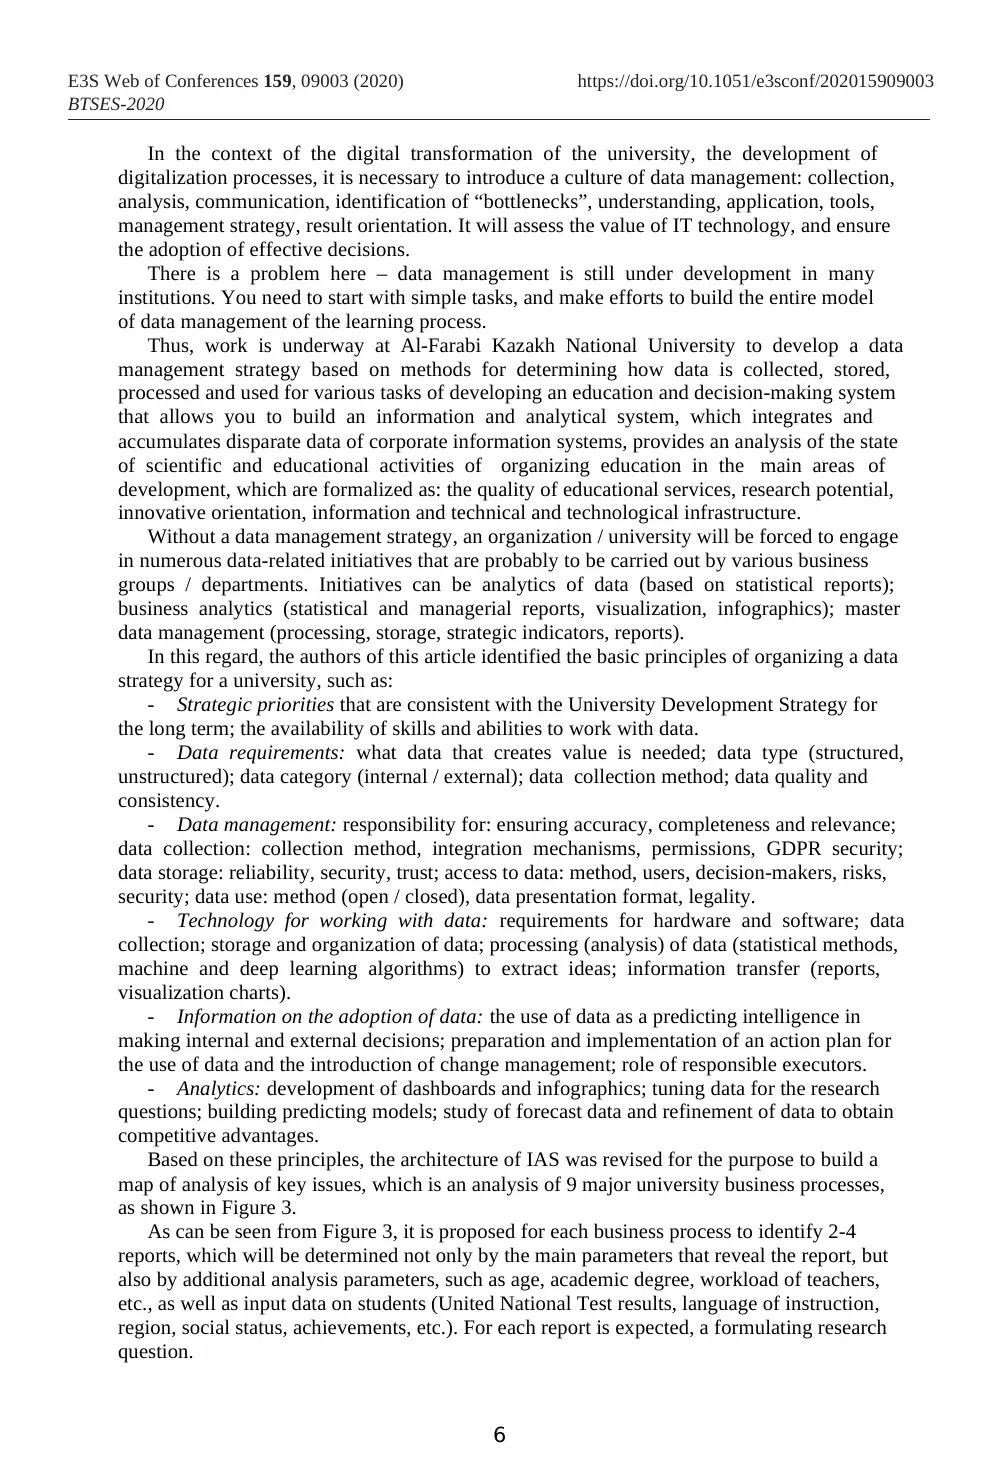
Based on these principles, the architecture of IAS was revised for the purpose to build a
map of analysis of key issues, which is an analysis of 9 major university business processes,
as shown in Figure 3.
As can be seen from Figure 3, it is proposed for each business process to identify 2-4
reports, which will be determined not only by the main parameters that reveal the report, but
also by additional analysis parameters, such as age, academic degree, workload of teachers,
etc., as well as input data on students (United National Test results, language of instruction,
region, social status, achievements, etc.). For each report is expected, a formulating research
question.
6
E3S Web of Conferences 159, 09003 (2020)
BTSES-2020
https://doi.org/10.1051/e3sconf/202015909003
digitalization processes, it is necessary to introduce a culture of data management: collection,
analysis, communication, identification of “bottlenecks”, understanding, application, tools,
management strategy, result orientation. It will assess the value of IT technology, and ensure
the adoption of effective decisions.
There is a problem here – data management is still under development in many
institutions. You need to start with simple tasks, and make efforts to build the entire model
of data management of the learning process.
Thus, work is underway at Al-Farabi Kazakh National University to develop a data
management strategy based on methods for determining how data is collected, stored,
processed and used for various tasks of developing an education and decision-making system
that allows you to build an information and analytical system, which integrates and
accumulates disparate data of corporate information systems, provides an analysis of the state
of scientific and educational activities of organizing education in the main areas of
development, which are formalized as: the quality of educational services, research potential,
innovative orientation, information and technical and technological infrastructure.
Without a data management strategy, an organization / university will be forced to engage
in numerous data-related initiatives that are probably to be carried out by various business
groups / departments. Initiatives can be analytics of data (based on statistical reports);
business analytics (statistical and managerial reports, visualization, infographics); master
data management (processing, storage, strategic indicators, reports).
In this regard, the authors of this article identified the basic principles of organizing a data
strategy for a university, such as:
- Strategic priorities that are consistent with the University Development Strategy for
the long term; the availability of skills and abilities to work with data.
- Data requirements: what data that creates value is needed; data type (structured,
unstructured); data category (internal / external); data collection method; data quality and
consistency.
- Data management: responsibility for: ensuring accuracy, completeness and relevance;
data collection: collection method, integration mechanisms, permissions, GDPR security;
data storage: reliability, security, trust; access to data: method, users, decision-makers, risks,
security; data use: method (open / closed), data presentation format, legality.
- Technology for working with data: requirements for hardware and software; data
collection; storage and organization of data; processing (analysis) of data (statistical methods,
machine and deep learning algorithms) to extract ideas; information transfer (reports,
visualization charts).
- Information on the adoption of data: the use of data as a predicting intelligence in
making internal and external decisions; preparation and implementation of an action plan for
the use of data and the introduction of change management; role of responsible executors.
- Analytics: development of dashboards and infographics; tuning data for the research
questions; building predicting models; study of forecast data and refinement of data to obtain
competitive advantages.
Based on these principles, the architecture of IAS was revised for the purpose to build a
map of analysis of key issues, which is an analysis of 9 major university business processes,
as shown in Figure 3.
As can be seen from Figure 3, it is proposed for each business process to identify 2-4
reports, which will be determined not only by the main parameters that reveal the report, but
also by additional analysis parameters, such as age, academic degree, workload of teachers,
etc., as well as input data on students (United National Test results, language of instruction,
region, social status, achievements, etc.). For each report is expected, a formulating research
question.
6
E3S Web of Conferences 159, 09003 (2020)
BTSES-2020
https://doi.org/10.1051/e3sconf/202015909003
⊘ This is a preview!⊘
Do you want full access?
Subscribe today to unlock all pages.
Trusted by 1+ million students worldwide
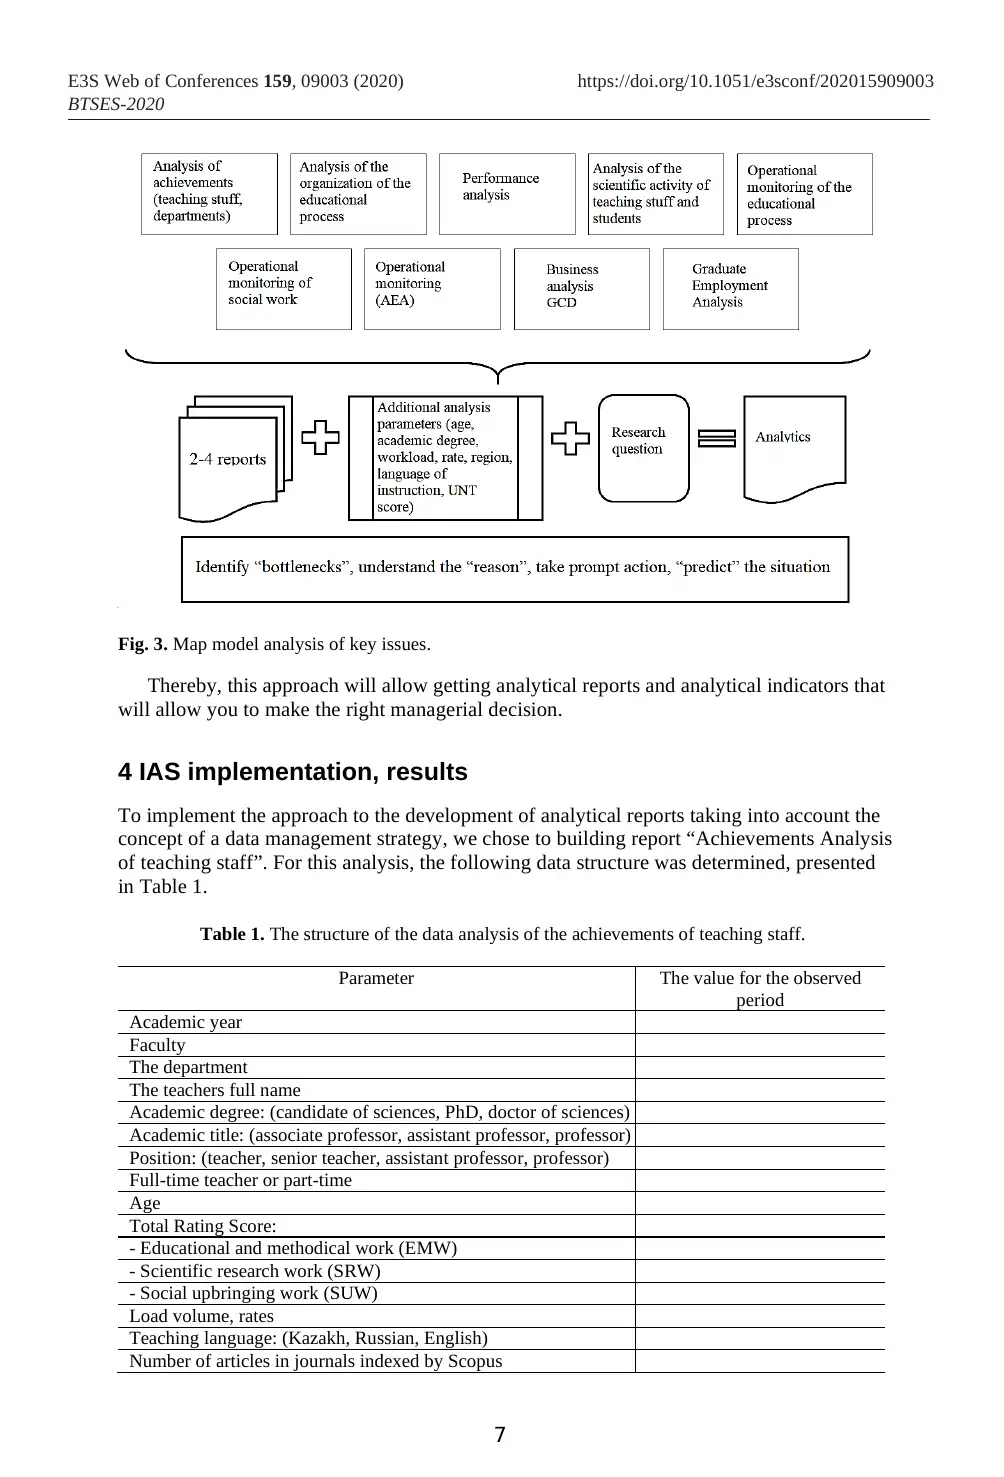
Fig. 3. Map model analysis of key issues.
Thereby, this approach will allow getting analytical reports and analytical indicators that
will allow you to make the right managerial decision.
4 IAS implementation, results
To implement the approach to the development of analytical reports taking into account the
concept of a data management strategy, we chose to building report “Achievements Analysis
of teaching staff”. For this analysis, the following data structure was determined, presented
in Table 1.
Table 1. The structure of the data analysis of the achievements of teaching staff.
Parameter The value for the observed
period
Academic year
Faculty
The department
The teachers full name
Academic degree: (candidate of sciences, PhD, doctor of sciences)
Academic title: (associate professor, assistant professor, professor)
Position: (teacher, senior teacher, assistant professor, professor)
Full-time teacher or part-time
Age
Total Rating Score:
- Educational and methodical work (EMW)
- Scientific research work (SRW)
- Social upbringing work (SUW)
Load volume, rates
Teaching language: (Kazakh, Russian, English)
Number of articles in journals indexed by Scopus
7
E3S Web of Conferences 159, 09003 (2020)
BTSES-2020
https://doi.org/10.1051/e3sconf/202015909003
Paraphrase This Document
Need a fresh take? Get an instant paraphrase of this document with our AI Paraphraser
The total value of the h-index
Completeness and quality of loading (Educational-methodical
complex of disciplines, hereinafter EMCD)
Student performance in the disciplines studied
Assessment of the quality of teaching according to the results of
the online questionnaire "Teacher through the eyes of students"
Number of violations in labor discipline
ASSESSMENT OF THE TEACHER'S ACTIVITY
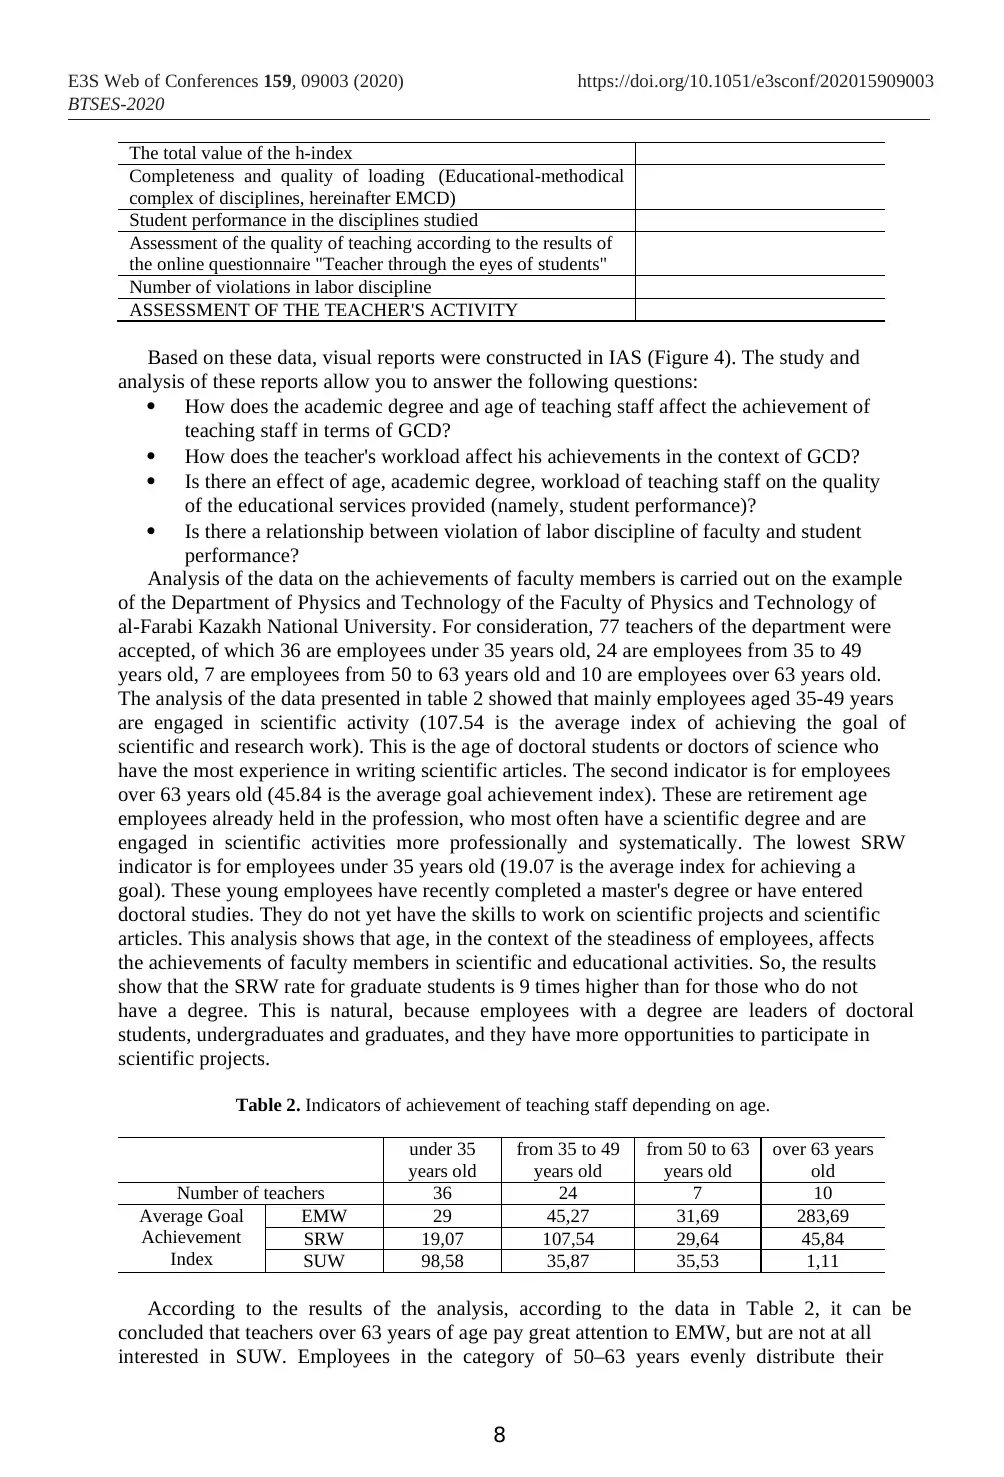
Based on these data, visual reports were constructed in IAS (Figure 4). The study and
analysis of these reports allow you to answer the following questions:
How does the academic degree and age of teaching staff affect the achievement of
teaching staff in terms of GCD?
How does the teacher's workload affect his achievements in the context of GCD?
Is there an effect of age, academic degree, workload of teaching staff on the quality
of the educational services provided (namely, student performance)?
Is there a relationship between violation of labor discipline of faculty and student
performance?
Analysis of the data on the achievements of faculty members is carried out on the example
of the Department of Physics and Technology of the Faculty of Physics and Technology of
al-Farabi Kazakh National University. For consideration, 77 teachers of the department were
accepted, of which 36 are employees under 35 years old, 24 are employees from 35 to 49
years old, 7 are employees from 50 to 63 years old and 10 are employees over 63 years old.
The analysis of the data presented in table 2 showed that mainly employees aged 35-49 years
are engaged in scientific activity (107.54 is the average index of achieving the goal of
scientific and research work). This is the age of doctoral students or doctors of science who
have the most experience in writing scientific articles. The second indicator is for employees
over 63 years old (45.84 is the average goal achievement index). These are retirement age
employees already held in the profession, who most often have a scientific degree and are
engaged in scientific activities more professionally and systematically. The lowest SRW
indicator is for employees under 35 years old (19.07 is the average index for achieving a
goal). These young employees have recently completed a master's degree or have entered
doctoral studies. They do not yet have the skills to work on scientific projects and scientific
articles. This analysis shows that age, in the context of the steadiness of employees, affects
the achievements of faculty members in scientific and educational activities. So, the results
show that the SRW rate for graduate students is 9 times higher than for those who do not
have a degree. This is natural, because employees with a degree are leaders of doctoral
students, undergraduates and graduates, and they have more opportunities to participate in
scientific projects.
Table 2. Indicators of achievement of teaching staff depending on age.
under 35
years old
from 35 to 49
years old
from 50 to 63
years old
over 63 years
old
Number of teachers 36 24 7 10
Average Goal
Achievement
Index
EMW 29 45,27 31,69 283,69
SRW 19,07 107,54 29,64 45,84
SUW 98,58 35,87 35,53 1,11
According to the results of the analysis, according to the data in Table 2, it can be
concluded that teachers over 63 years of age pay great attention to EMW, but are not at all
interested in SUW. Employees in the category of 50–63 years evenly distribute their
8
E3S Web of Conferences 159, 09003 (2020)
BTSES-2020
https://doi.org/10.1051/e3sconf/202015909003
Completeness and quality of loading (Educational-methodical
complex of disciplines, hereinafter EMCD)
Student performance in the disciplines studied
Assessment of the quality of teaching according to the results of
the online questionnaire "Teacher through the eyes of students"
Number of violations in labor discipline
ASSESSMENT OF THE TEACHER'S ACTIVITY
Based on these data, visual reports were constructed in IAS (Figure 4). The study and
analysis of these reports allow you to answer the following questions:
How does the academic degree and age of teaching staff affect the achievement of
teaching staff in terms of GCD?
How does the teacher's workload affect his achievements in the context of GCD?
Is there an effect of age, academic degree, workload of teaching staff on the quality
of the educational services provided (namely, student performance)?
Is there a relationship between violation of labor discipline of faculty and student
performance?
Analysis of the data on the achievements of faculty members is carried out on the example
of the Department of Physics and Technology of the Faculty of Physics and Technology of
al-Farabi Kazakh National University. For consideration, 77 teachers of the department were
accepted, of which 36 are employees under 35 years old, 24 are employees from 35 to 49
years old, 7 are employees from 50 to 63 years old and 10 are employees over 63 years old.
The analysis of the data presented in table 2 showed that mainly employees aged 35-49 years
are engaged in scientific activity (107.54 is the average index of achieving the goal of
scientific and research work). This is the age of doctoral students or doctors of science who
have the most experience in writing scientific articles. The second indicator is for employees
over 63 years old (45.84 is the average goal achievement index). These are retirement age
employees already held in the profession, who most often have a scientific degree and are
engaged in scientific activities more professionally and systematically. The lowest SRW
indicator is for employees under 35 years old (19.07 is the average index for achieving a
goal). These young employees have recently completed a master's degree or have entered
doctoral studies. They do not yet have the skills to work on scientific projects and scientific
articles. This analysis shows that age, in the context of the steadiness of employees, affects
the achievements of faculty members in scientific and educational activities. So, the results
show that the SRW rate for graduate students is 9 times higher than for those who do not
have a degree. This is natural, because employees with a degree are leaders of doctoral
students, undergraduates and graduates, and they have more opportunities to participate in
scientific projects.
Table 2. Indicators of achievement of teaching staff depending on age.
under 35
years old
from 35 to 49
years old
from 50 to 63
years old
over 63 years
old
Number of teachers 36 24 7 10
Average Goal
Achievement
Index
EMW 29 45,27 31,69 283,69
SRW 19,07 107,54 29,64 45,84
SUW 98,58 35,87 35,53 1,11
According to the results of the analysis, according to the data in Table 2, it can be
concluded that teachers over 63 years of age pay great attention to EMW, but are not at all
interested in SUW. Employees in the category of 50–63 years evenly distribute their
8
E3S Web of Conferences 159, 09003 (2020)
BTSES-2020
https://doi.org/10.1051/e3sconf/202015909003
employment in all three areas of work (EMW, SRW, SUW); employees of the category 35–
49 years old are mainly engaged in research work. Teachers under the age of 35 are mainly
involved in SUW. Thus, we can conclude that it is necessary to evenly redistribute the efforts
of all categories of teachers in all three areas of scientific and educational activities.
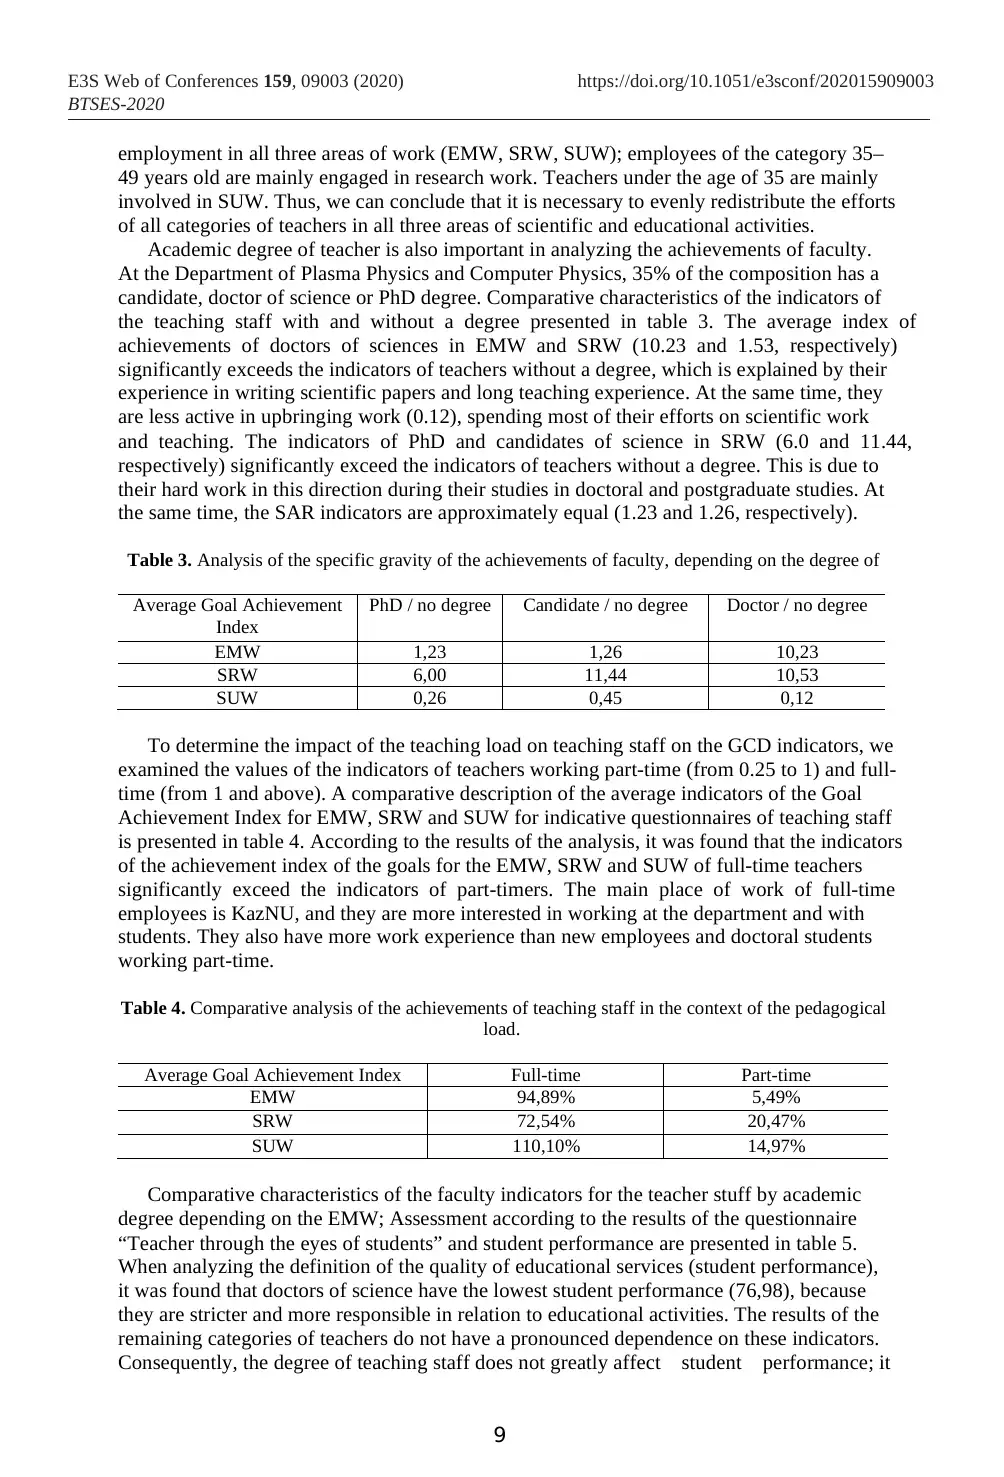
Academic degree of teacher is also important in analyzing the achievements of faculty.
At the Department of Plasma Physics and Computer Physics, 35% of the composition has a
candidate, doctor of science or PhD degree. Comparative characteristics of the indicators of
the teaching staff with and without a degree presented in table 3. The average index of
achievements of doctors of sciences in EMW and SRW (10.23 and 1.53, respectively)
significantly exceeds the indicators of teachers without a degree, which is explained by their
experience in writing scientific papers and long teaching experience. At the same time, they
are less active in upbringing work (0.12), spending most of their efforts on scientific work
and teaching. The indicators of PhD and candidates of science in SRW (6.0 and 11.44,
respectively) significantly exceed the indicators of teachers without a degree. This is due to
their hard work in this direction during their studies in doctoral and postgraduate studies. At
the same time, the SAR indicators are approximately equal (1.23 and 1.26, respectively).
Table 3. Analysis of the specific gravity of the achievements of faculty, depending on the degree of
Average Goal Achievement
Index
PhD / no degree Candidate / no degree Doctor / no degree
EMW 1,23 1,26 10,23
SRW 6,00 11,44 10,53
SUW 0,26 0,45 0,12
To determine the impact of the teaching load on teaching staff on the GCD indicators, we
examined the values of the indicators of teachers working part-time (from 0.25 to 1) and full-
time (from 1 and above). A comparative description of the average indicators of the Goal
Achievement Index for EMW, SRW and SUW for indicative questionnaires of teaching staff
is presented in table 4. According to the results of the analysis, it was found that the indicators
of the achievement index of the goals for the EMW, SRW and SUW of full-time teachers
significantly exceed the indicators of part-timers. The main place of work of full-time
employees is KazNU, and they are more interested in working at the department and with
students. They also have more work experience than new employees and doctoral students
working part-time.
Table 4. Comparative analysis of the achievements of teaching staff in the context of the pedagogical
load.
Average Goal Achievement Index Full-time Part-time
EMW 94,89% 5,49%
SRW 72,54% 20,47%
SUW 110,10% 14,97%
Comparative characteristics of the faculty indicators for the teacher stuff by academic
degree depending on the EMW; Assessment according to the results of the questionnaire
“Teacher through the eyes of students” and student performance are presented in table 5.
When analyzing the definition of the quality of educational services (student performance),
it was found that doctors of science have the lowest student performance (76,98), because
they are stricter and more responsible in relation to educational activities. The results of the
remaining categories of teachers do not have a pronounced dependence on these indicators.
Consequently, the degree of teaching staff does not greatly affect student performance; it
9
E3S Web of Conferences 159, 09003 (2020)
BTSES-2020
https://doi.org/10.1051/e3sconf/202015909003
49 years old are mainly engaged in research work. Teachers under the age of 35 are mainly
involved in SUW. Thus, we can conclude that it is necessary to evenly redistribute the efforts
of all categories of teachers in all three areas of scientific and educational activities.
Academic degree of teacher is also important in analyzing the achievements of faculty.
At the Department of Plasma Physics and Computer Physics, 35% of the composition has a
candidate, doctor of science or PhD degree. Comparative characteristics of the indicators of
the teaching staff with and without a degree presented in table 3. The average index of
achievements of doctors of sciences in EMW and SRW (10.23 and 1.53, respectively)
significantly exceeds the indicators of teachers without a degree, which is explained by their
experience in writing scientific papers and long teaching experience. At the same time, they
are less active in upbringing work (0.12), spending most of their efforts on scientific work
and teaching. The indicators of PhD and candidates of science in SRW (6.0 and 11.44,
respectively) significantly exceed the indicators of teachers without a degree. This is due to
their hard work in this direction during their studies in doctoral and postgraduate studies. At
the same time, the SAR indicators are approximately equal (1.23 and 1.26, respectively).
Table 3. Analysis of the specific gravity of the achievements of faculty, depending on the degree of
Average Goal Achievement
Index
PhD / no degree Candidate / no degree Doctor / no degree
EMW 1,23 1,26 10,23
SRW 6,00 11,44 10,53
SUW 0,26 0,45 0,12
To determine the impact of the teaching load on teaching staff on the GCD indicators, we
examined the values of the indicators of teachers working part-time (from 0.25 to 1) and full-
time (from 1 and above). A comparative description of the average indicators of the Goal
Achievement Index for EMW, SRW and SUW for indicative questionnaires of teaching staff
is presented in table 4. According to the results of the analysis, it was found that the indicators
of the achievement index of the goals for the EMW, SRW and SUW of full-time teachers
significantly exceed the indicators of part-timers. The main place of work of full-time
employees is KazNU, and they are more interested in working at the department and with
students. They also have more work experience than new employees and doctoral students
working part-time.
Table 4. Comparative analysis of the achievements of teaching staff in the context of the pedagogical
load.
Average Goal Achievement Index Full-time Part-time
EMW 94,89% 5,49%
SRW 72,54% 20,47%
SUW 110,10% 14,97%
Comparative characteristics of the faculty indicators for the teacher stuff by academic
degree depending on the EMW; Assessment according to the results of the questionnaire
“Teacher through the eyes of students” and student performance are presented in table 5.
When analyzing the definition of the quality of educational services (student performance),
it was found that doctors of science have the lowest student performance (76,98), because
they are stricter and more responsible in relation to educational activities. The results of the
remaining categories of teachers do not have a pronounced dependence on these indicators.
Consequently, the degree of teaching staff does not greatly affect student performance; it
9
E3S Web of Conferences 159, 09003 (2020)
BTSES-2020
https://doi.org/10.1051/e3sconf/202015909003
⊘ This is a preview!⊘
Do you want full access?
Subscribe today to unlock all pages.
Trusted by 1+ million students worldwide
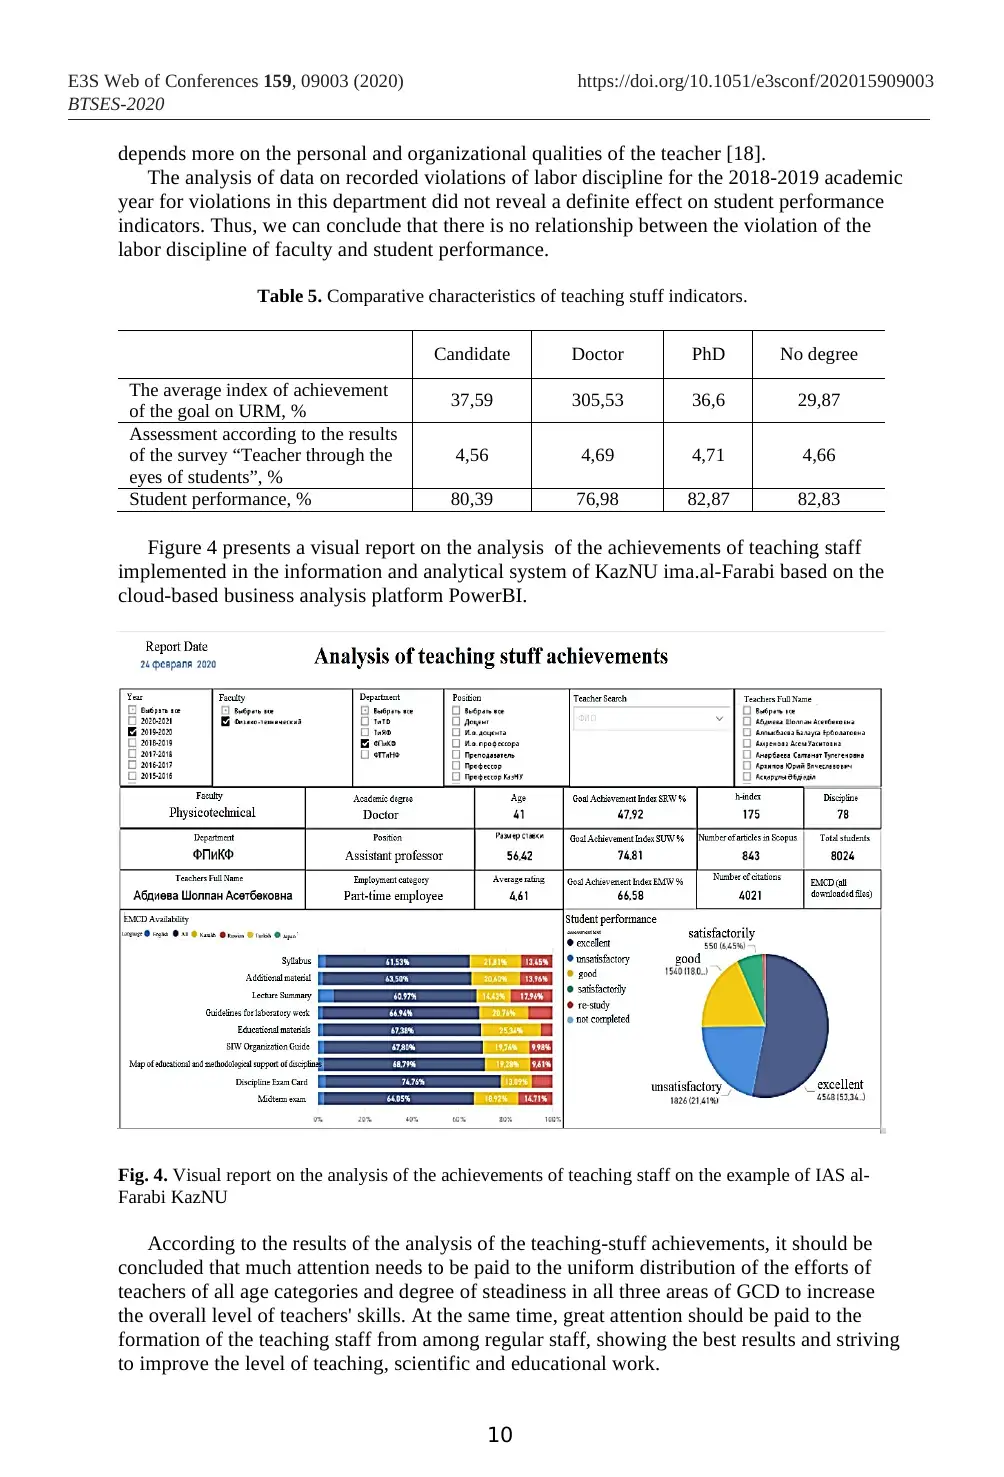
depends more on the personal and organizational qualities of the teacher [18].
The analysis of data on recorded violations of labor discipline for the 2018-2019 academic
year for violations in this department did not reveal a definite effect on student performance
indicators. Thus, we can conclude that there is no relationship between the violation of the
labor discipline of faculty and student performance.
Table 5. Comparative characteristics of teaching stuff indicators.
Candidate Doctor PhD No degree
The average index of achievement
of the goal on URM, % 37,59 305,53 36,6 29,87
Assessment according to the results
of the survey “Teacher through the
eyes of students”, %
4,56 4,69 4,71 4,66
Student performance, % 80,39 76,98 82,87 82,83
Figure 4 presents a visual report on the analysis of the achievements of teaching staff
implemented in the information and analytical system of KazNU ima.al-Farabi based on the
cloud-based business analysis platform PowerBI.
Fig. 4. Visual report on the analysis of the achievements of teaching staff on the example of IAS al-
Farabi KazNU
According to the results of the analysis of the teaching-stuff achievements, it should be
concluded that much attention needs to be paid to the uniform distribution of the efforts of
teachers of all age categories and degree of steadiness in all three areas of GCD to increase
the overall level of teachers' skills. At the same time, great attention should be paid to the
formation of the teaching staff from among regular staff, showing the best results and striving
to improve the level of teaching, scientific and educational work.
10
E3S Web of Conferences 159, 09003 (2020)
BTSES-2020
https://doi.org/10.1051/e3sconf/202015909003
Paraphrase This Document
Need a fresh take? Get an instant paraphrase of this document with our AI Paraphraser
5 Conclusion
In this article the issue of developing a data management strategy for a university that allows
to research data management issues and develop data management procedures is considered.
An approach to designing and implementing IAS on the Microsoft Power BI cloud-based
business analysis platform, which integrates all disparate data from university’s corporate
information systems and transactional data sources, is considered. The analysis of reports of
key business processes of the university was carried out, in which the formulation of research
questions was shown and given conclusions on these issues.
The approach used by the authors in the article to applied data research in the education
system using the example of Al-Farabi Kazakh National University can be scaled to any
organization that has a corporate information system consisting of its own and local
developments of information systems and wishing to conduct a deeper analysis of activities
organizations to make the right strategic decisions.
The economic effect of the introduction of such a system is: early identification of
bottlenecks in the organization of the education system, operational decision-making; in a
systematic and comprehensive analysis of the main business processes of the organization of
education, through the construction of a data map and visualization of all statistical reporting,
using data mining algorithms, thereby contributing to the digital transformation of the main
business processes of the education system.
References
1. L. Dallemule, T. Deivenport, Harvard business review (Russia), 49-57, (2018)
2. Ministry of education and science of Perm Krai, Unified information and analytical
system (UIAS) http://edustat.iro.perm.ru/
3. A. I. Mitin, T. A. Filicheva, G. V. Plekhanov Russian University of Economics, 4 (99),
46-51 (2013)
4. T. A. Filicheva, Information-analytical methods of monitoring the quality system of
training managerial personnel, http://www.vivakadry.com/87.htm
5. Committee on Statistics Ministry of National Economy of the Republic of Kazakhstan,
https://taldau.stat.gov.kz/
6. D. Isaev, Analytical Information Systems (Training Manual), 60 (State University,
Moscow, 2008)
7. B. Minto, The Pyramid Principle: Logic in Writing and Thinking (Pearson Education
Limited, United Kingdom, 2009)
8. K. E. Wiegers, Software Requirements Second Edition Practical techniques for
gathering and managering requirements throughout the development cycle (Microsoft
Press, 2014)
9. E. M. Rasiel, P. N. Friga, The McKinsey Mind Understanding and Implementing the
Problem-Solving Tools and Management Techniques of the World’s Top Strategic
Consulting Firm (McGraw-Hill, 2009)
10. A. L. Dyckhoff, Action research and learning analytics in higher education (2014)
11. P. Arroway, G. Morgan, M. O’Keefe, R. Yanosky, Learning Analytics in Higher
Education (Educause center for analysis and research, 2016)
12. V. L. Uskov, J. P. Bakken, A. Shah, T. Krock1, A. Uskov, J. Syamala, R. Rachakonda,
Springer International Publishing AG, part of Springer Nature, 3, 3-16 (2019)
13. E. Mishchenko, P. Monastyrev, O. Evdokimtsev, IOP Conference Series: Materials
Science and Engineering, 463 (2018)
14. K. Reda, Ch. Tantipathananandh, A. Johnson, J. Leigh, T. Berger-Wolf. IEEE
Symposium on Visualization, 3, 1061-1070 (2011)
11
E3S Web of Conferences 159, 09003 (2020)
BTSES-2020
https://doi.org/10.1051/e3sconf/202015909003

15. T. N. Dang, N. Pendar, A. G. Forbes, Computer Graphics Forum, 61-69 (2016)
16. B. Bach, P. Dragicevic, D. Archambault, C. Hurter, S. Carpendale, Computer Graphics
Forum, 36, 6, (2017)
17. A. J. Pretorius, I. A. Khan, R. J. Errington, Computer Graphics Forum, 36, 46-63 (2016)
18. Abdrakhmanova, M., Mutanov, G., Mamykova, Z., & Tukeyev, U. Springer, Cham.G.
(2018, September). DOI: 10.1007/978-3-319-98443-8_32
12
E3S Web of Conferences 159, 09003 (2020)
BTSES-2020
https://doi.org/10.1051/e3sconf/202015909003
⊘ This is a preview!⊘
Do you want full access?
Subscribe today to unlock all pages.
Trusted by 1+ million students worldwide
1 out of 12
Related Documents


Your All-in-One AI-Powered Toolkit for Academic Success.
+13062052269
info@desklib.com
Available 24*7 on WhatsApp / Email
![[object Object]](/_next/static/media/star-bottom.7253800d.svg)
Unlock your academic potential
Copyright © 2020–2026 A2Z Services. All Rights Reserved. Developed and managed by ZUCOL.