Applied Economics Report: Regression Analysis, Maltese Economy, GDP
VerifiedAdded on 2020/01/06
|17
|4355
|163
Report
AI Summary
This report delves into applied economics, commencing with a regression analysis to establish relationships between variables like stock value, total assets, net profit, 5-year EPS growth rate, and total debt. The analysis utilizes multiple regression, ANOVA tables, and coefficient interpretations to assess the impact of these factors on market capitalization. The report then shifts focus to the Maltese economy, examining factors influencing it during the 2008-2010 recession, real GDP values, and comparisons with EU real GDP growth rates. It explores whether GDP indicates a high quality of life, offering a comprehensive economic overview. The report's findings highlight the significant influence of net profit and assets on market value, while also discussing the relationship between EPS, total debt, and market capitalization. The report concludes by suggesting factor analysis for further study on market value determinants.

APPLIED ECONOMICS
Paraphrase This Document
Need a fresh take? Get an instant paraphrase of this document with our AI Paraphraser
TABLE OF CONTENT
INTRODUCTION.........................................................................................................................................2
Question 1......................................................................................................................................................2
Question 2......................................................................................................................................................7
(2) Factors of the Maltese economy that mostly affected during recession time period from 2008-2010 9
(3) Values of real GDP at constant prices..................................................................................................9
(4) Charting of real and nominal GDP.....................................................................................................11
(5) Charting of Malta economy and EU real GDP growth rate...............................................................13
(6) Do GDP indicate high quality of life.................................................................................................15
CONCLUSION............................................................................................................................................15
REFERENCES............................................................................................................................................16
INTRODUCTION
Economics is one of the important domain in which number of studies are conducted time to
time. In this report, regression model is applied and relationship between stock value and other variables
is identified. ANNOVA table is produced in the report and its various aspects are described in detail in
the report. In the second part of the report, Maltese economy is analyzed on the basis of various factors
and performance of mentioned nation is compared with EU economy growth rate and comments are done
on same.
Question 1
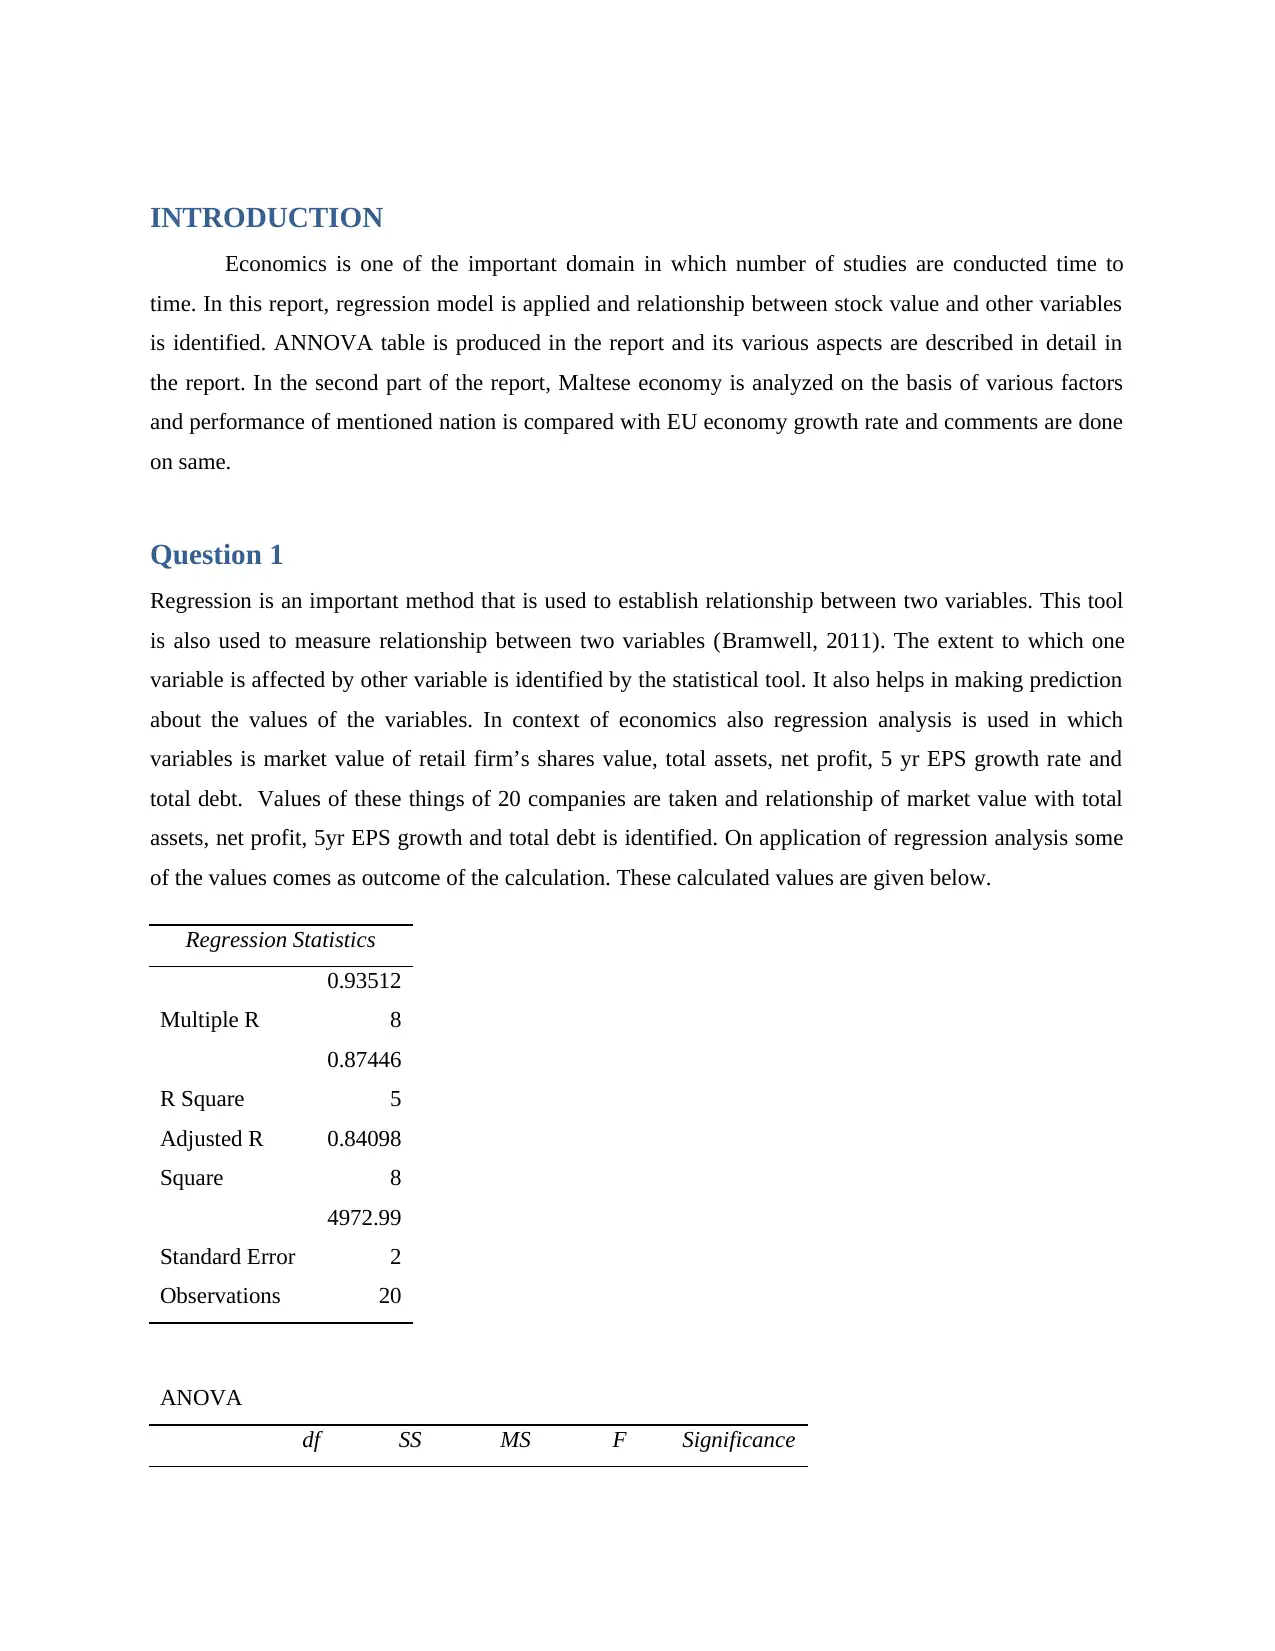
Regression is an important method that is used to establish relationship between two variables. This tool
is also used to measure relationship between two variables (Bramwell, 2011). The extent to which one
variable is affected by other variable is identified by the statistical tool. It also helps in making prediction
about the values of the variables. In context of economics also regression analysis is used in which
variables is market value of retail firm’s shares value, total assets, net profit, 5 yr EPS growth rate and
total debt. Values of these things of 20 companies are taken and relationship of market value with total
assets, net profit, 5yr EPS growth and total debt is identified. On application of regression analysis some
of the values comes as outcome of the calculation. These calculated values are given below.
Regression Statistics
Multiple R
0.93512
8
R Square
0.87446
5
Adjusted R
Square
0.84098
8
Standard Error
4972.99
2
Observations 20
ANOVA
df SS MS F Significance
Economics is one of the important domain in which number of studies are conducted time to
time. In this report, regression model is applied and relationship between stock value and other variables
is identified. ANNOVA table is produced in the report and its various aspects are described in detail in
the report. In the second part of the report, Maltese economy is analyzed on the basis of various factors
and performance of mentioned nation is compared with EU economy growth rate and comments are done
on same.
Question 1
Regression is an important method that is used to establish relationship between two variables. This tool
is also used to measure relationship between two variables (Bramwell, 2011). The extent to which one
variable is affected by other variable is identified by the statistical tool. It also helps in making prediction
about the values of the variables. In context of economics also regression analysis is used in which
variables is market value of retail firm’s shares value, total assets, net profit, 5 yr EPS growth rate and
total debt. Values of these things of 20 companies are taken and relationship of market value with total
assets, net profit, 5yr EPS growth and total debt is identified. On application of regression analysis some
of the values comes as outcome of the calculation. These calculated values are given below.
Regression Statistics
Multiple R
0.93512
8
R Square
0.87446
5
Adjusted R
Square
0.84098
8
Standard Error
4972.99
2
Observations 20
ANOVA
df SS MS F Significance
⊘ This is a preview!⊘
Do you want full access?
Subscribe today to unlock all pages.
Trusted by 1+ million students worldwide
F
Regressio
n 4
2.58E+0
9
6.46E+0
8
26.1220
4
1.31578E-
06
Residual 15
3.71E+0
8
2473065
0
Total 19
2.96E+0
9
Coefficient
s
Standar
d Error t Stat P-value Lower 95%
Upper
95%
Lower
95.0%
Upper
95.0%
Intercept -1431.96
1449.90
1
-
0.98762
0.33900
1
-
4522.34728
3
1658.43
4
-
4522.35
1658.43
4
X Variable 1 1.396164
0.82796
8
1.68625
4
0.11242
9
-
0.36860767
3
3.16093
6
-
0.36861
3.16093
6
X Variable 2 22.83873
3.47836
9 6.56593
8.95E-
06
15.4247594
5
30.2526
9
15.4247
6
30.2526
9
X Variable 3 2.687755
33.8551
9 0.07939
0.93777
2
-
69.4728703
2
74.8483
8
-
69.4729
74.8483
8
X Variable 4 -2.39272
1.89904
9
-
1.25996
0.22693
5
-
6.44044949
2
1.65500
6
-
6.44045
1.65500
6
RESIDUAL OUTPUT
Observatio
n
Predicted
Y
Residual
s
1 -427.84 1327.84
2 4327.166
669.733
7
3 4705.736 -598.636
Paraphrase This Document
Need a fresh take? Get an instant paraphrase of this document with our AI Paraphraser
4 -421.438
1772.03
8
5 80.68888
843.911
1
6 -1247.01
2116.10
6
7 -1709.59 1777.49
8 21551.45 -11735.4
9 -1339.51
1405.20
9
10 -456.727
911.826
8
11 12681.28 -1793.28
12 -748.594
2015.09
4
13 2400.633
99.5665
7
14 20317.65 -9231.85
15 1619.261
130.839
5
16 17008.81
1882.89
1
17 -552.279
1628.97
9
18 45160.35
10318.4
5
19 6668.559 -3336.76
20 7031.588 -204.088
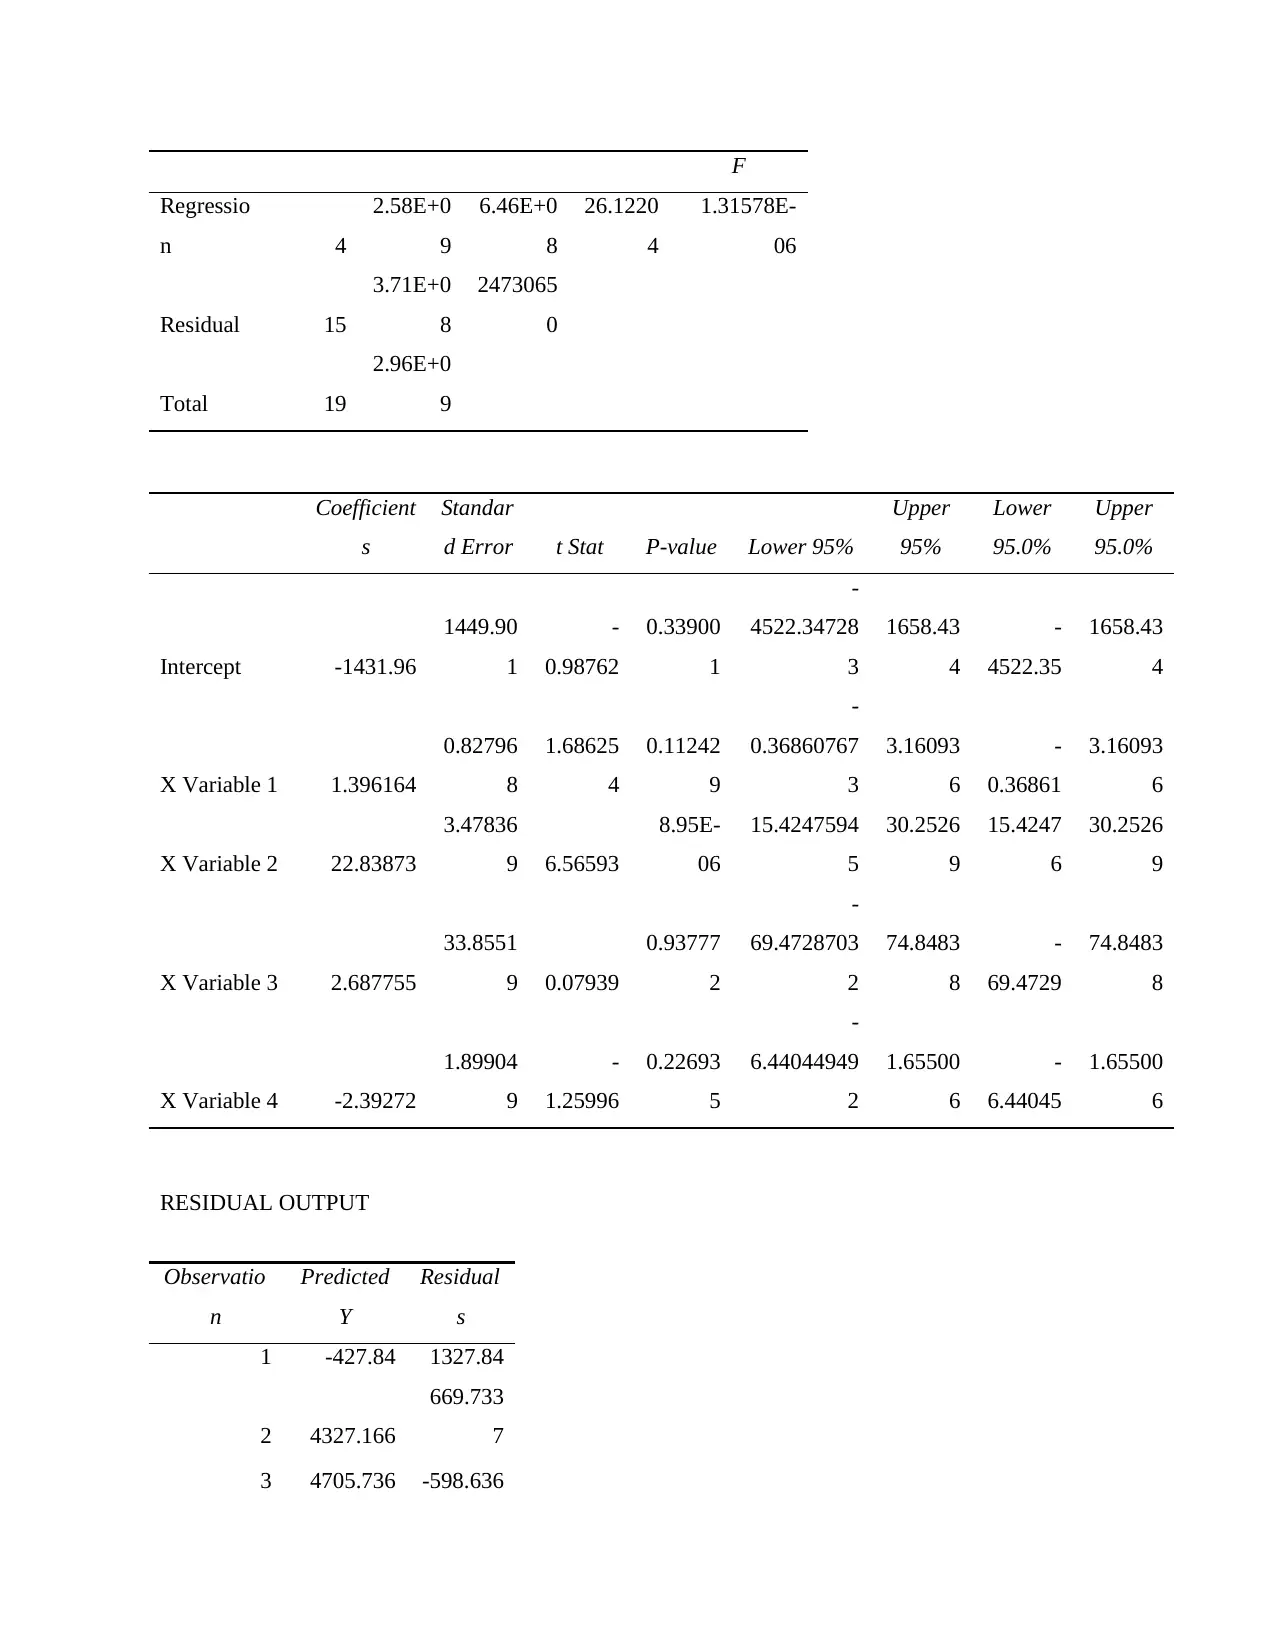
Interpretation of results
Multiple regression- This is important value of this table and it can be seen that value of multiple
regression is 0.93 which means that stocks value is highly correlated to the change in total assets, bet
1772.03
8
5 80.68888
843.911
1
6 -1247.01
2116.10
6
7 -1709.59 1777.49
8 21551.45 -11735.4
9 -1339.51
1405.20
9
10 -456.727
911.826
8
11 12681.28 -1793.28
12 -748.594
2015.09
4
13 2400.633
99.5665
7
14 20317.65 -9231.85
15 1619.261
130.839
5
16 17008.81
1882.89
1
17 -552.279
1628.97
9
18 45160.35
10318.4
5
19 6668.559 -3336.76
20 7031.588 -204.088
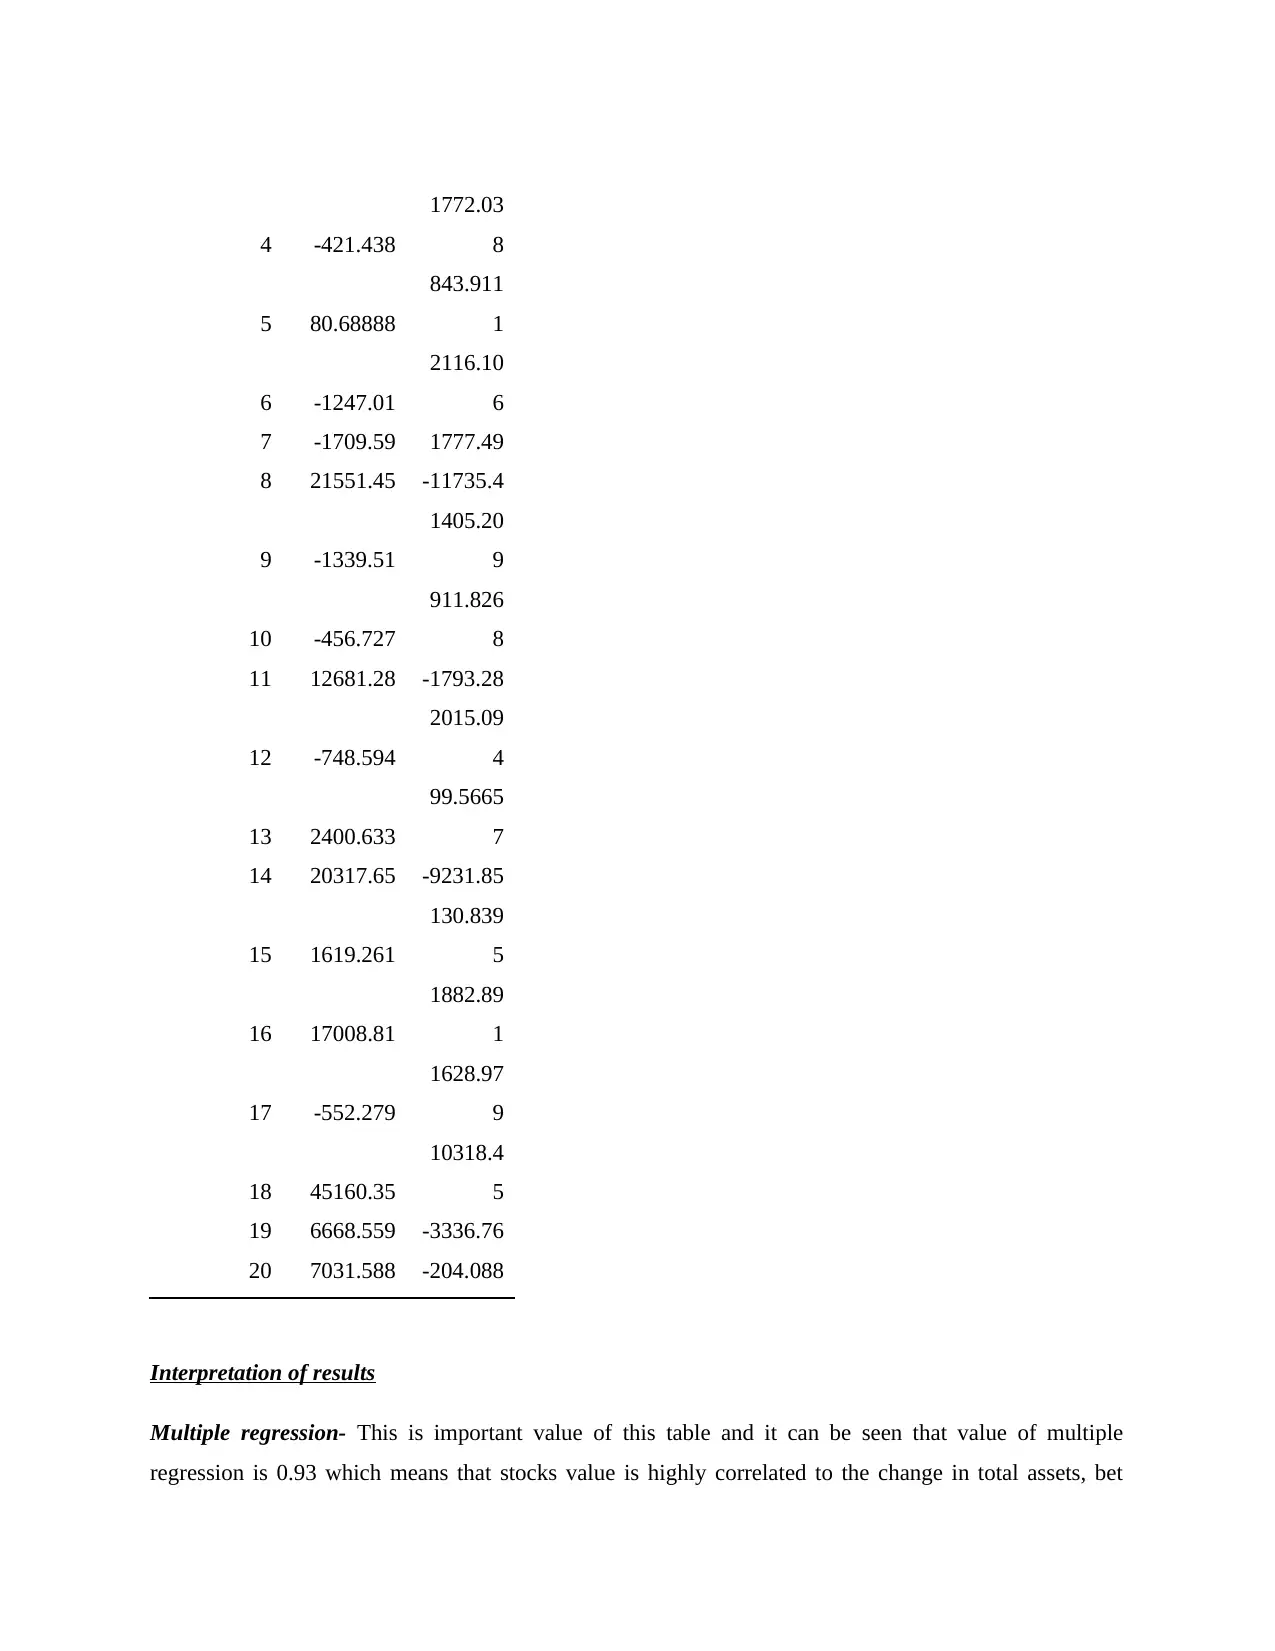
Interpretation of results
Multiple regression- This is important value of this table and it can be seen that value of multiple
regression is 0.93 which means that stocks value is highly correlated to the change in total assets, bet
profit, earning per share and total debt. This tool is used to establish relationship between two variable
and its value always remain in range of -1,0 and +1. If value of multiple regressions is in range of 0-1
then it means that there is perfect relationship between two variables. More will be the value increase
more will be strong relationship will be established between variables. If value of multiple regressions is
one then it indicates that there is perfect relationship between values of variables. Here value of multiple
regression is 0.93 which is much closer to one and this means that market value of all retail firms shares
depends on the firms net profit, assets, earning per share and debt. If value of these 4 variables will
change then value of multiple regression will also get changed.
Regression- Value of regression in this table indicates the extent to which changes are observed in
dependent variable values when values of independent variable get changed. Here, value of regression is
0.87 and it means that if values of net profit, assets, earning per share and debt will get changed then there
are 87% chances of change in market value of the company. Hence, it can be said that value of shares in
the market or firms shares market capitalization greatly depends or affected by net profit, assets, earning
per share and debt. This indicates that if firms will not perform well then their shares value will decline
sharply.
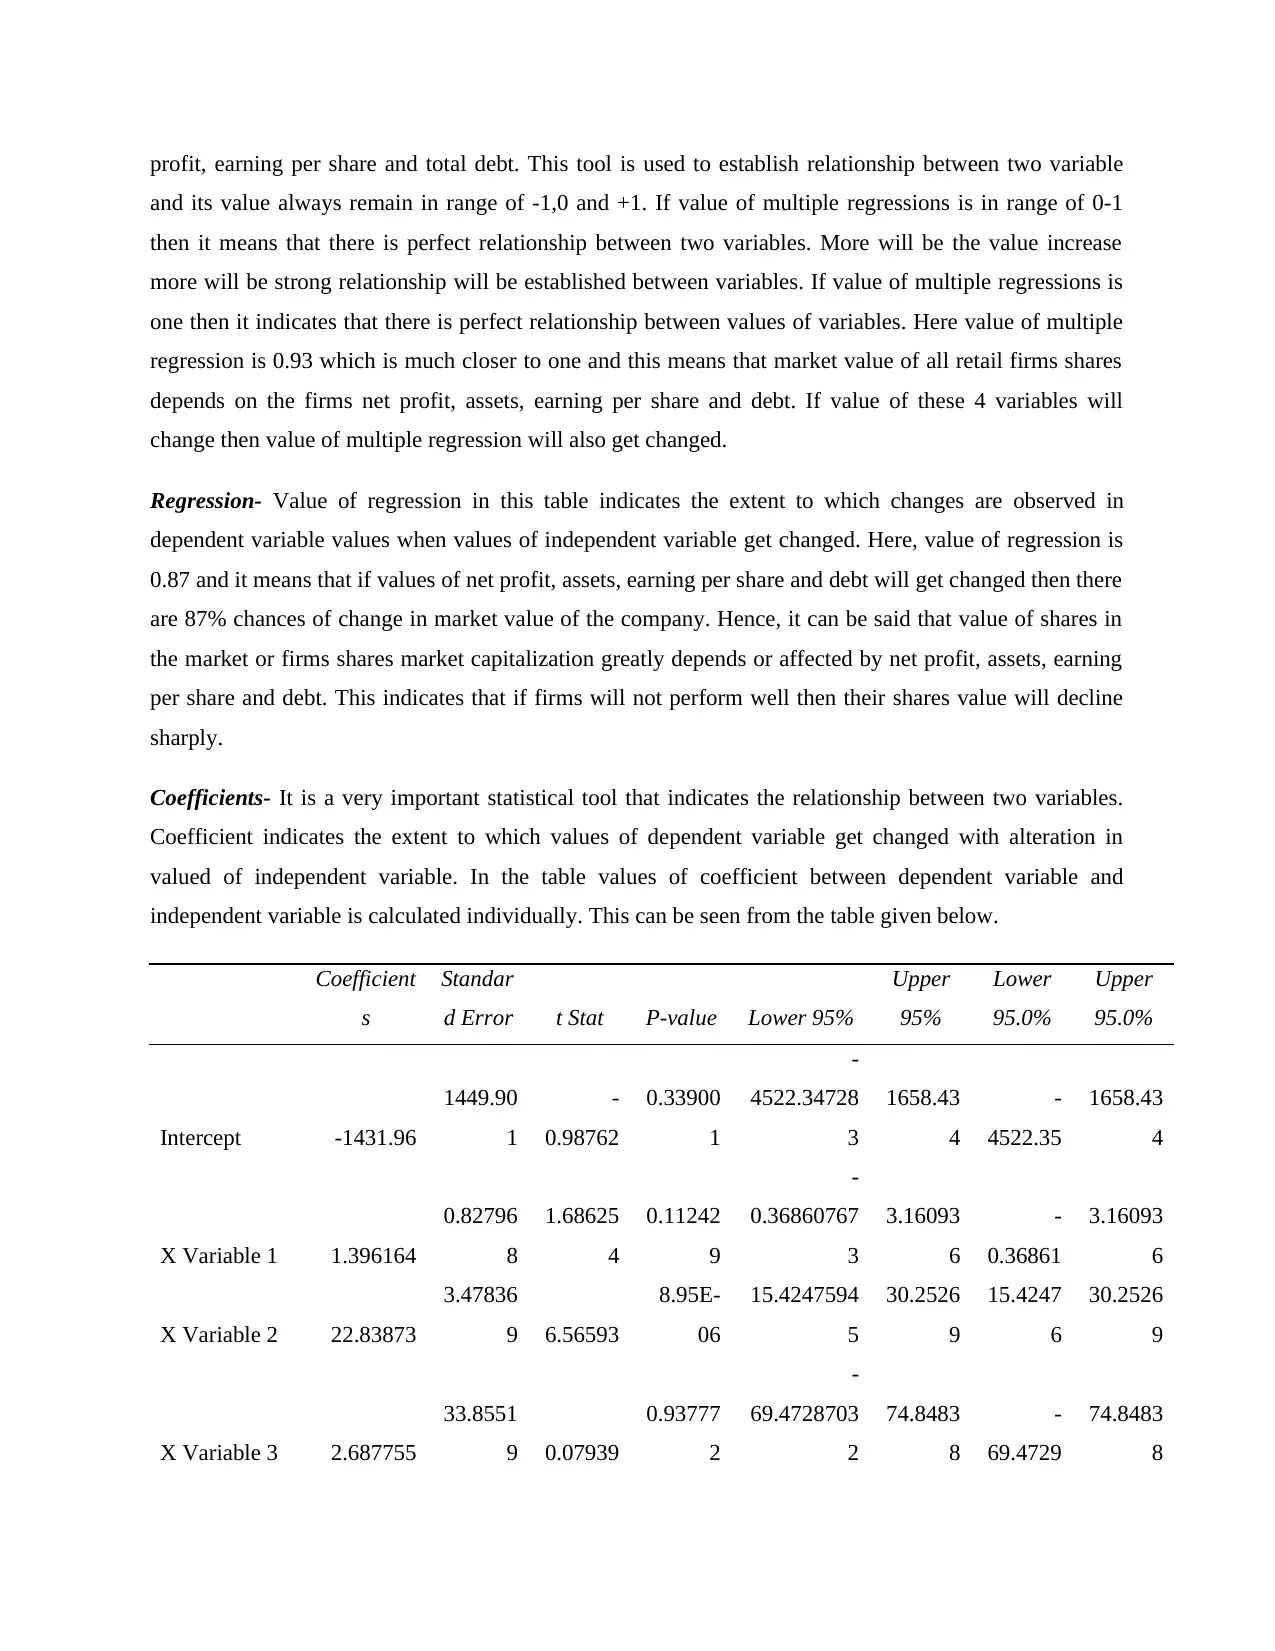
Coefficients- It is a very important statistical tool that indicates the relationship between two variables.
Coefficient indicates the extent to which values of dependent variable get changed with alteration in
valued of independent variable. In the table values of coefficient between dependent variable and
independent variable is calculated individually. This can be seen from the table given below.
Coefficient
s
Standar
d Error t Stat P-value Lower 95%
Upper
95%
Lower
95.0%
Upper
95.0%
Intercept -1431.96
1449.90
1
-
0.98762
0.33900
1
-
4522.34728
3
1658.43
4
-
4522.35
1658.43
4
X Variable 1 1.396164
0.82796
8
1.68625
4
0.11242
9
-
0.36860767
3
3.16093
6
-
0.36861
3.16093
6
X Variable 2 22.83873
3.47836
9 6.56593
8.95E-
06
15.4247594
5
30.2526
9
15.4247
6
30.2526
9
X Variable 3 2.687755
33.8551
9 0.07939
0.93777
2
-
69.4728703
2
74.8483
8
-
69.4729
74.8483
8
and its value always remain in range of -1,0 and +1. If value of multiple regressions is in range of 0-1
then it means that there is perfect relationship between two variables. More will be the value increase
more will be strong relationship will be established between variables. If value of multiple regressions is
one then it indicates that there is perfect relationship between values of variables. Here value of multiple
regression is 0.93 which is much closer to one and this means that market value of all retail firms shares
depends on the firms net profit, assets, earning per share and debt. If value of these 4 variables will
change then value of multiple regression will also get changed.
Regression- Value of regression in this table indicates the extent to which changes are observed in
dependent variable values when values of independent variable get changed. Here, value of regression is
0.87 and it means that if values of net profit, assets, earning per share and debt will get changed then there
are 87% chances of change in market value of the company. Hence, it can be said that value of shares in
the market or firms shares market capitalization greatly depends or affected by net profit, assets, earning
per share and debt. This indicates that if firms will not perform well then their shares value will decline
sharply.
Coefficients- It is a very important statistical tool that indicates the relationship between two variables.
Coefficient indicates the extent to which values of dependent variable get changed with alteration in
valued of independent variable. In the table values of coefficient between dependent variable and
independent variable is calculated individually. This can be seen from the table given below.
Coefficient
s
Standar
d Error t Stat P-value Lower 95%
Upper
95%
Lower
95.0%
Upper
95.0%
Intercept -1431.96
1449.90
1
-
0.98762
0.33900
1
-
4522.34728
3
1658.43
4
-
4522.35
1658.43
4
X Variable 1 1.396164
0.82796
8
1.68625
4
0.11242
9
-
0.36860767
3
3.16093
6
-
0.36861
3.16093
6
X Variable 2 22.83873
3.47836
9 6.56593
8.95E-
06
15.4247594
5
30.2526
9
15.4247
6
30.2526
9
X Variable 3 2.687755
33.8551
9 0.07939
0.93777
2
-
69.4728703
2
74.8483
8
-
69.4729
74.8483
8
⊘ This is a preview!⊘
Do you want full access?
Subscribe today to unlock all pages.
Trusted by 1+ million students worldwide
X Variable 4 -2.39272
1.89904
9
-
1.25996
0.22693
5
-
6.44044949
2
1.65500
6
-
6.44045
1.65500
6
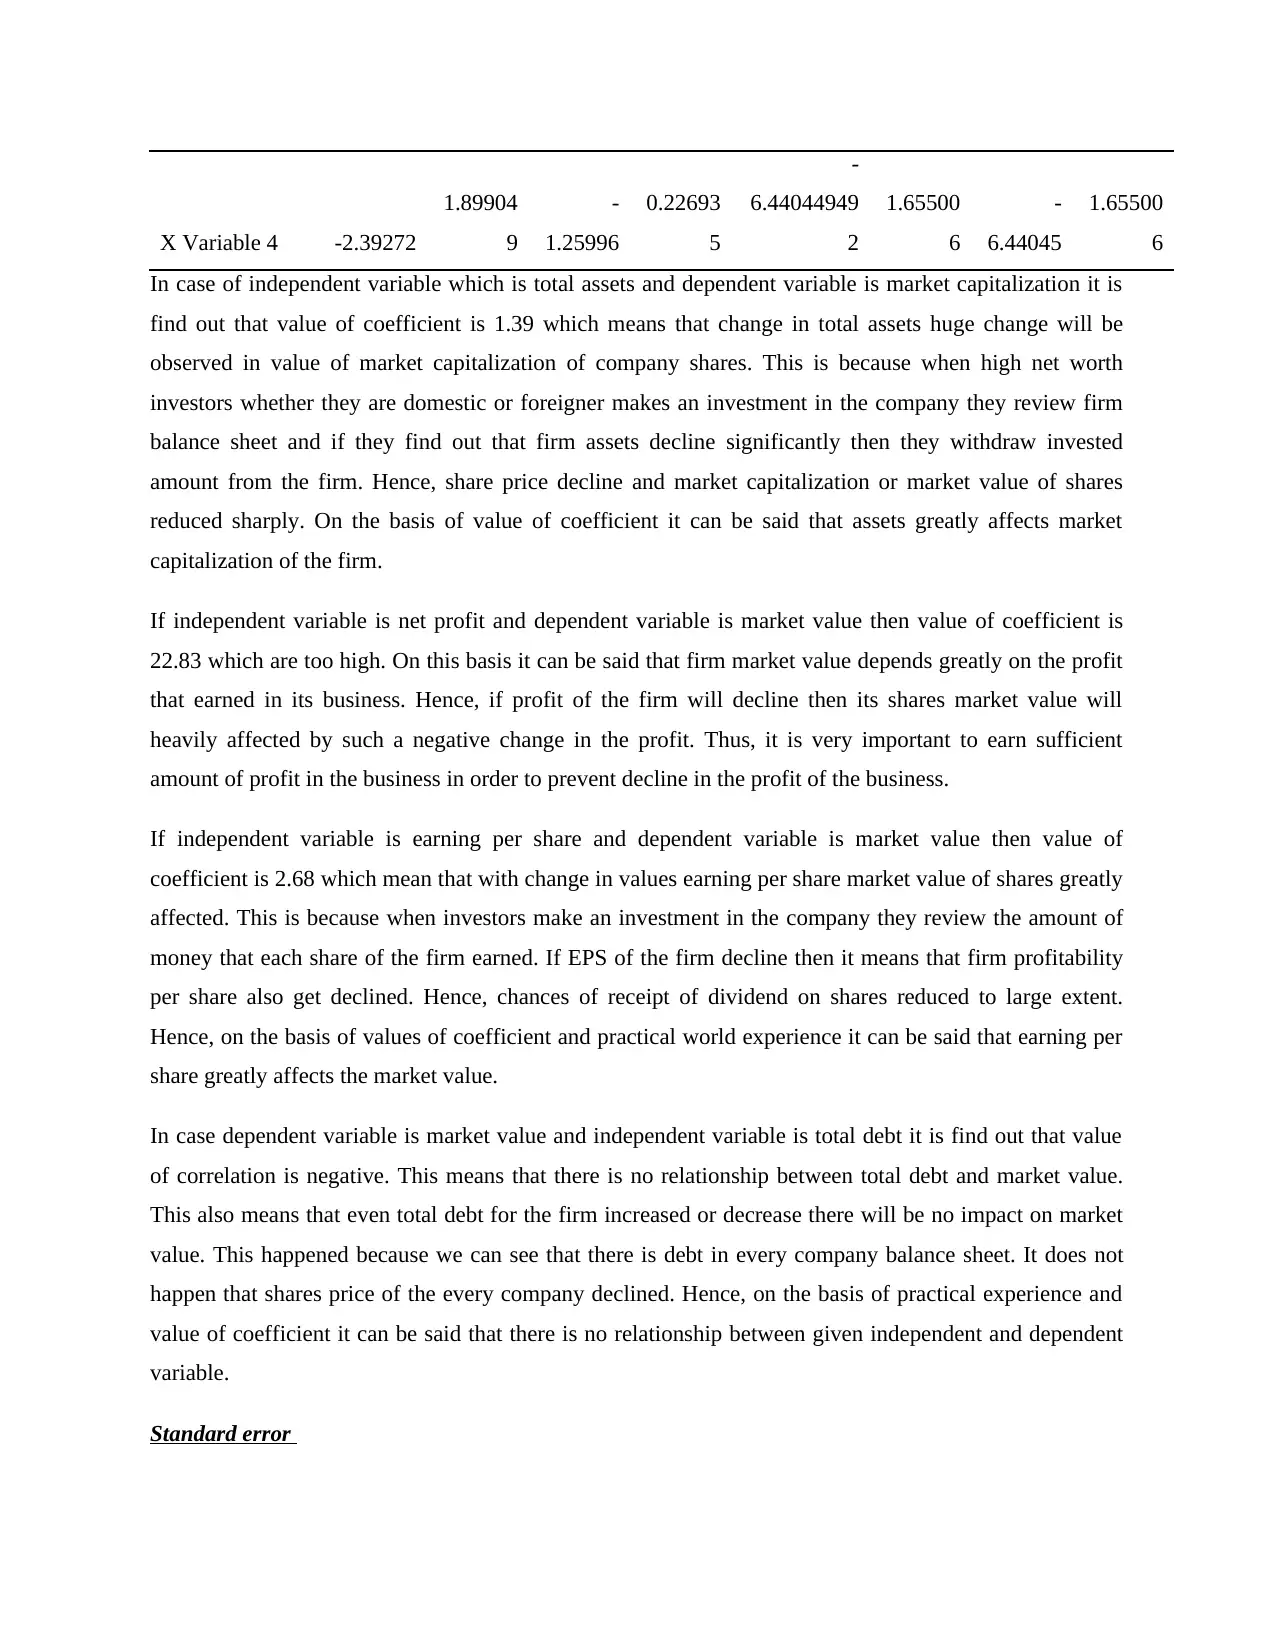
In case of independent variable which is total assets and dependent variable is market capitalization it is
find out that value of coefficient is 1.39 which means that change in total assets huge change will be
observed in value of market capitalization of company shares. This is because when high net worth
investors whether they are domestic or foreigner makes an investment in the company they review firm
balance sheet and if they find out that firm assets decline significantly then they withdraw invested
amount from the firm. Hence, share price decline and market capitalization or market value of shares
reduced sharply. On the basis of value of coefficient it can be said that assets greatly affects market
capitalization of the firm.
If independent variable is net profit and dependent variable is market value then value of coefficient is
22.83 which are too high. On this basis it can be said that firm market value depends greatly on the profit
that earned in its business. Hence, if profit of the firm will decline then its shares market value will
heavily affected by such a negative change in the profit. Thus, it is very important to earn sufficient
amount of profit in the business in order to prevent decline in the profit of the business.
If independent variable is earning per share and dependent variable is market value then value of
coefficient is 2.68 which mean that with change in values earning per share market value of shares greatly
affected. This is because when investors make an investment in the company they review the amount of
money that each share of the firm earned. If EPS of the firm decline then it means that firm profitability
per share also get declined. Hence, chances of receipt of dividend on shares reduced to large extent.
Hence, on the basis of values of coefficient and practical world experience it can be said that earning per
share greatly affects the market value.
In case dependent variable is market value and independent variable is total debt it is find out that value
of correlation is negative. This means that there is no relationship between total debt and market value.
This also means that even total debt for the firm increased or decrease there will be no impact on market
value. This happened because we can see that there is debt in every company balance sheet. It does not
happen that shares price of the every company declined. Hence, on the basis of practical experience and
value of coefficient it can be said that there is no relationship between given independent and dependent
variable.
Standard error
1.89904
9
-
1.25996
0.22693
5
-
6.44044949
2
1.65500
6
-
6.44045
1.65500
6
In case of independent variable which is total assets and dependent variable is market capitalization it is
find out that value of coefficient is 1.39 which means that change in total assets huge change will be
observed in value of market capitalization of company shares. This is because when high net worth
investors whether they are domestic or foreigner makes an investment in the company they review firm
balance sheet and if they find out that firm assets decline significantly then they withdraw invested
amount from the firm. Hence, share price decline and market capitalization or market value of shares
reduced sharply. On the basis of value of coefficient it can be said that assets greatly affects market
capitalization of the firm.
If independent variable is net profit and dependent variable is market value then value of coefficient is
22.83 which are too high. On this basis it can be said that firm market value depends greatly on the profit
that earned in its business. Hence, if profit of the firm will decline then its shares market value will
heavily affected by such a negative change in the profit. Thus, it is very important to earn sufficient
amount of profit in the business in order to prevent decline in the profit of the business.
If independent variable is earning per share and dependent variable is market value then value of
coefficient is 2.68 which mean that with change in values earning per share market value of shares greatly
affected. This is because when investors make an investment in the company they review the amount of
money that each share of the firm earned. If EPS of the firm decline then it means that firm profitability
per share also get declined. Hence, chances of receipt of dividend on shares reduced to large extent.
Hence, on the basis of values of coefficient and practical world experience it can be said that earning per
share greatly affects the market value.
In case dependent variable is market value and independent variable is total debt it is find out that value
of correlation is negative. This means that there is no relationship between total debt and market value.
This also means that even total debt for the firm increased or decrease there will be no impact on market
value. This happened because we can see that there is debt in every company balance sheet. It does not
happen that shares price of the every company declined. Hence, on the basis of practical experience and
value of coefficient it can be said that there is no relationship between given independent and dependent
variable.
Standard error
Paraphrase This Document
Need a fresh take? Get an instant paraphrase of this document with our AI Paraphraser
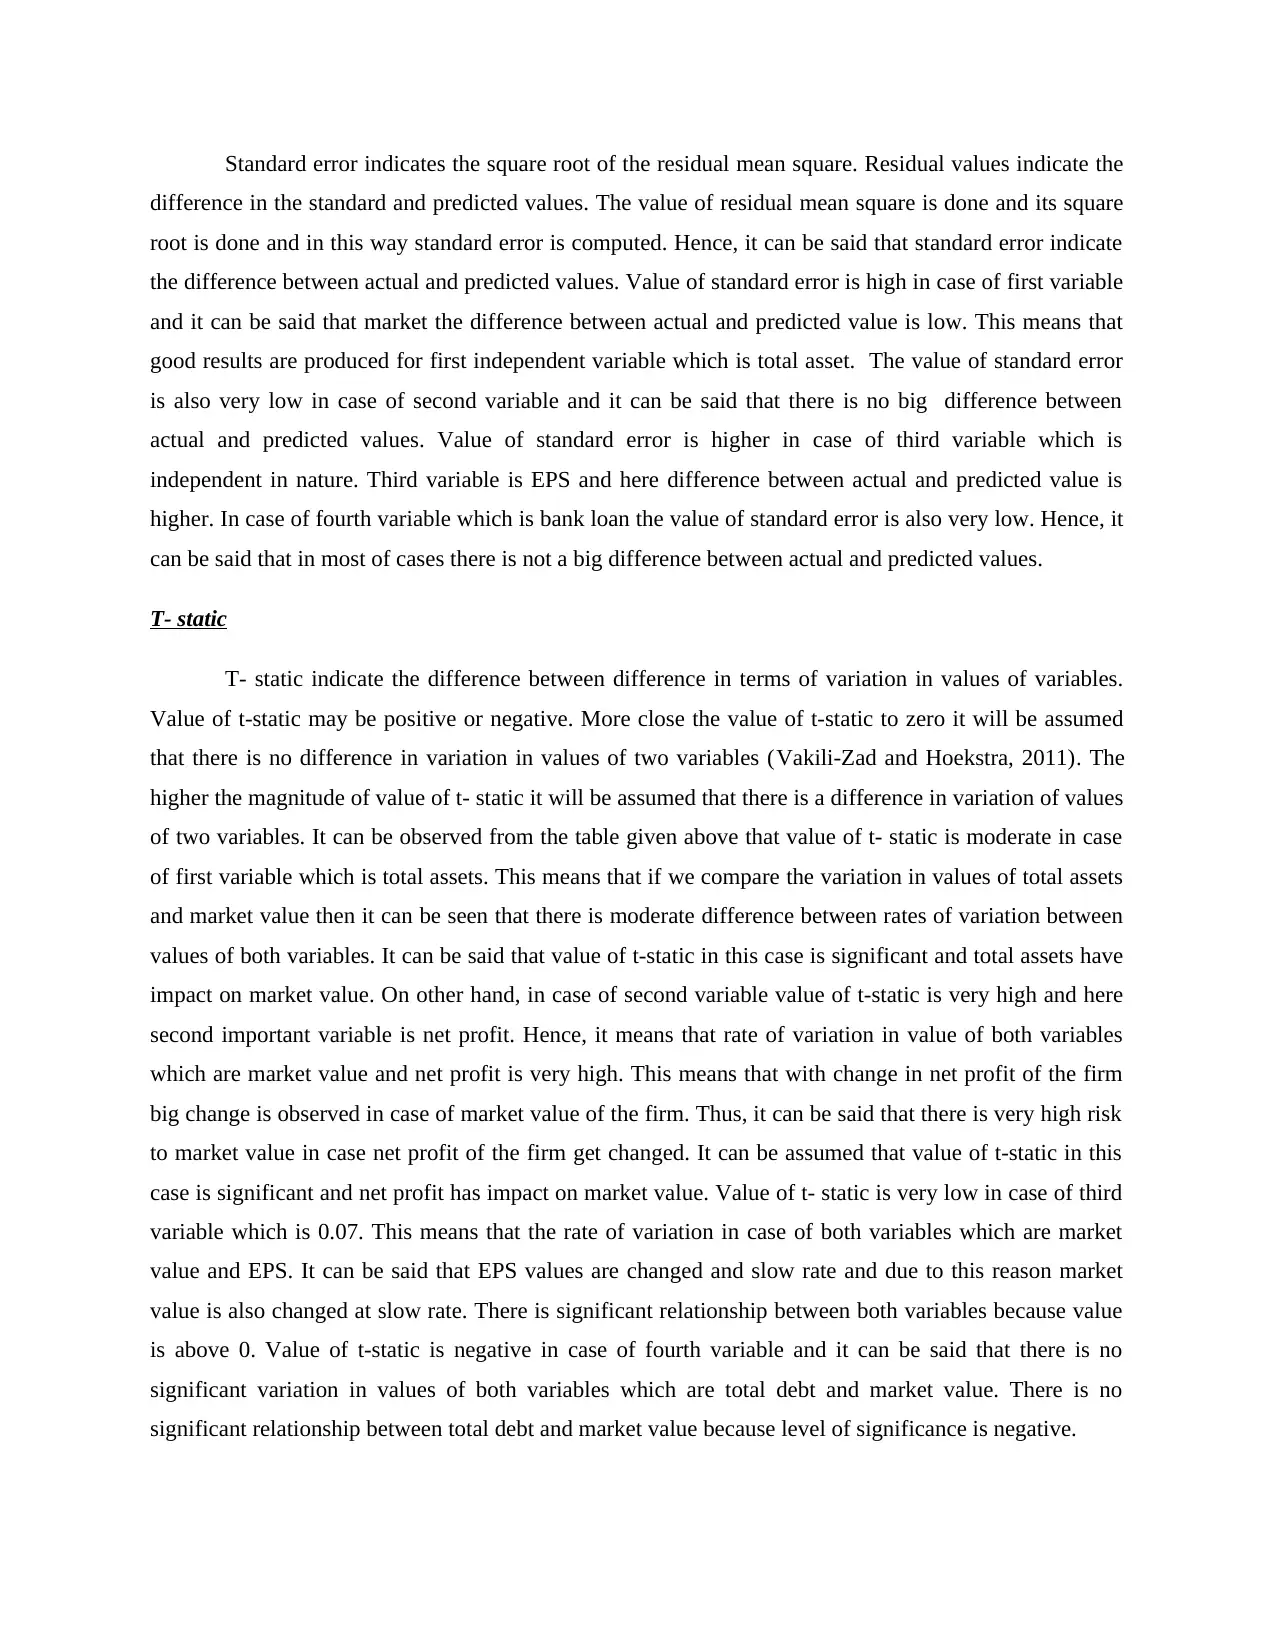
Standard error indicates the square root of the residual mean square. Residual values indicate the
difference in the standard and predicted values. The value of residual mean square is done and its square
root is done and in this way standard error is computed. Hence, it can be said that standard error indicate
the difference between actual and predicted values. Value of standard error is high in case of first variable
and it can be said that market the difference between actual and predicted value is low. This means that
good results are produced for first independent variable which is total asset. The value of standard error
is also very low in case of second variable and it can be said that there is no big difference between
actual and predicted values. Value of standard error is higher in case of third variable which is
independent in nature. Third variable is EPS and here difference between actual and predicted value is
higher. In case of fourth variable which is bank loan the value of standard error is also very low. Hence, it
can be said that in most of cases there is not a big difference between actual and predicted values.
T- static
T- static indicate the difference between difference in terms of variation in values of variables.
Value of t-static may be positive or negative. More close the value of t-static to zero it will be assumed
that there is no difference in variation in values of two variables (Vakili-Zad and Hoekstra, 2011). The
higher the magnitude of value of t- static it will be assumed that there is a difference in variation of values
of two variables. It can be observed from the table given above that value of t- static is moderate in case
of first variable which is total assets. This means that if we compare the variation in values of total assets
and market value then it can be seen that there is moderate difference between rates of variation between
values of both variables. It can be said that value of t-static in this case is significant and total assets have
impact on market value. On other hand, in case of second variable value of t-static is very high and here
second important variable is net profit. Hence, it means that rate of variation in value of both variables
which are market value and net profit is very high. This means that with change in net profit of the firm
big change is observed in case of market value of the firm. Thus, it can be said that there is very high risk
to market value in case net profit of the firm get changed. It can be assumed that value of t-static in this
case is significant and net profit has impact on market value. Value of t- static is very low in case of third
variable which is 0.07. This means that the rate of variation in case of both variables which are market
value and EPS. It can be said that EPS values are changed and slow rate and due to this reason market
value is also changed at slow rate. There is significant relationship between both variables because value
is above 0. Value of t-static is negative in case of fourth variable and it can be said that there is no
significant variation in values of both variables which are total debt and market value. There is no
significant relationship between total debt and market value because level of significance is negative.
In order to do more study on the determinants of the market value of common stock of retailers
and other types of companies it is suggested that one can do factor analysis. This is because number of
factors affects value of the specific variable. In factor analysis impact of those variables is measured that
are in small proportion but put huge impact on the relationship between variables. Hence, if possible
factor analysis can be used to do more study on the determinants of the market value of common stock of
retailer’s vs. other types of companies. Other factors that affect market value of shares like change in
values of PE ratio can also be included in study in order to get more accurate view of the factors that
mostly affects the value of the shares in the market.
Casual analysis, forecasting an effect and trend forecasting is also done in the report. Casual
analysis is already done by interpreting values of R square. Forecasting an effect is done by using
multiple regression values. Whereas, trend forecasting is done by using residual table. In this way
regression analysis is done for this question.
Question 2
1 2 3 4 5 6 7 8 9 10 11 12 13 14 15 16
0.0
1,000.0
2,000.0
3,000.0
4,000.0
5,000.0
6,000.0
C1
G
I
⊘ This is a preview!⊘
Do you want full access?
Subscribe today to unlock all pages.
Trusted by 1+ million students worldwide
1 2 3 4 5 6 7 8 9 10 11 12 13 14 15 16
0.0
1,000.0
2,000.0
3,000.0
4,000.0
5,000.0
6,000.0
7,000.0
8,000.0
X
M
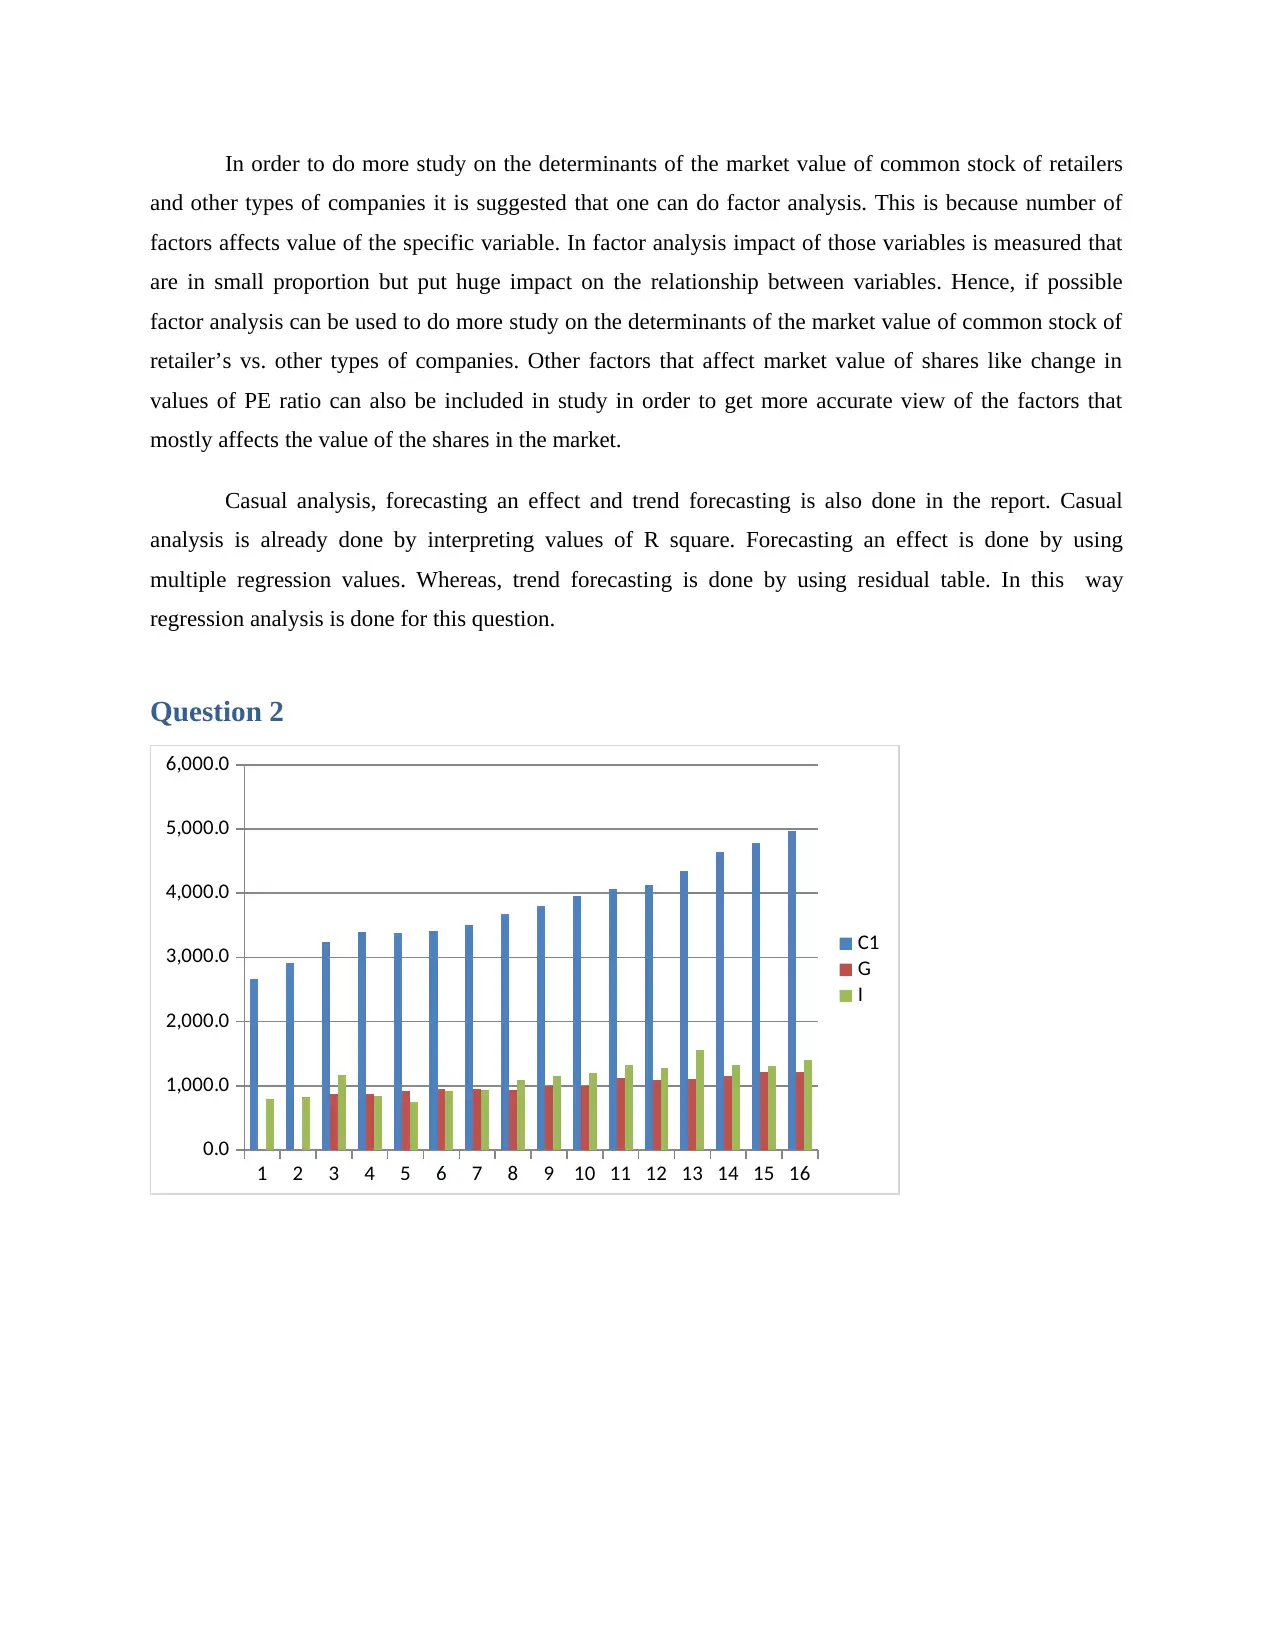
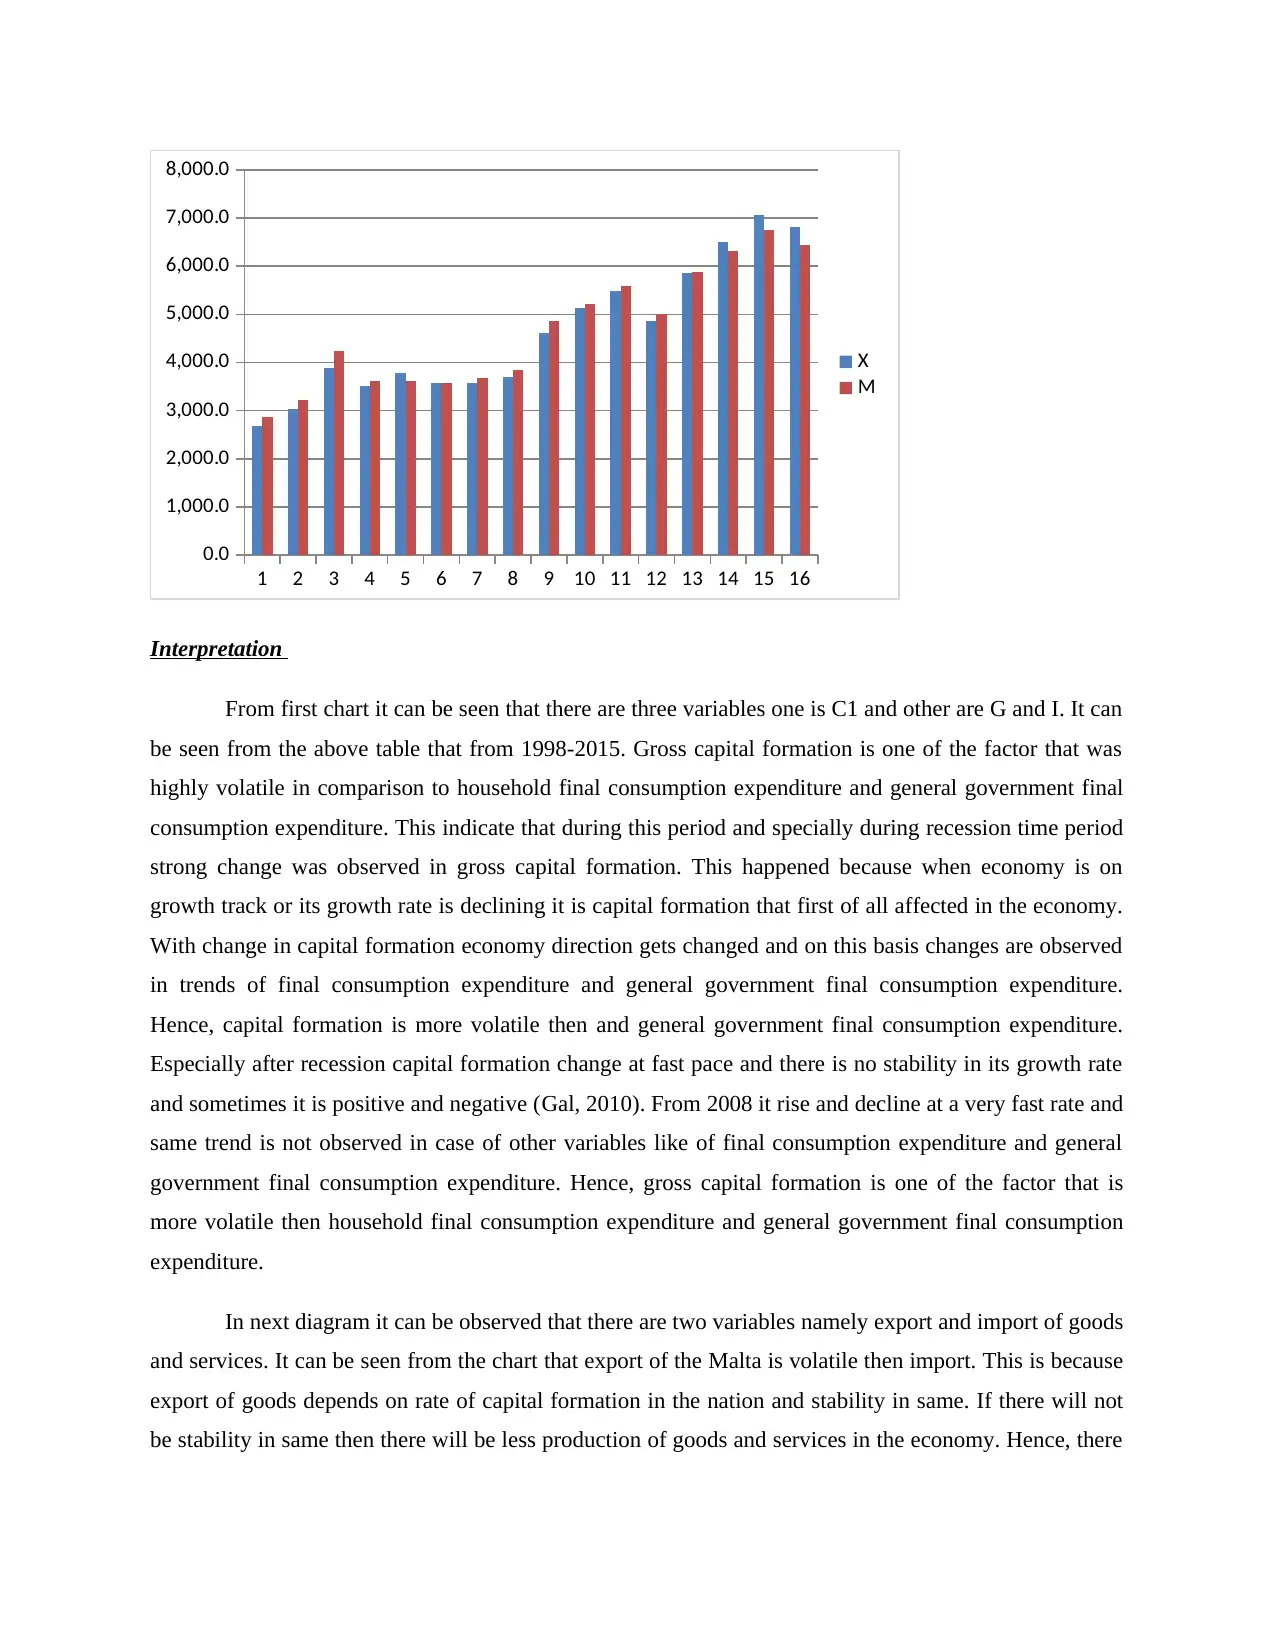
Interpretation
From first chart it can be seen that there are three variables one is C1 and other are G and I. It can
be seen from the above table that from 1998-2015. Gross capital formation is one of the factor that was
highly volatile in comparison to household final consumption expenditure and general government final
consumption expenditure. This indicate that during this period and specially during recession time period
strong change was observed in gross capital formation. This happened because when economy is on
growth track or its growth rate is declining it is capital formation that first of all affected in the economy.
With change in capital formation economy direction gets changed and on this basis changes are observed
in trends of final consumption expenditure and general government final consumption expenditure.
Hence, capital formation is more volatile then and general government final consumption expenditure.
Especially after recession capital formation change at fast pace and there is no stability in its growth rate
and sometimes it is positive and negative (Gal, 2010). From 2008 it rise and decline at a very fast rate and
same trend is not observed in case of other variables like of final consumption expenditure and general
government final consumption expenditure. Hence, gross capital formation is one of the factor that is
more volatile then household final consumption expenditure and general government final consumption
expenditure.
In next diagram it can be observed that there are two variables namely export and import of goods
and services. It can be seen from the chart that export of the Malta is volatile then import. This is because
export of goods depends on rate of capital formation in the nation and stability in same. If there will not
be stability in same then there will be less production of goods and services in the economy. Hence, there
0.0
1,000.0
2,000.0
3,000.0
4,000.0
5,000.0
6,000.0
7,000.0
8,000.0
X
M
Interpretation
From first chart it can be seen that there are three variables one is C1 and other are G and I. It can
be seen from the above table that from 1998-2015. Gross capital formation is one of the factor that was
highly volatile in comparison to household final consumption expenditure and general government final
consumption expenditure. This indicate that during this period and specially during recession time period
strong change was observed in gross capital formation. This happened because when economy is on
growth track or its growth rate is declining it is capital formation that first of all affected in the economy.
With change in capital formation economy direction gets changed and on this basis changes are observed
in trends of final consumption expenditure and general government final consumption expenditure.
Hence, capital formation is more volatile then and general government final consumption expenditure.
Especially after recession capital formation change at fast pace and there is no stability in its growth rate
and sometimes it is positive and negative (Gal, 2010). From 2008 it rise and decline at a very fast rate and
same trend is not observed in case of other variables like of final consumption expenditure and general
government final consumption expenditure. Hence, gross capital formation is one of the factor that is
more volatile then household final consumption expenditure and general government final consumption
expenditure.
In next diagram it can be observed that there are two variables namely export and import of goods
and services. It can be seen from the chart that export of the Malta is volatile then import. This is because
export of goods depends on rate of capital formation in the nation and stability in same. If there will not
be stability in same then there will be less production of goods and services in the economy. Hence, there
Paraphrase This Document
Need a fresh take? Get an instant paraphrase of this document with our AI Paraphraser
will be less export from nation side. In order to meet demand import increases in the Malta relative to
export.
(2) Factors of the Maltese economy that mostly affected during recession time period from 2008-
2010
During recession time period gross capital formation and export as well as import of goods and
services mostly affected. It can be observed that during this time period gross capital formation increased
and decreased at a very sharp rate. Hence, on this basis it can be said that gross capital formation fluctuate
frequently in the Maltese economy (Azzopardi, 2011). Another thing that can be observed from figures is
that rate of capital formation become very low after 2012 and this is not good for the nation economy. On
other hand, changes are also observed in the export and import of Malta. Its export is changing
consistently. It is not consistently increase or decrease on year on year basis. In some year it increase by
10% then in any specific year it decline by 7%. Hence, it can be said that value of exports is fluctuating
continuously and there is not stability in trends if compare export in different years on year on year basis.
If we look at import of Malta then it can be seen that changes in same comes in alignment to change in
export of the firm. Means that if in specific year export of the nation is declining then its import is also
reduced. Similarly, if export of the nation is increased then import of the nation is also increased. Hence,
on this basis it can be said that in alignment to change in export of goods government of Malta bring
changes in its import to maintain balance of payment account surplus. Hence, it can be said that these
were the factors that mostly affected in the Malta economy during recession time period.
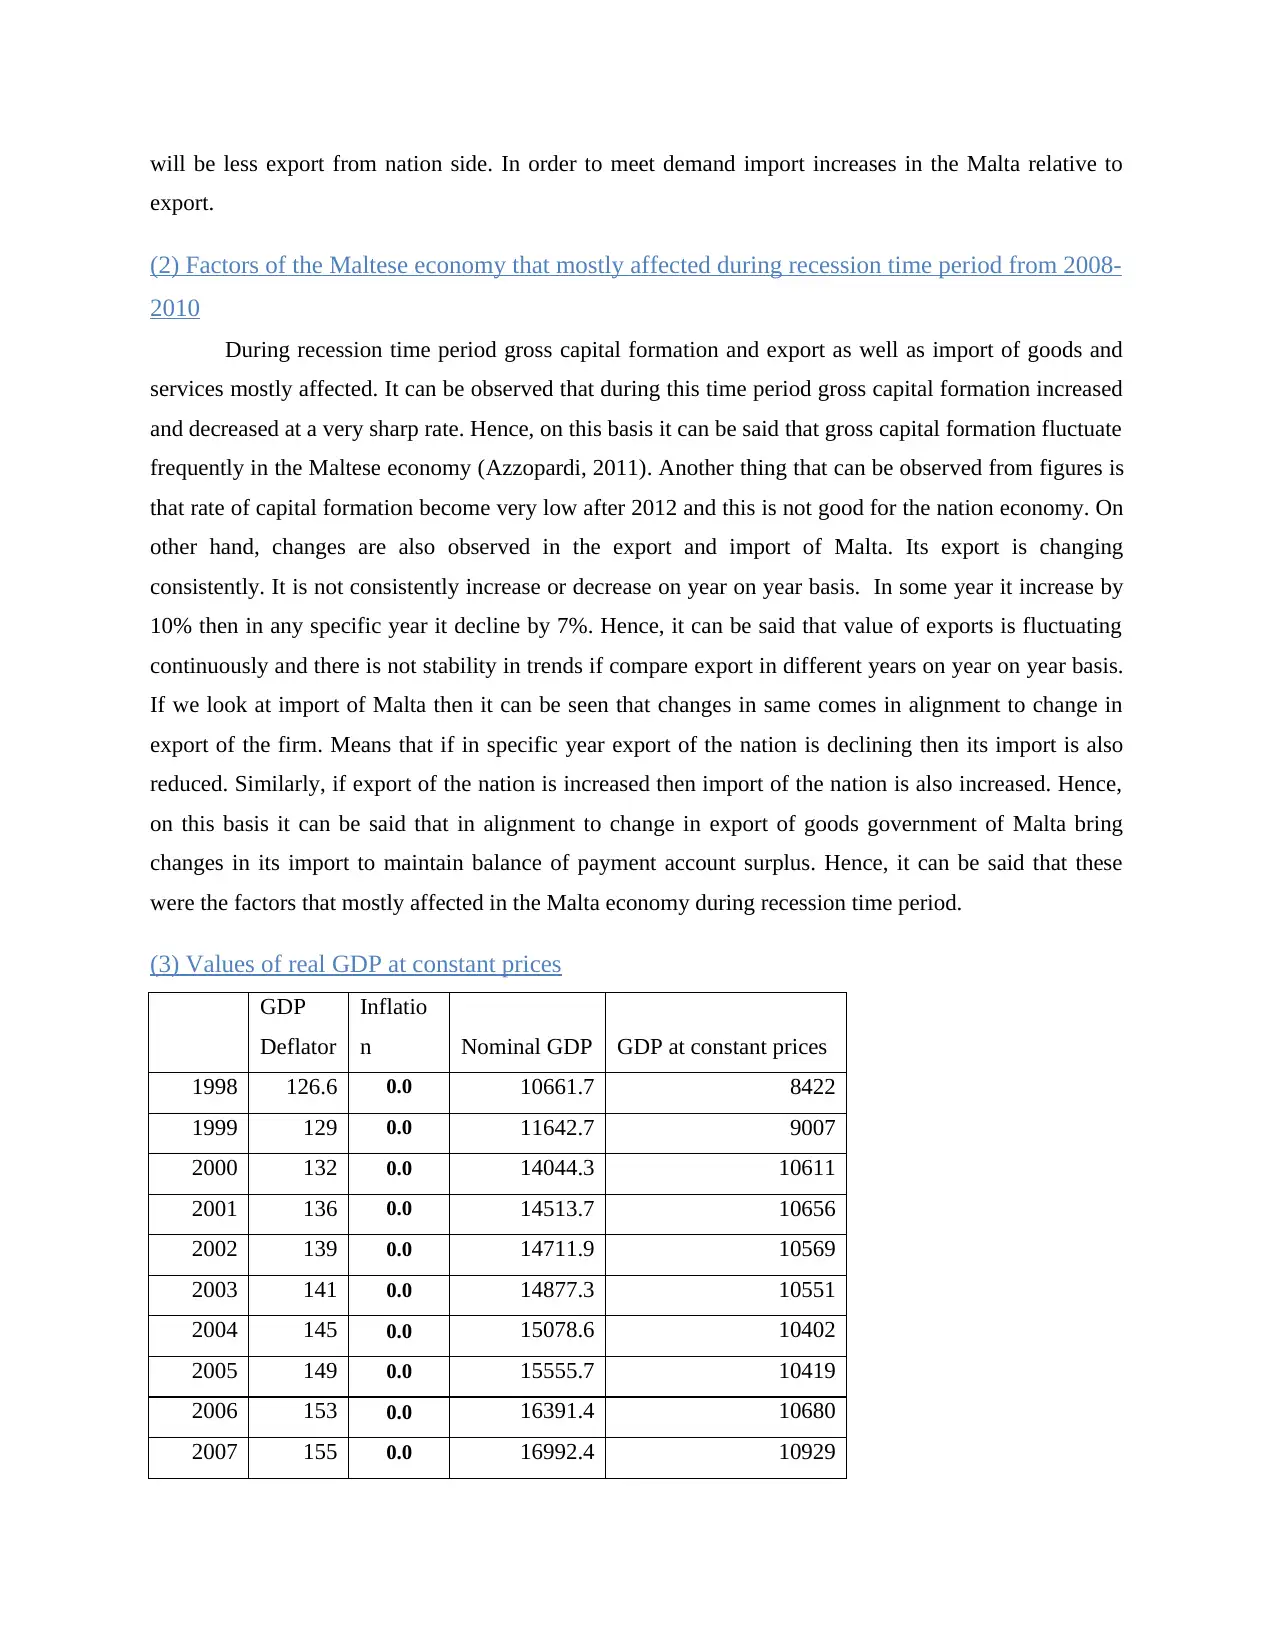
(3) Values of real GDP at constant prices
GDP
Deflator
Inflatio
n Nominal GDP GDP at constant prices
1998 126.6 0.0 10661.7 8422
1999 129 0.0 11642.7 9007
2000 132 0.0 14044.3 10611
2001 136 0.0 14513.7 10656
2002 139 0.0 14711.9 10569
2003 141 0.0 14877.3 10551
2004 145 0.0 15078.6 10402
2005 149 0.0 15555.7 10419
2006 153 0.0 16391.4 10680
2007 155 0.0 16992.4 10929
export.
(2) Factors of the Maltese economy that mostly affected during recession time period from 2008-
2010
During recession time period gross capital formation and export as well as import of goods and
services mostly affected. It can be observed that during this time period gross capital formation increased
and decreased at a very sharp rate. Hence, on this basis it can be said that gross capital formation fluctuate
frequently in the Maltese economy (Azzopardi, 2011). Another thing that can be observed from figures is
that rate of capital formation become very low after 2012 and this is not good for the nation economy. On
other hand, changes are also observed in the export and import of Malta. Its export is changing
consistently. It is not consistently increase or decrease on year on year basis. In some year it increase by
10% then in any specific year it decline by 7%. Hence, it can be said that value of exports is fluctuating
continuously and there is not stability in trends if compare export in different years on year on year basis.
If we look at import of Malta then it can be seen that changes in same comes in alignment to change in
export of the firm. Means that if in specific year export of the nation is declining then its import is also
reduced. Similarly, if export of the nation is increased then import of the nation is also increased. Hence,
on this basis it can be said that in alignment to change in export of goods government of Malta bring
changes in its import to maintain balance of payment account surplus. Hence, it can be said that these
were the factors that mostly affected in the Malta economy during recession time period.
(3) Values of real GDP at constant prices
GDP
Deflator
Inflatio
n Nominal GDP GDP at constant prices
1998 126.6 0.0 10661.7 8422
1999 129 0.0 11642.7 9007
2000 132 0.0 14044.3 10611
2001 136 0.0 14513.7 10656
2002 139 0.0 14711.9 10569
2003 141 0.0 14877.3 10551
2004 145 0.0 15078.6 10402
2005 149 0.0 15555.7 10419
2006 153 0.0 16391.4 10680
2007 155 0.0 16992.4 10929
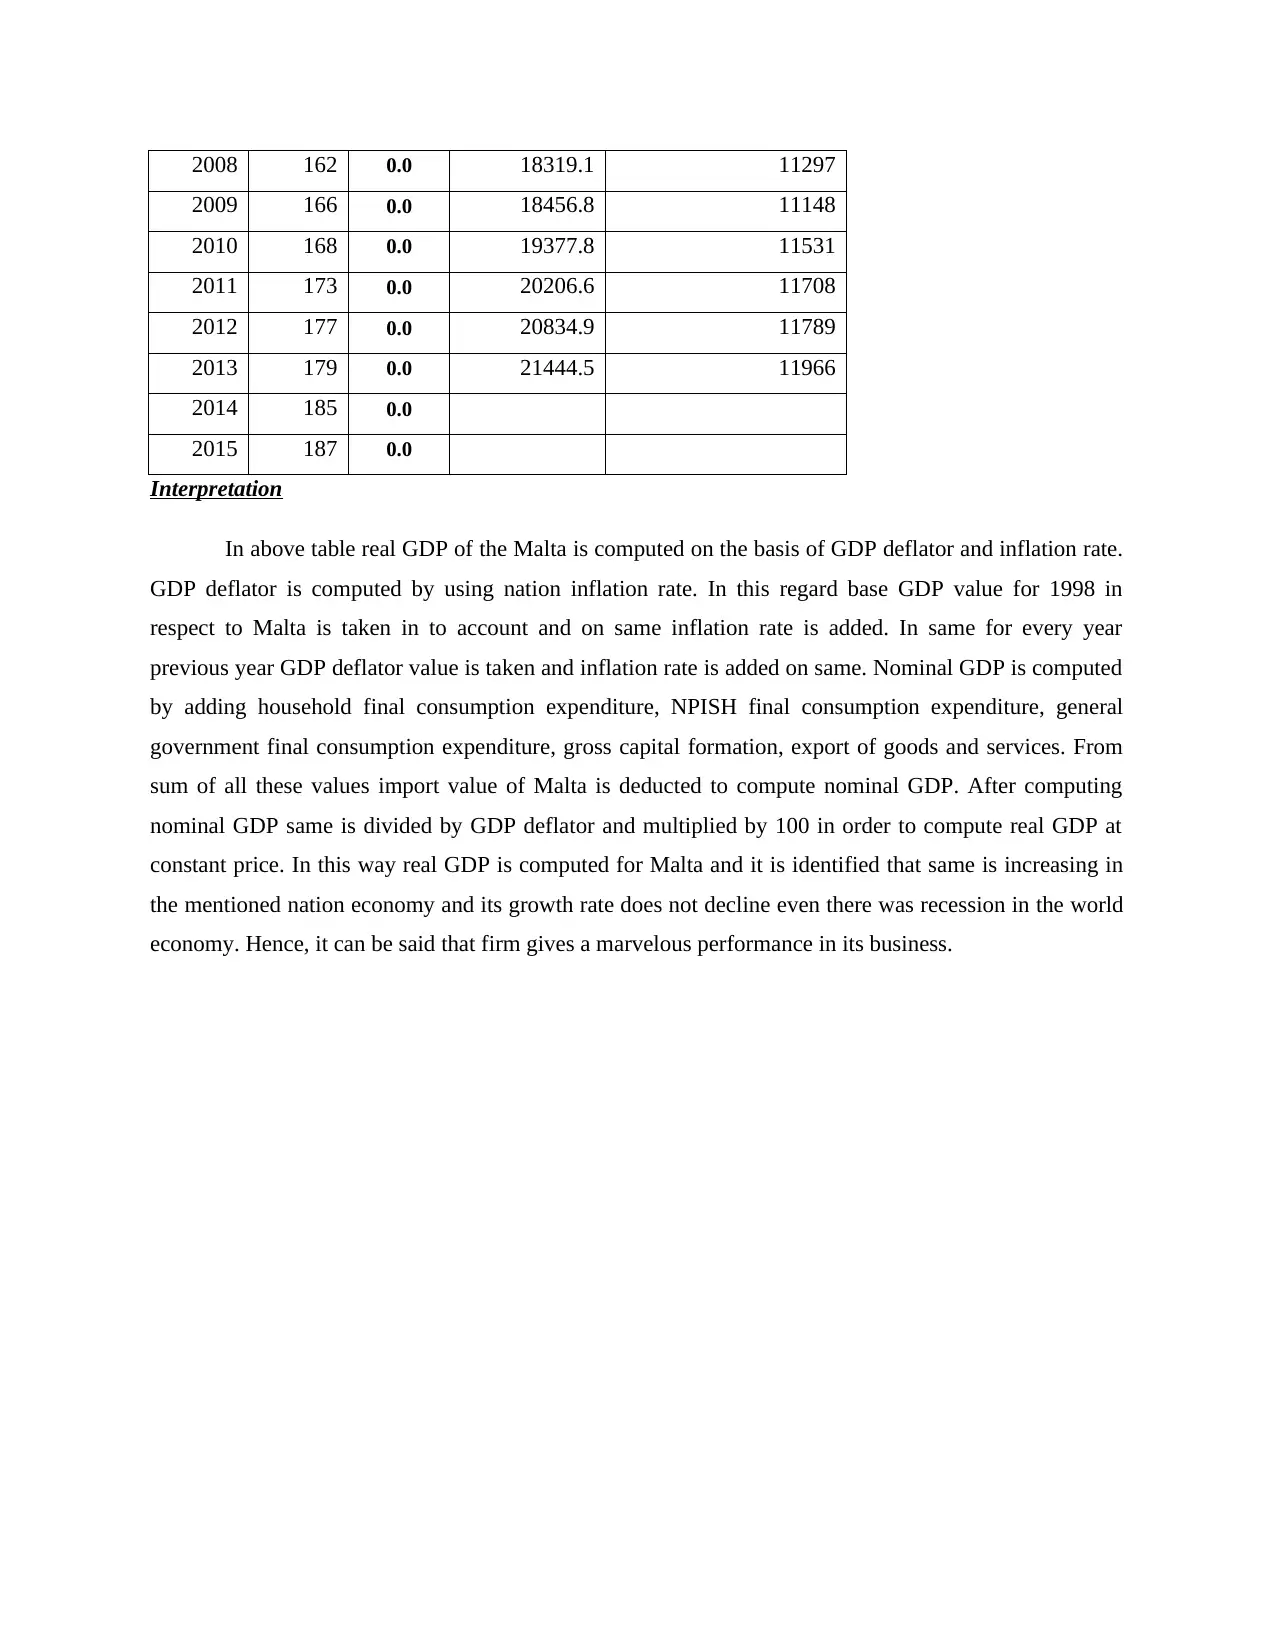
2008 162 0.0 18319.1 11297
2009 166 0.0 18456.8 11148
2010 168 0.0 19377.8 11531
2011 173 0.0 20206.6 11708
2012 177 0.0 20834.9 11789
2013 179 0.0 21444.5 11966
2014 185 0.0
2015 187 0.0
Interpretation
In above table real GDP of the Malta is computed on the basis of GDP deflator and inflation rate.
GDP deflator is computed by using nation inflation rate. In this regard base GDP value for 1998 in
respect to Malta is taken in to account and on same inflation rate is added. In same for every year
previous year GDP deflator value is taken and inflation rate is added on same. Nominal GDP is computed
by adding household final consumption expenditure, NPISH final consumption expenditure, general
government final consumption expenditure, gross capital formation, export of goods and services. From
sum of all these values import value of Malta is deducted to compute nominal GDP. After computing
nominal GDP same is divided by GDP deflator and multiplied by 100 in order to compute real GDP at
constant price. In this way real GDP is computed for Malta and it is identified that same is increasing in
the mentioned nation economy and its growth rate does not decline even there was recession in the world
economy. Hence, it can be said that firm gives a marvelous performance in its business.
⊘ This is a preview!⊘
Do you want full access?
Subscribe today to unlock all pages.
Trusted by 1+ million students worldwide
1 out of 17
Related Documents


Your All-in-One AI-Powered Toolkit for Academic Success.
+13062052269
info@desklib.com
Available 24*7 on WhatsApp / Email
![[object Object]](/_next/static/media/star-bottom.7253800d.svg)
Unlock your academic potential
Copyright © 2020–2026 A2Z Services. All Rights Reserved. Developed and managed by ZUCOL.