Semester 2, ANU FINM 8100: Applied Project in Finance Report
VerifiedAdded on 2022/10/19
|14
|2852
|14
Report
AI Summary
This report provides a comprehensive analysis of an applied finance project, focusing on the prediction of portfolio returns and the methodologies employed. The literature review explores the significance of forecasting returns, the use of multi-beta asset pricing models, and the Capital Asset Pricing Model (CAPM). The report emphasizes the importance of data and sample selection, discussing the sources of predictability in portfolio returns and the limitations of forecasting models. The analysis includes data from 1964 to 1986, demonstrating the variations in predicted returns across different industry groups. The report highlights the impact of assumptions and market conditions on return predictions. The report also delves into the formula for predictable changes and data limitations, providing insights into the challenges and complexities of financial forecasting. The project examines the contributions of the paper, results, and conclusions to provide a complete overview of the subject.

Running head: APPLIED PROJECT OF FINANCE
Applied Project of Finance
Name of the Student:
Name of the University:
Authors Note:
Applied Project of Finance
Name of the Student:
Name of the University:
Authors Note:
Paraphrase This Document
Need a fresh take? Get an instant paraphrase of this document with our AI Paraphraser
1
APPLIED PROJECT OF FINANCE
Contents
Literature review:.............................................................................................................................2
Data and sample selection:..............................................................................................................6
Overall evaluation of the report:....................................................................................................11
References:....................................................................................................................................12
2
APPLIED PROJECT OF FINANCE
Literature review:
Predicting returns on portfolio is one of the most critical and important aspects in financial
management and portfolio selection. The returns are forecasted on the basis of best available data
and information to select best investment options to maximize the return from a portfolio. The
investors have mainly two objectives these are to achieve maximum returns on the overall
portfolio and to minimize the risk in the overall portfolio. Since, it is not possible to exactly
calculate the returns to be earned on a given portfolio the investors are dependent on the
investment experts’ services to determine the investment portfolio (Almahdi and Yang, 2017).
The investment experts calculate the expected rate of return on a given portfolio along with
expected risk associated with the portfolio to enable the investors to take the final call on the
proportion of investment in different funds in the portfolios of investors.
Sources of predictability in portfolio return discusses the sources that are to be used in predicting
the expected returns in the portfolio of an investor. Now why predicting when all the data and
information about the portfolio is available in front of us. The reason that an investors or an
expert providing investment services can only predict the return on investment portfolio is
because the market is vulnerable and the data used to predict the expected rate of return on
portfolio is the best data available (Berry, 2018). The future condition in the market may well be
same as the data available in the past on the basis of which portfolio returns were calculated
however, it is also a possibility that the future market conditions may change completely and
result in different returns and risk from the portfolios. Thus, it is only possible to predict the
expected rate of return on the basis of best possible data and information available about the
market however, it is not guaranteed that such market conditions will be present in the future
thus, the actual rate of return and risks in investment portfolios could be completely different or
⊘ This is a preview!⊘
Do you want full access?
Subscribe today to unlock all pages.
Trusted by 1+ million students worldwide
3
APPLIED PROJECT OF FINANCE
slightly different or not at all different from the ones predicted earlier. However, since, the
investors are expected to take decisions regarding the proportion of different funds or investment
options in the portfolios they have to rely on the forecast services of the investment experts
(Bornholt, 2016).
The article of sources of predictability in portfolio returns discusses the various underlying
factors and methods used in determination of returns expected to be earned by the investors on
different portfolio. A-multi beta asset pricing model is one of the most popular methods used by
the investors and the experts to forecast the expected rate of return on investments. The
underlying variables used in determination of returns on a portfolio using a multi beta asset
pricing model includes risk factors related to the stock market, inflation which is not expected,
expenditures incurred by consumers, and rate of interests in the market. However, the underlying
variables are constantly changes with slightest of changes in the market position thus, forecasting
and predicting expected rate of return on different investment portfolios are only meant to serve
the investors with possible return and risk interplay on investments (Chen and Anderson, 2018).
Thus, it is important to note that the returns on investment can only be predicted however, since
the prediction is dependent on number of underlying variables which are subjected to
fluctuations with slightest of changes in the market condition thus, it would be impossible predict
the returns from different investment portfolios with cent percent guarantee. This is mainly due
to the ever changing market condition. Thus, the investors would be better served and benefitted
from the investment expert analysis of impact on expected rate of return in case the market
condition changes for better, worse or remain the same. Thus, providing scenario analysis by
using best case, worst case and normal scenario would help investors to make their minds on the
Paraphrase This Document
Need a fresh take? Get an instant paraphrase of this document with our AI Paraphraser
4
APPLIED PROJECT OF FINANCE
selection of different assets in investment portfolio along with proportion of total investment of
these assets to finalize the investment portfolio.
In a multi-beta asset pricing model the little variation is explained by the market efficiency and
helps the investors in finalizing the investment portfolio assets to complete the portfolio. The
discussion in the article on how both betas and risk premiums changes can be predicted overtime
with the importance of changes in risk premium exceeding that of changes in betas explained
effectively (Davidsson, 2018). The fact that investors are expected to make necessary
amendments to update their assessment of expected returns from investment portfolio is maybe
expecting way too much from ordinary investors if they have already hired the services of
investment experts for portfolio management. It is important to note that not all investors are
expected to have advanced knowledge and understanding of market conditions and can make
necessary changes in the underlying variables to update their assessments of expected return
thus, it is important to assess the impact of market vulnerabilities and provide detailed
information on the expected rate of returns and how these can changes over a period of time to
allow the investors to take important decisions (Ostaszewski, 2017).
The fact that to a large extent the expected rate of return on bond and stock can be predicted is
already known and well documented over the years on number of different literature on finance
and investment. The discussion however, is more about the controversial sources used to predict
the returns on bond and stock than the method used to predict the returns on stock and bond.
Required rates or returns were assumed to be constant in the models used in 1960s and 1970s to
predict the returns on bond and stock. Thus, the fundamental market conditions and underlying
factors used in predicting returns on stock and bond was not correct during the 1960s and 1970s.
The shift in the focus came in 1980s by exposing the economic variation to determine the
5
APPLIED PROJECT OF FINANCE
changes in expected rate of return over a time period. Thus, allowing the required rate of return
to experience the changes in market condition allowed the investors’ broader range of
information as the investors understood the expected impact of changes in market condition on
the expected rate of return on investment portfolio. However, despite allowing required rate of
returns for exposure to economic risk to vary over time in the 1980s the controversy surrounding
the predictability of returns continued without showing any sign of stopping. Thus, evaluation of
methods to be used to calculate the expected rate of returns continued. The experts have varied
opinion on the market rate of return as some attributed the concept of predictability as prone to
changes with market inefficiencies whereas others defined it as rational updating of required rate
of returns on the basis of investors assessment of different market conditions (Zdorovenin and
Pezier, 2017).
Methodology used in predictable changes as per the analysis of investment experts have been
illustrated using the following formula;
The use of multiple beta, APT type models are supported by extensive research on predictability
of returns. The contemporary practice is represented in the above formula and in using the beta
and APT models. A representative model uses return on data, expected cost of equity, risk free
rate of return and market premium to calculate the expected rate of return on investment
portfolios. Predicting returns using capital asset pricing model (CAPM) further states the
importance of risk free rate of return, market premium for risk undertaken and beta factors to
⊘ This is a preview!⊘
Do you want full access?
Subscribe today to unlock all pages.
Trusted by 1+ million students worldwide
6
APPLIED PROJECT OF FINANCE
determine the expected rate of return. However, the difference between the market rate of return
and expected rate of return also need to be understood here (Zhang, 2017).
Data and sample selection:
The data and sample selection covers the range of data selected in predicting the expected rate of
return on different stock and bonds. The researchers has used a gamut of data from different
sources to expand the depth of the research. Considering the importance of the research it was
essential to select appropriate data to ensure that the research is effective useful for the readers.
Earlier it was said that returns on assets are unpredictable however, research such as this have
proven that to a large extent research can be predicted provided the data used are authentic and
correct. In this research the importance of data selection to the final outcome in predicting
expected return has been explained with the help of different data.
In order to explain the concept of predictability of returns and sources of predictability the
research has gathered monthly portfolio return from 1964 to 1986 on different industries. The
selection of this data has been specifically made to discuss the probability of capital asset pricing
model, beta pricing model and other such models to correctly assess the expected rate of returns
on different assets and portfolios by using available information. Nowhere the research has
claimed that the predicted returns would be cent percent correct however, the possibility of
correctly predicting the rate of returns on different portfolios and assets is quite bright by
selecting correct data and using proper methods.
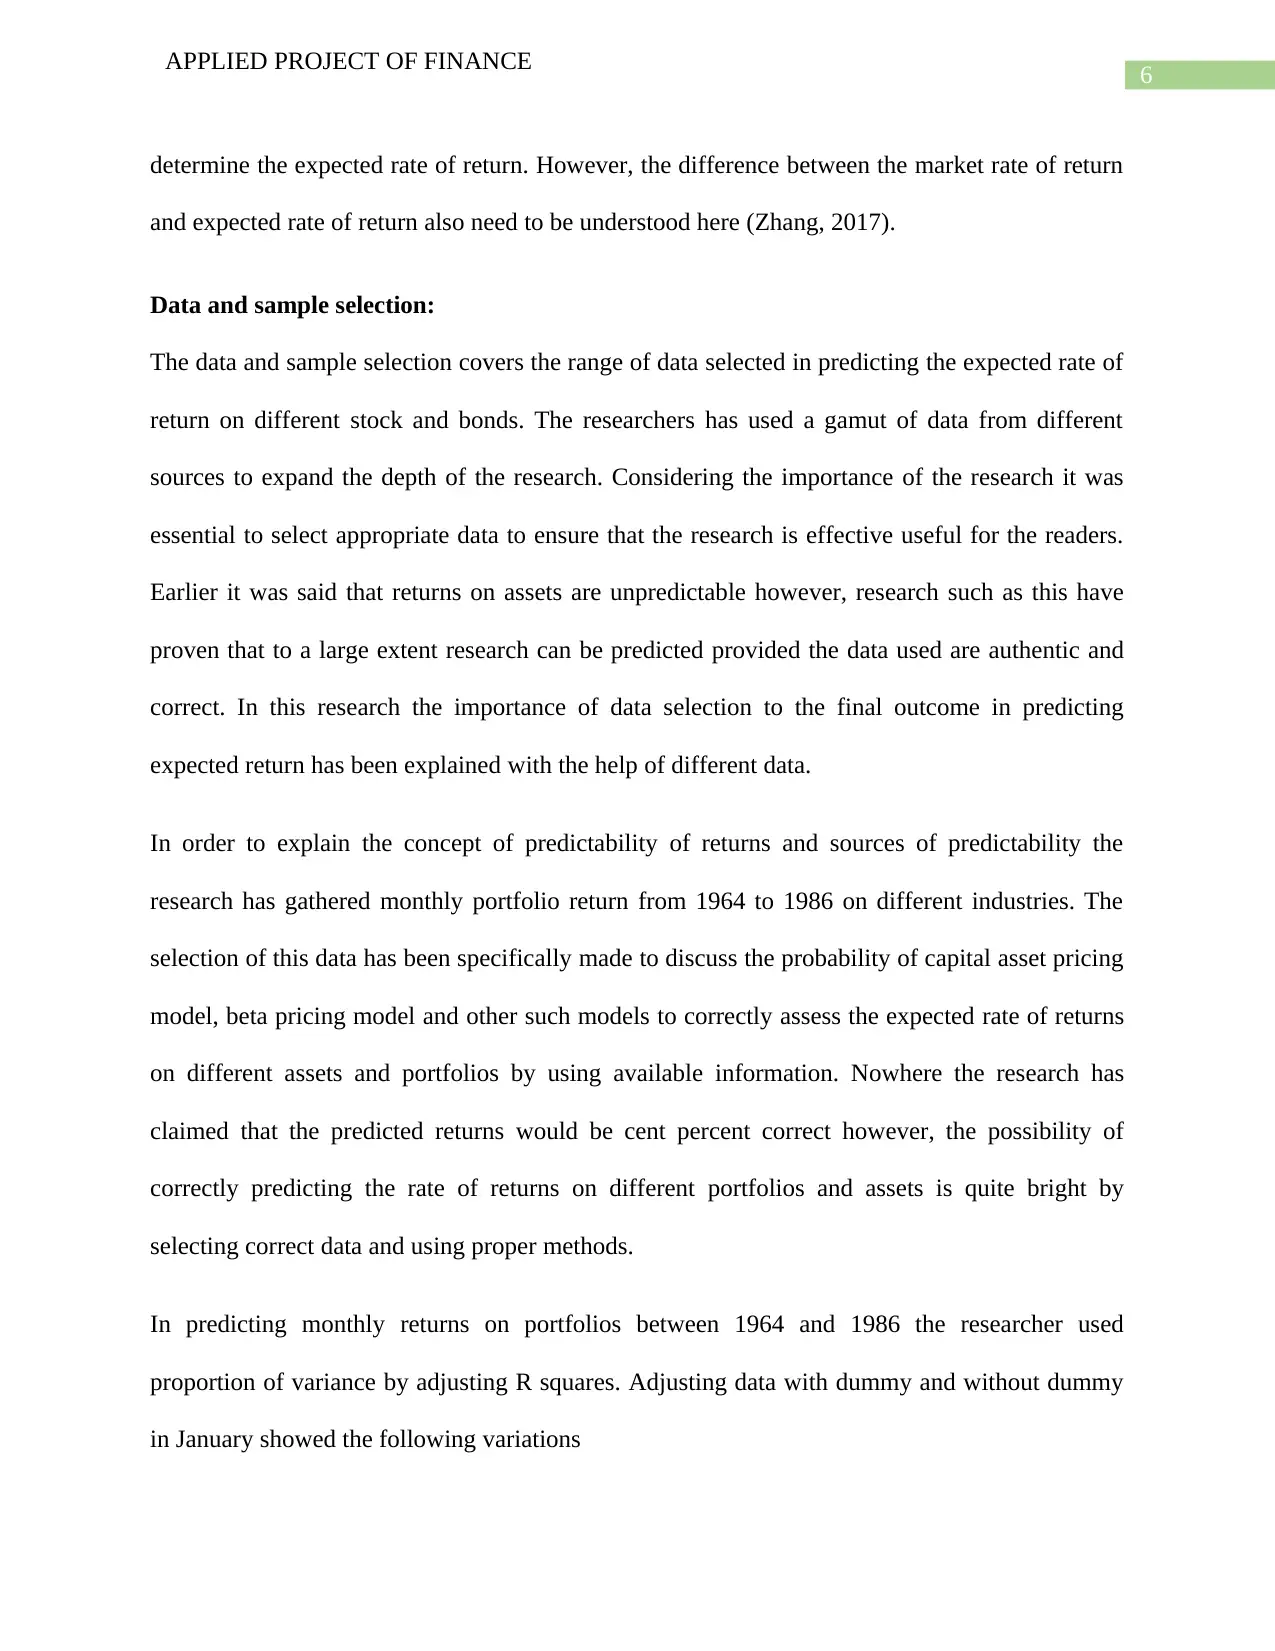
In predicting monthly returns on portfolios between 1964 and 1986 the researcher used
proportion of variance by adjusting R squares. Adjusting data with dummy and without dummy
in January showed the following variations
APPLIED PROJECT OF FINANCE
determine the expected rate of return. However, the difference between the market rate of return
and expected rate of return also need to be understood here (Zhang, 2017).
Data and sample selection:
The data and sample selection covers the range of data selected in predicting the expected rate of
return on different stock and bonds. The researchers has used a gamut of data from different
sources to expand the depth of the research. Considering the importance of the research it was
essential to select appropriate data to ensure that the research is effective useful for the readers.
Earlier it was said that returns on assets are unpredictable however, research such as this have
proven that to a large extent research can be predicted provided the data used are authentic and
correct. In this research the importance of data selection to the final outcome in predicting
expected return has been explained with the help of different data.
In order to explain the concept of predictability of returns and sources of predictability the
research has gathered monthly portfolio return from 1964 to 1986 on different industries. The
selection of this data has been specifically made to discuss the probability of capital asset pricing
model, beta pricing model and other such models to correctly assess the expected rate of returns
on different assets and portfolios by using available information. Nowhere the research has
claimed that the predicted returns would be cent percent correct however, the possibility of
correctly predicting the rate of returns on different portfolios and assets is quite bright by
selecting correct data and using proper methods.
In predicting monthly returns on portfolios between 1964 and 1986 the researcher used
proportion of variance by adjusting R squares. Adjusting data with dummy and without dummy
in January showed the following variations
Paraphrase This Document
Need a fresh take? Get an instant paraphrase of this document with our AI Paraphraser
7
APPLIED PROJECT OF FINANCE
Portfolio industry groups Variance predicted using R
squares
With January Dummy. Without January Dummy.
Petroleum 0.058 0.059
Finance/ Real-estate 0.086 0.089
Durables (Consumers) 0.130 .0129
Industries (Basic) 0.093 0.094
Food/ tobacco 0.091 0.093
Construction 0.137 0.132
Capital goods 0.113 0.114
Transportation 0.104 0.096
Utilities 0.098 0.092
Textiles 0.095 0.094
Services 0.110 0.107
Leisure 0.102 0.103
The variables predicted above by using dummy as well as without dummy shows that if the data
is properly used and correct methods are used then the possibility of predicting expected returns
8
APPLIED PROJECT OF FINANCE
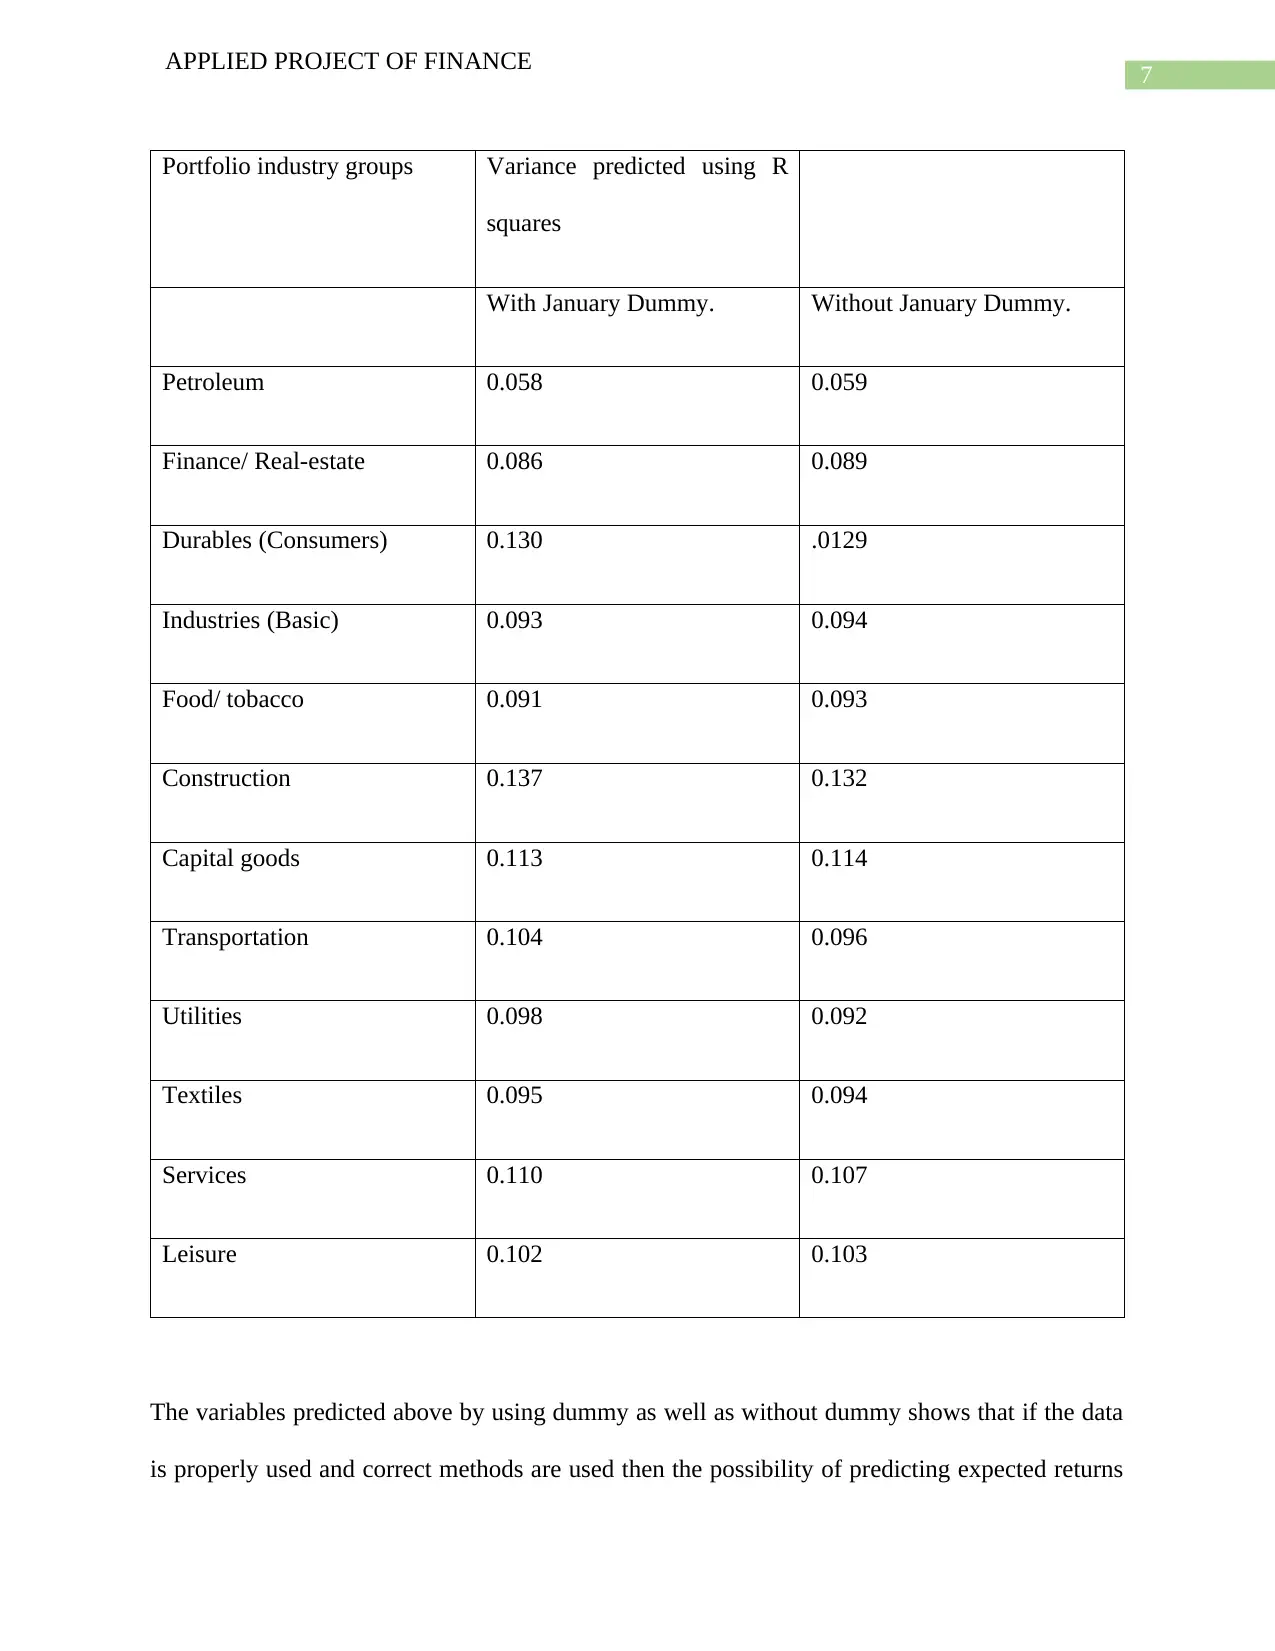
and variables correctly is extremely high. The above variations with and without dummy for
different portfolios are shown with the help of a diagram (Vercher, 2018).
The use of regression model in predicting required rate of returns and utility of the model to
assess variances have been discussed in the research by the author to enlighten the readers about
the usefulness of different elements to correctly predict the expected rate of returns of different
portfolios with different proportion of assets.
Data limitations:
There is always some limitations in forecasting models due to the practical reason of assumption.
The fact that the whole purpose of the research is to predict the future which is almost impossible
ensures that one starts as a handicap. In this case the data limitations include non-availability of
certain data, difficulty in gathering important data in relation to the beta and cost of different
stocks. Along with that there are number of assumptions that have to be made in calculation of
expected rate of returns hence, the expected rate of returns calculated on different portfolios and
assets are definitely affected with the assumptions. Hence, the impact of personal judgment and
APPLIED PROJECT OF FINANCE
and variables correctly is extremely high. The above variations with and without dummy for
different portfolios are shown with the help of a diagram (Vercher, 2018).
The use of regression model in predicting required rate of returns and utility of the model to
assess variances have been discussed in the research by the author to enlighten the readers about
the usefulness of different elements to correctly predict the expected rate of returns of different
portfolios with different proportion of assets.
Data limitations:
There is always some limitations in forecasting models due to the practical reason of assumption.
The fact that the whole purpose of the research is to predict the future which is almost impossible
ensures that one starts as a handicap. In this case the data limitations include non-availability of
certain data, difficulty in gathering important data in relation to the beta and cost of different
stocks. Along with that there are number of assumptions that have to be made in calculation of
expected rate of returns hence, the expected rate of returns calculated on different portfolios and
assets are definitely affected with the assumptions. Hence, the impact of personal judgment and
⊘ This is a preview!⊘
Do you want full access?
Subscribe today to unlock all pages.
Trusted by 1+ million students worldwide

9
APPLIED PROJECT OF FINANCE
biased certainly contribute to the overall limitation of different models used to calculate rate of
return expected to be earned on portfolios and assets (Markovich & Plazzi, 2017).
As per the research predictability is captured by using the following formula;
Hardcoded data on US 30 day Treasury bill rates over the duration between 1926 and 2019 have
been used along with other data for the purpose of evaluating the usefulness and benefit of the
models used in predicting return on assets and portfolios combining different assets. The table
below shows the different data and information used to carry out data analysis to evaluate the
expected benefit of different models and how these models are useful in calculating expected rate
of returns on assets (Kebabci, 2018).
Name Firm Name Branding Name Base
Currenc
y
Code
IA SBBI US 30 Day TBill Infl
Adj TR USD
Ibbotson
Associates
Ibbotson
Associates
US
Dollar
FOUSA05XU
3
APPLIED PROJECT OF FINANCE
biased certainly contribute to the overall limitation of different models used to calculate rate of
return expected to be earned on portfolios and assets (Markovich & Plazzi, 2017).
As per the research predictability is captured by using the following formula;
Hardcoded data on US 30 day Treasury bill rates over the duration between 1926 and 2019 have
been used along with other data for the purpose of evaluating the usefulness and benefit of the
models used in predicting return on assets and portfolios combining different assets. The table
below shows the different data and information used to carry out data analysis to evaluate the
expected benefit of different models and how these models are useful in calculating expected rate
of returns on assets (Kebabci, 2018).
Name Firm Name Branding Name Base
Currenc
y
Code
IA SBBI US 30 Day TBill Infl
Adj TR USD
Ibbotson
Associates
Ibbotson
Associates
US
Dollar
FOUSA05XU
3
Paraphrase This Document
Need a fresh take? Get an instant paraphrase of this document with our AI Paraphraser

10
APPLIED PROJECT OF FINANCE
IA SBBI US 30 Day TBill TR
USD
Ibbotson
Associates
Ibbotson
Associates
US
Dollar
FOUSA05XT
S
IA SBBI US Bond Default
Premium
Ibbotson
Associates
Ibbotson
Associates
US
Dollar
FOUSA05XT
W
IA SBBI US LT Corp Infl Adj
TR USD
Ibbotson
Associates
Ibbotson
Associates
US
Dollar
FOUSA05XU
0
IA SBBI US LT Corp TR
USD
Ibbotson
Associates
Ibbotson
Associates
US
Dollar
FOUSA05XQ
3
IA SBBI US LT Govt Infl Adj
TR USD
Ibbotson
Associates
Ibbotson
Associates
US
Dollar
FOUSA05XU
1
IA SBBI US LT Govt TR
USD
Ibbotson
Associates
Ibbotson
Associates
US
Dollar
FOUSA05XQ
4
IA Barclays US HY Corporate
Bonds
Barclays
Capital Indices
Barclays US
Dollar
Overall it can be safely said that though there are number of weaknesses in the process of data
selection however, the utility of the model in predicting the future returns on assets and
portfolios are extremely beneficial for the investors in the future provided the investors make
proper use of these models to correctly estimate the expected rate of return. Thus, the better
selection of data would improve the effectiveness of the model in estimating the returns on

11
APPLIED PROJECT OF FINANCE
different assets and portfolios to take important investment related decision (Ke, Kelly & Xiu,
2019).
Overall evaluation of the report:
The report clearly identifies the number of different aspects and elements that are directly related
to the returns on investment portfolios. The investors as well as the experts providing investment
analysis must consider each and every single factor to follow the correct method to predict the
expected rate of return on different investment portfolios containing different funds and assets in
different proportion as per the wish and desire of investors.
⊘ This is a preview!⊘
Do you want full access?
Subscribe today to unlock all pages.
Trusted by 1+ million students worldwide
1 out of 14
Related Documents


Your All-in-One AI-Powered Toolkit for Academic Success.
+13062052269
info@desklib.com
Available 24*7 on WhatsApp / Email
![[object Object]](/_next/static/media/star-bottom.7253800d.svg)
Unlock your academic potential
Copyright © 2020–2026 A2Z Services. All Rights Reserved. Developed and managed by ZUCOL.