BCO127 Applied Management Statistics Assignment: Food Oils and Health

Verified

Added on  2022/08/12

|5
|546
|11
Homework Assignment
AI Summary
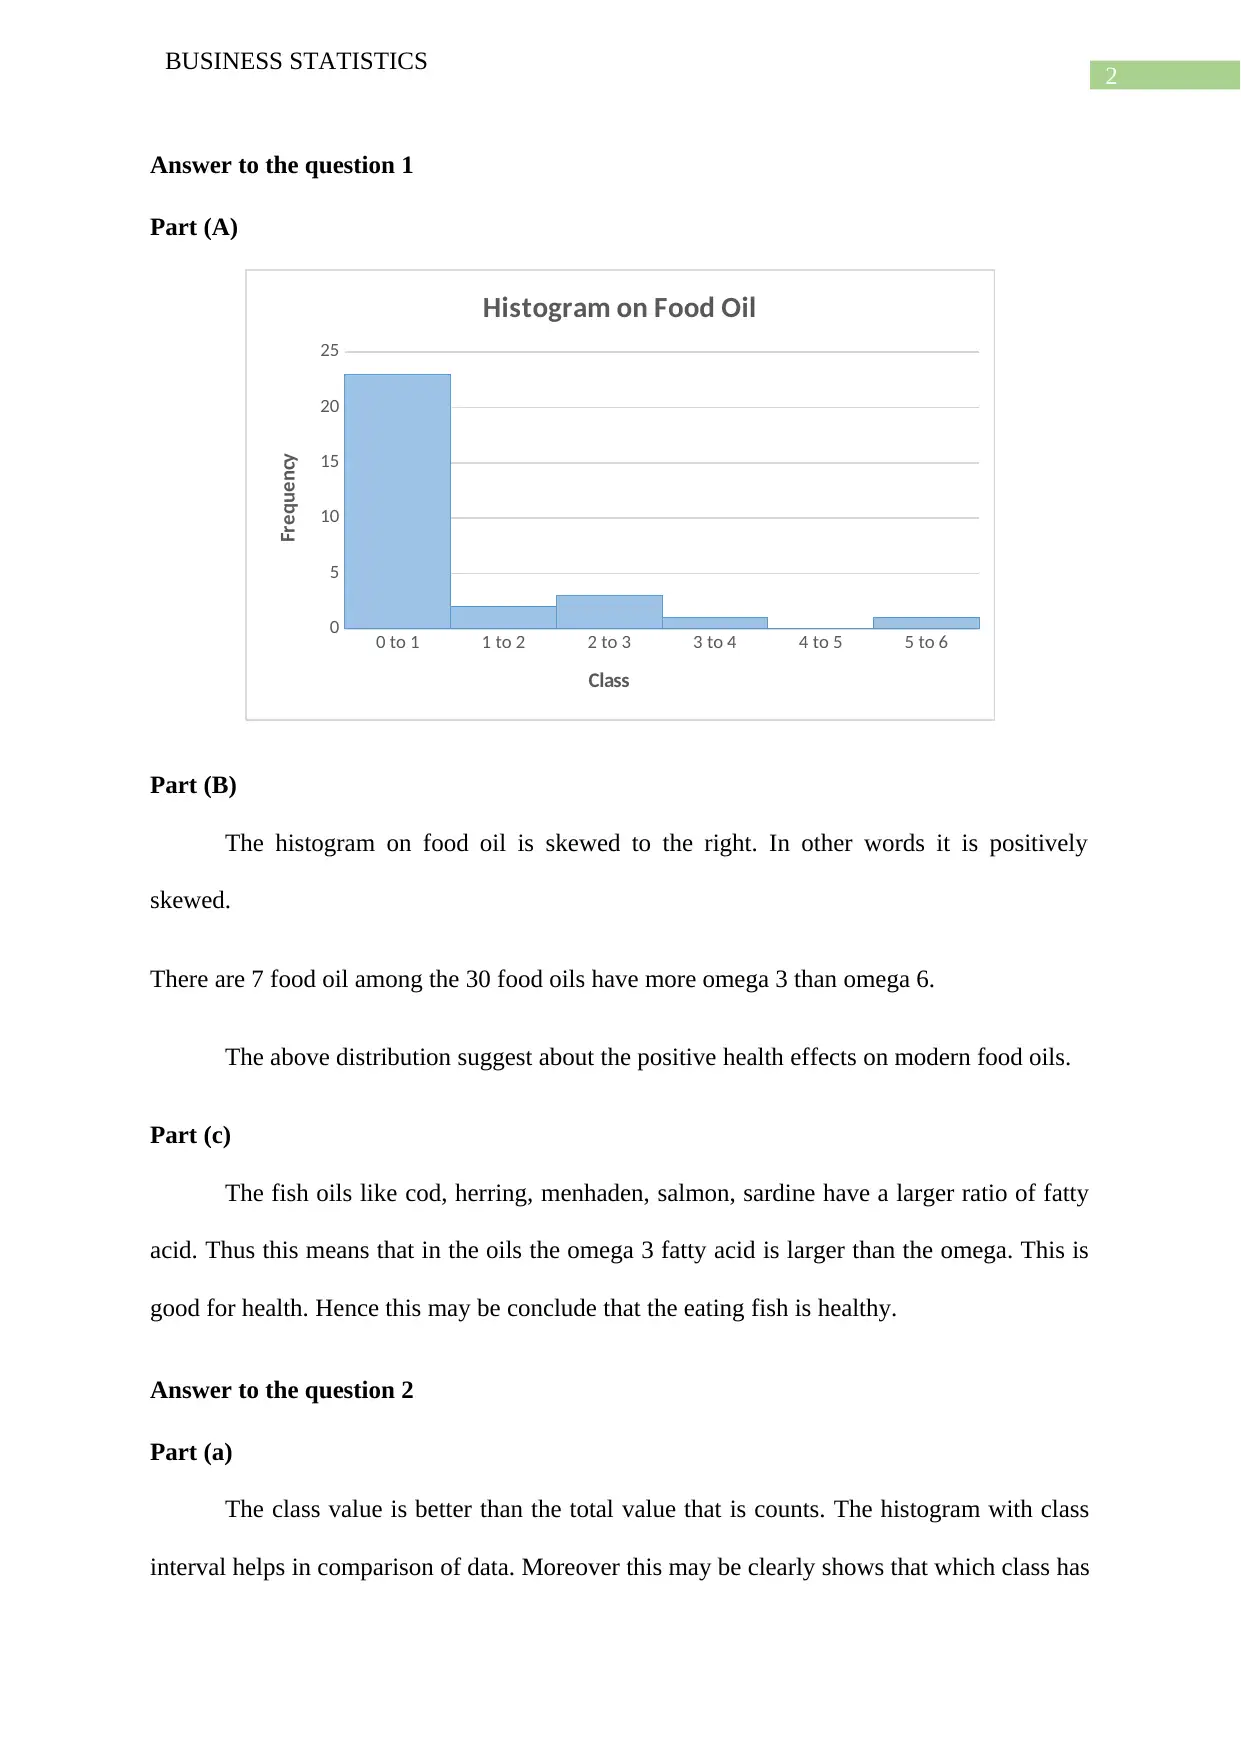
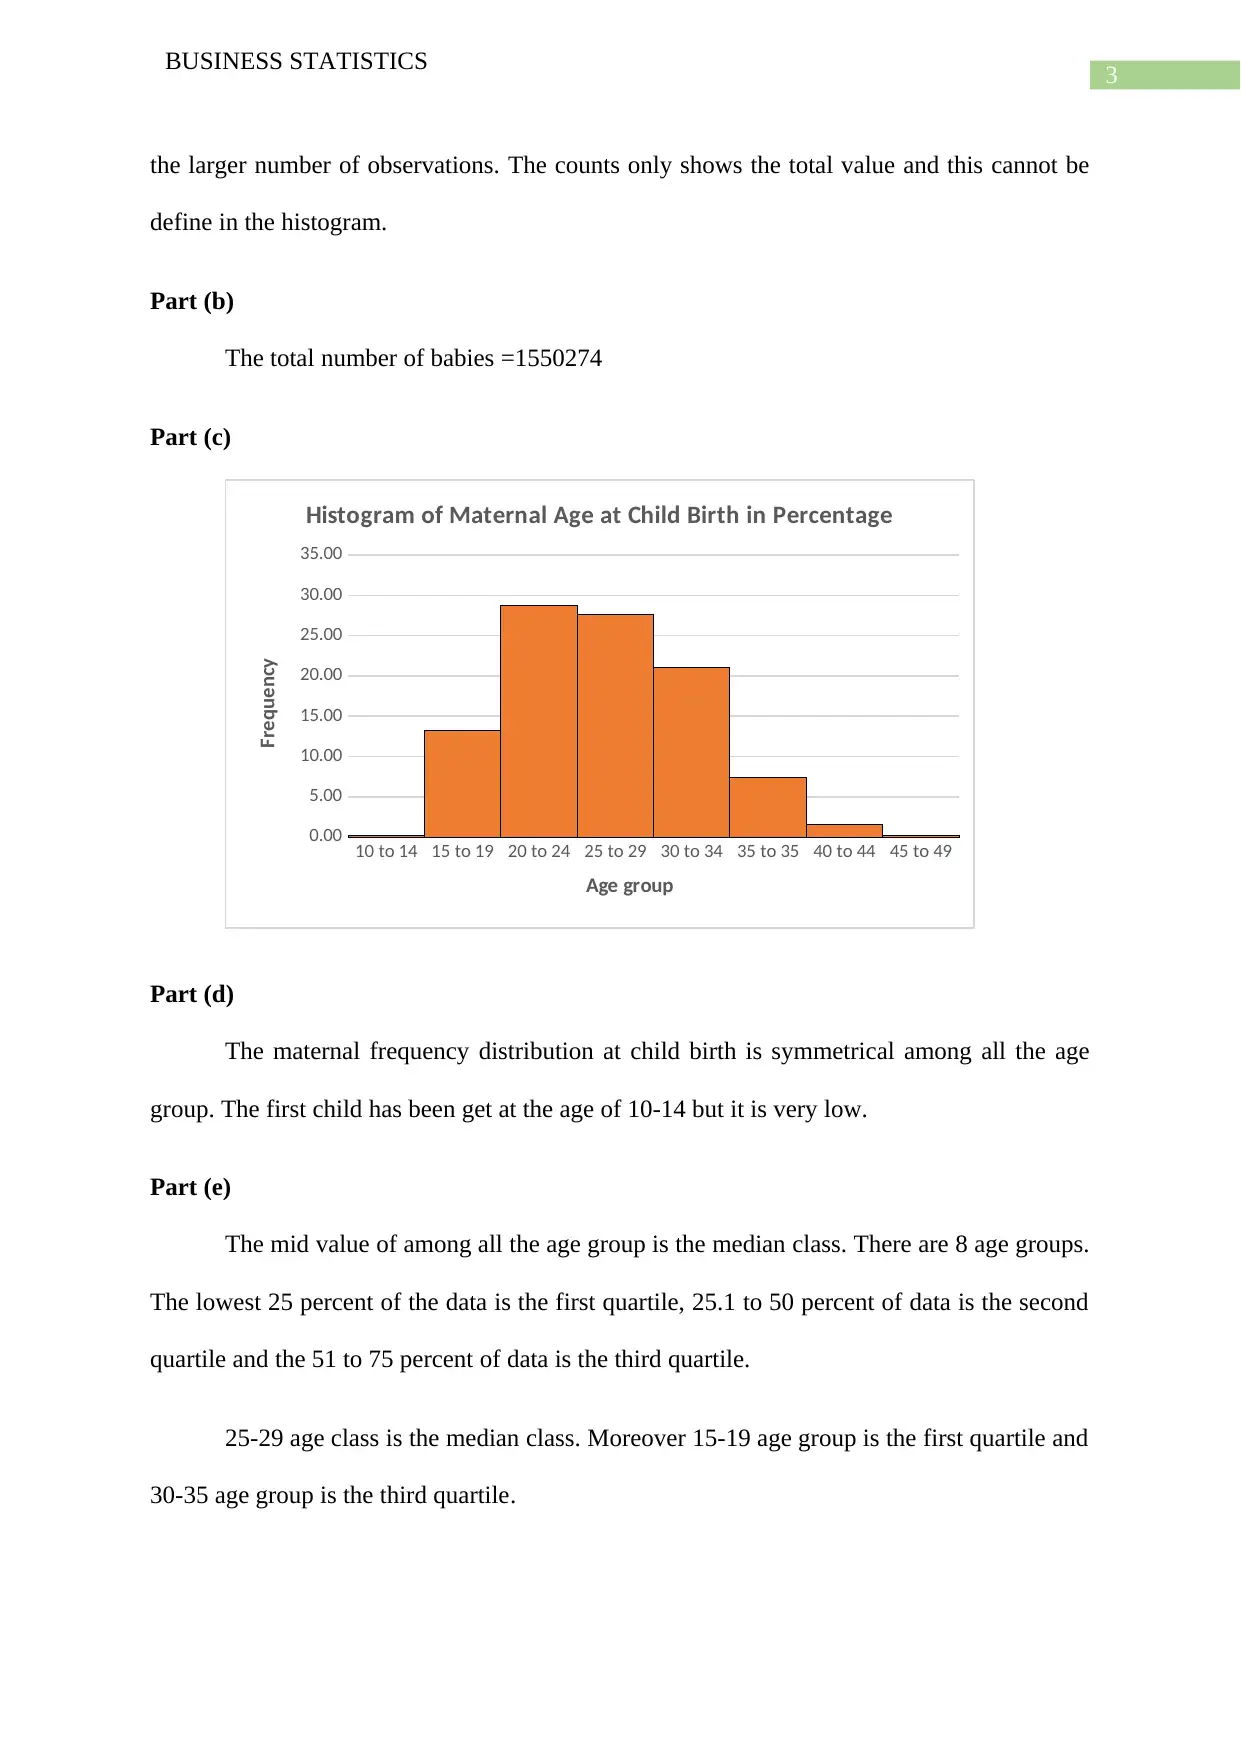
This assignment solution addresses a business statistics problem focused on analyzing food oils and their impact on health. The student, acting as a hospital catering service manager, investigates the ratio of omega-3 to omega-6 fatty acids in various food oils. The solution includes an analysis of a histogram showing the distribution of omega-3 to omega-6 ratios, concluding that oils with a higher omega-3 to omega-6 ratio are beneficial for health. The student also examines birth statistics, comparing class values and total counts, and analyzing maternal frequency distribution across different age groups, including the identification of median and quartile age classes. The assignment utilizes descriptive statistics and data interpretation to draw conclusions about the health implications of different food oils and demographic data.
Document Page
Running head: BUSINESS STATISTICS
Business Statistics
Name of the Student:
Name of the University:
Author note:
tabler-icon-diamond-filled.svg

Paraphrase This Document

Need a fresh take? Get an instant paraphrase of this document with our AI Paraphraser
Document Page
1
BUSINESS STATISTICS
Table of Contents
Answer to the question 1............................................................................................................2
Part (A)...................................................................................................................................2
Part (B)...................................................................................................................................3
Part (c)....................................................................................................................................3
Answer to the question 2............................................................................................................3
Part (a)....................................................................................................................................3
Part (b)....................................................................................................................................3
Part (c)....................................................................................................................................4
Part (d)....................................................................................................................................4
Part (e)....................................................................................................................................4
Bibliography...............................................................................................................................4
Document Page
2
BUSINESS STATISTICS
Answer to the question 1
Part (A)
0 to 1 1 to 2 2 to 3 3 to 4 4 to 5 5 to 6
0
5
10
15
20
25
Histogram on Food Oil
Class
Frequency
Part (B)
The histogram on food oil is skewed to the right. In other words it is positively
skewed.
There are 7 food oil among the 30 food oils have more omega 3 than omega 6.
The above distribution suggest about the positive health effects on modern food oils.
Part (c)
The fish oils like cod, herring, menhaden, salmon, sardine have a larger ratio of fatty
acid. Thus this means that in the oils the omega 3 fatty acid is larger than the omega. This is
good for health. Hence this may be conclude that the eating fish is healthy.
Answer to the question 2
Part (a)
The class value is better than the total value that is counts. The histogram with class
interval helps in comparison of data. Moreover this may be clearly shows that which class has
Document Page
3
BUSINESS STATISTICS
the larger number of observations. The counts only shows the total value and this cannot be
define in the histogram.
Part (b)
The total number of babies =1550274
Part (c)
10 to 14 15 to 19 20 to 24 25 to 29 30 to 34 35 to 35 40 to 44 45 to 49
0.00
5.00
10.00
15.00
20.00
25.00
30.00
35.00
Histogram of Maternal Age at Child Birth in Percentage
Age group
Frequency
Part (d)
The maternal frequency distribution at child birth is symmetrical among all the age
group. The first child has been get at the age of 10-14 but it is very low.
Part (e)
The mid value of among all the age group is the median class. There are 8 age groups.
The lowest 25 percent of the data is the first quartile, 25.1 to 50 percent of data is the second
quartile and the 51 to 75 percent of data is the third quartile.
25-29 age class is the median class. Moreover 15-19 age group is the first quartile and
30-35 age group is the third quartile.
tabler-icon-diamond-filled.svg

Paraphrase This Document

Need a fresh take? Get an instant paraphrase of this document with our AI Paraphraser
Document Page
4
BUSINESS STATISTICS
Bibliography
Donati, O.F., Mazaheri, Y., Afaq, A., Vargas, H.A., Zheng, J., Moskowitz, C.S., Hricak, H.
and Akin, O., 2014. Prostate cancer aggressiveness: assessment with whole-lesion histogram
analysis of the apparent diffusion coefficient. Radiology, 271(1), pp.143-152.
George, D. and Mallery, P., 2016. Descriptive statistics. In IBM SPSS Statistics 23 Step by
Step (pp. 126-134). Routledge.
Holcomb, Z.C., 2016. Fundamentals of descriptive statistics. Routledge.
Rosta, E. and Hummer, G., 2015. Free energies from dynamic weighted histogram analysis
using unbiased Markov state model. Journal of chemical theory and computation, 11(1),
pp.276-285.
chevron_up_icon
1 out of 5
circle_padding
hide_on_mobile
zoom_out_icon
[object Object]