HA1011 Applied Quantitative Methods Assignment Solution - [Date]

Verified

Added on  2021/06/17

|15
|943
|30
Homework Assignment
AI Summary
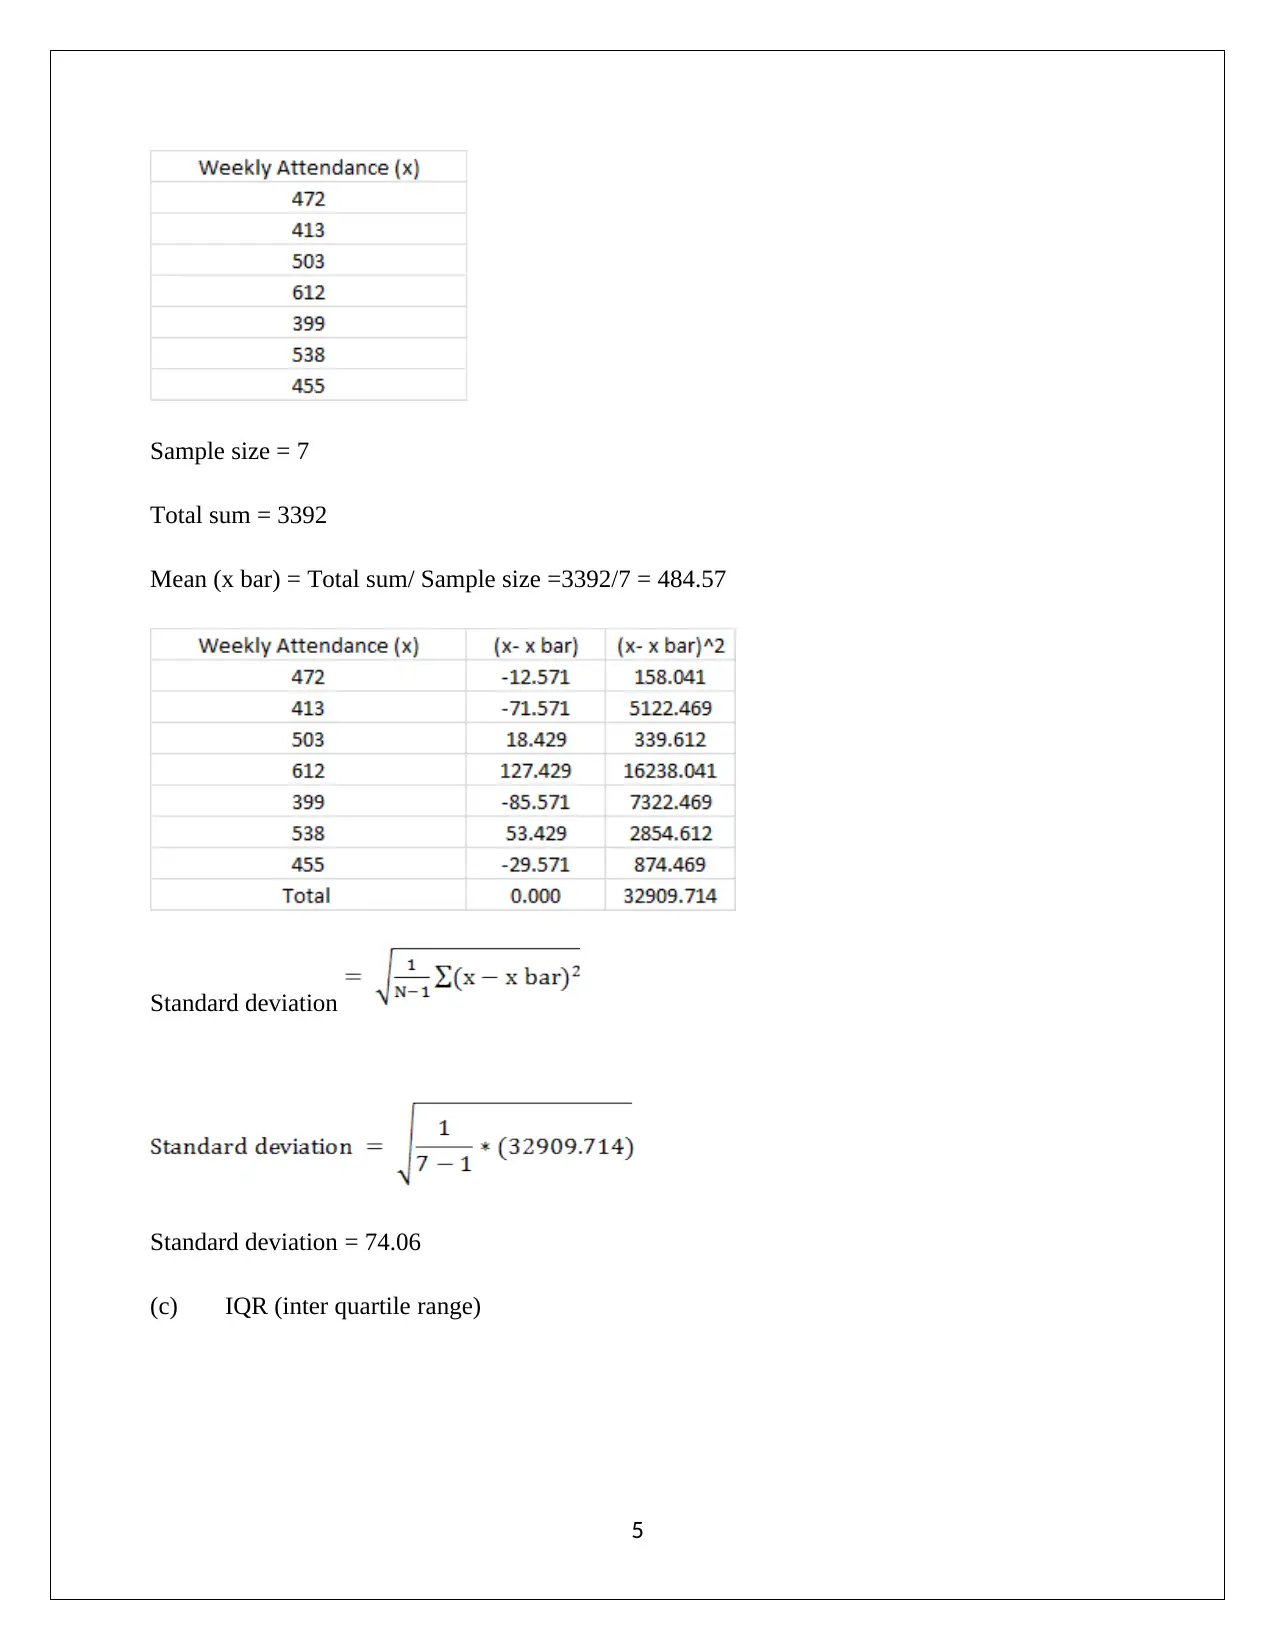
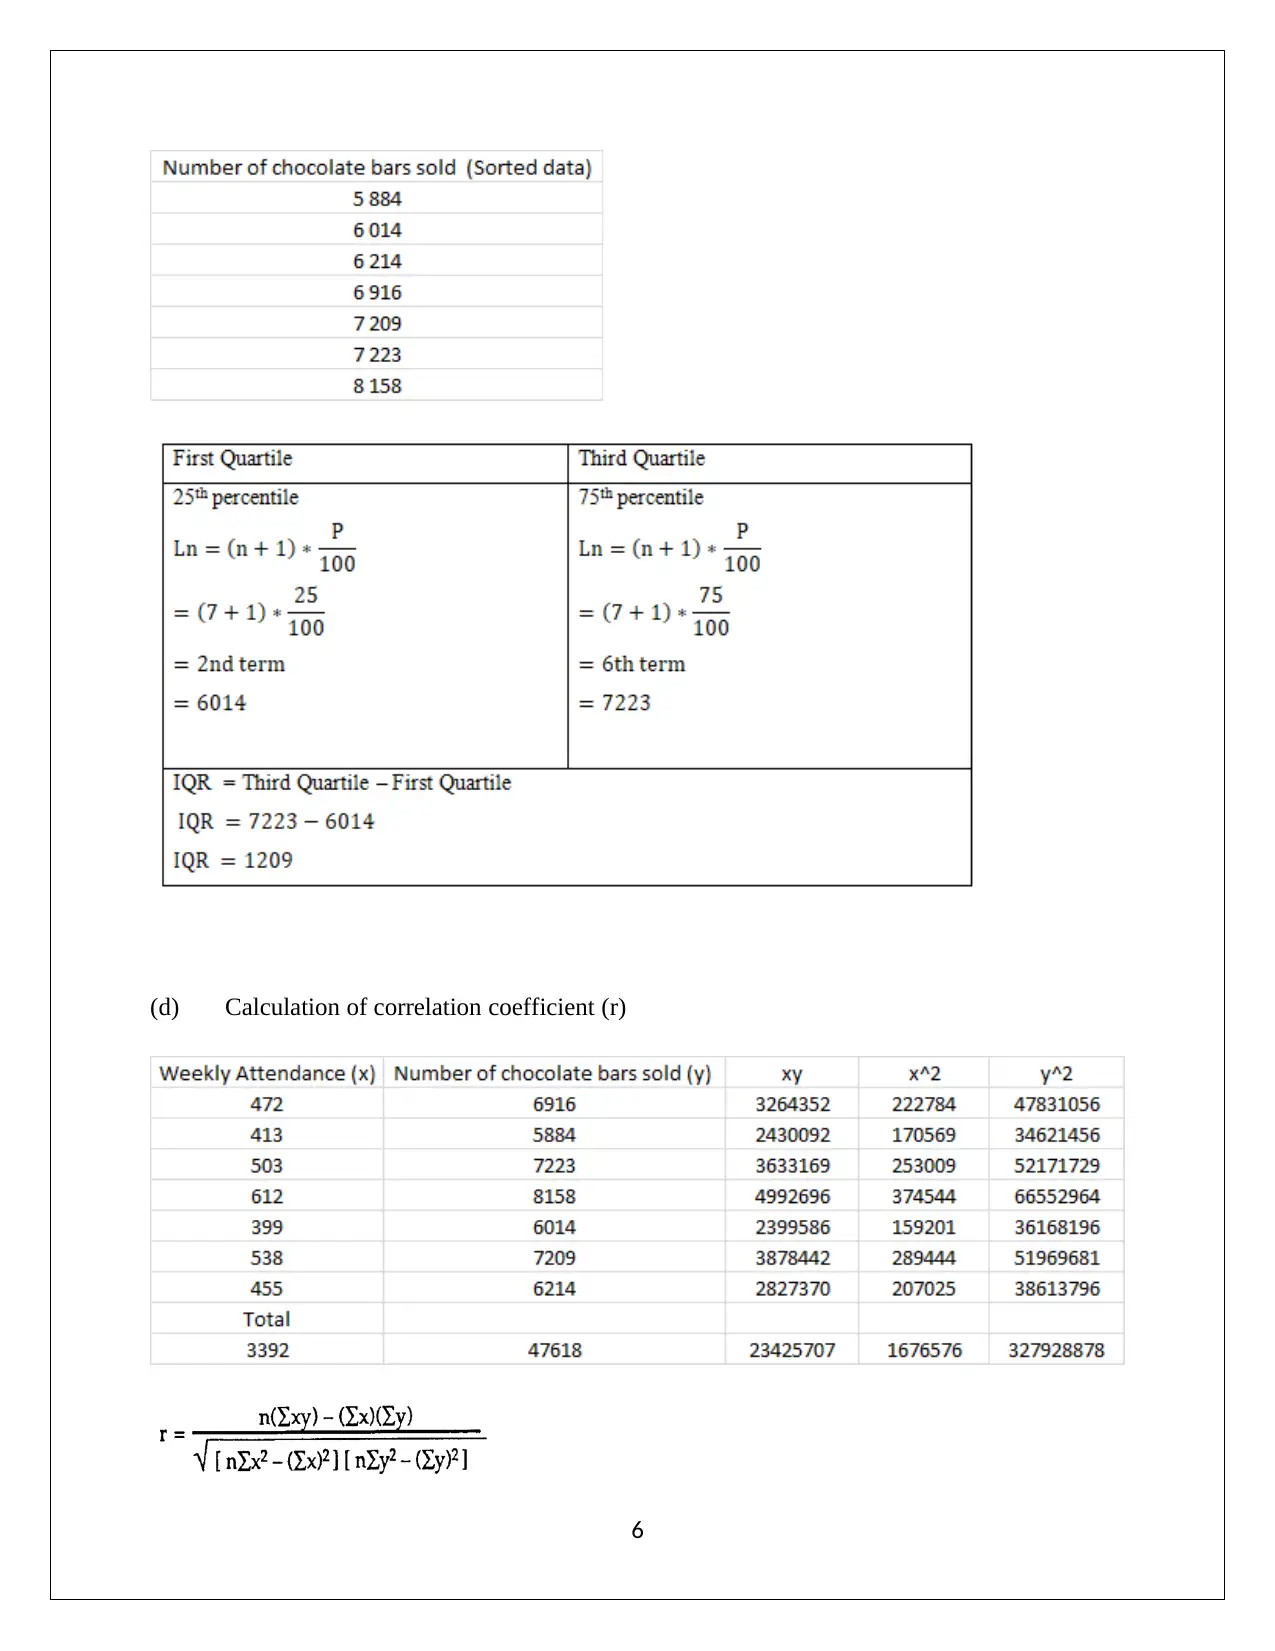
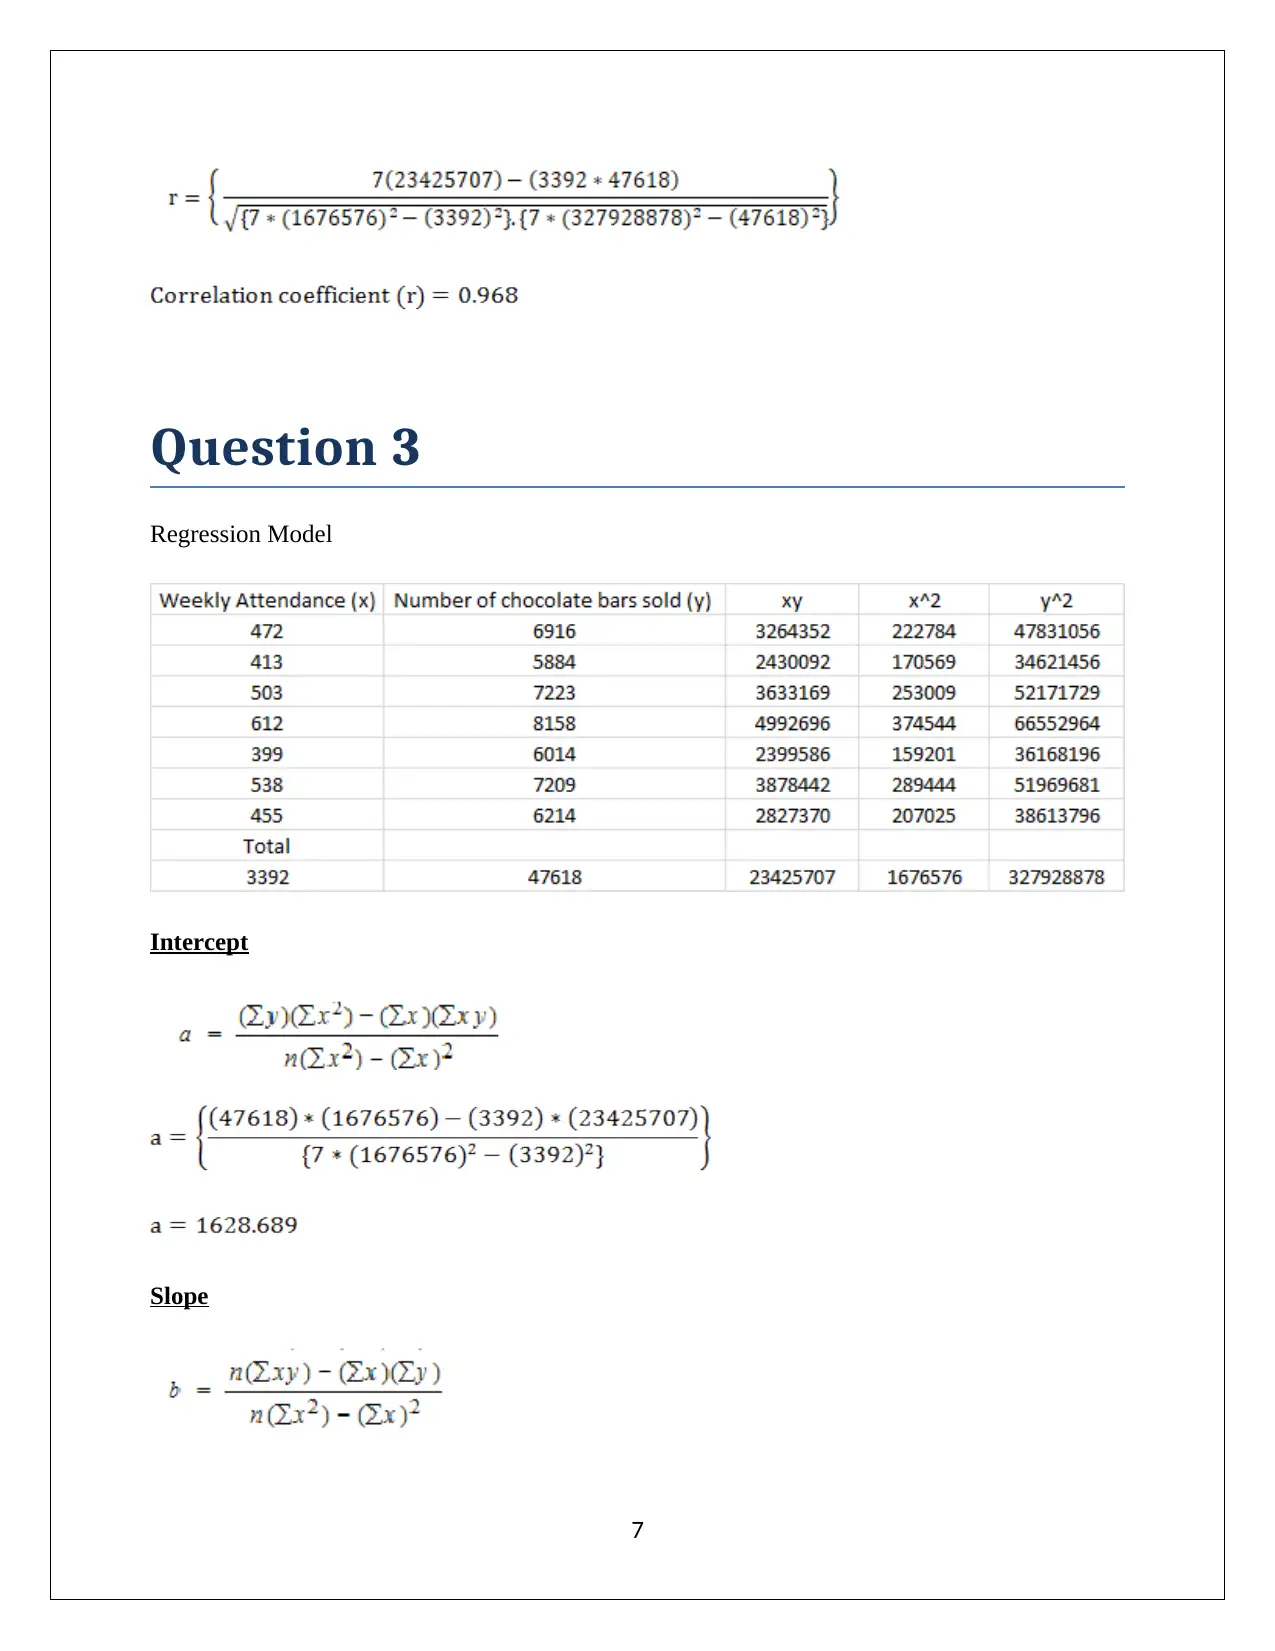
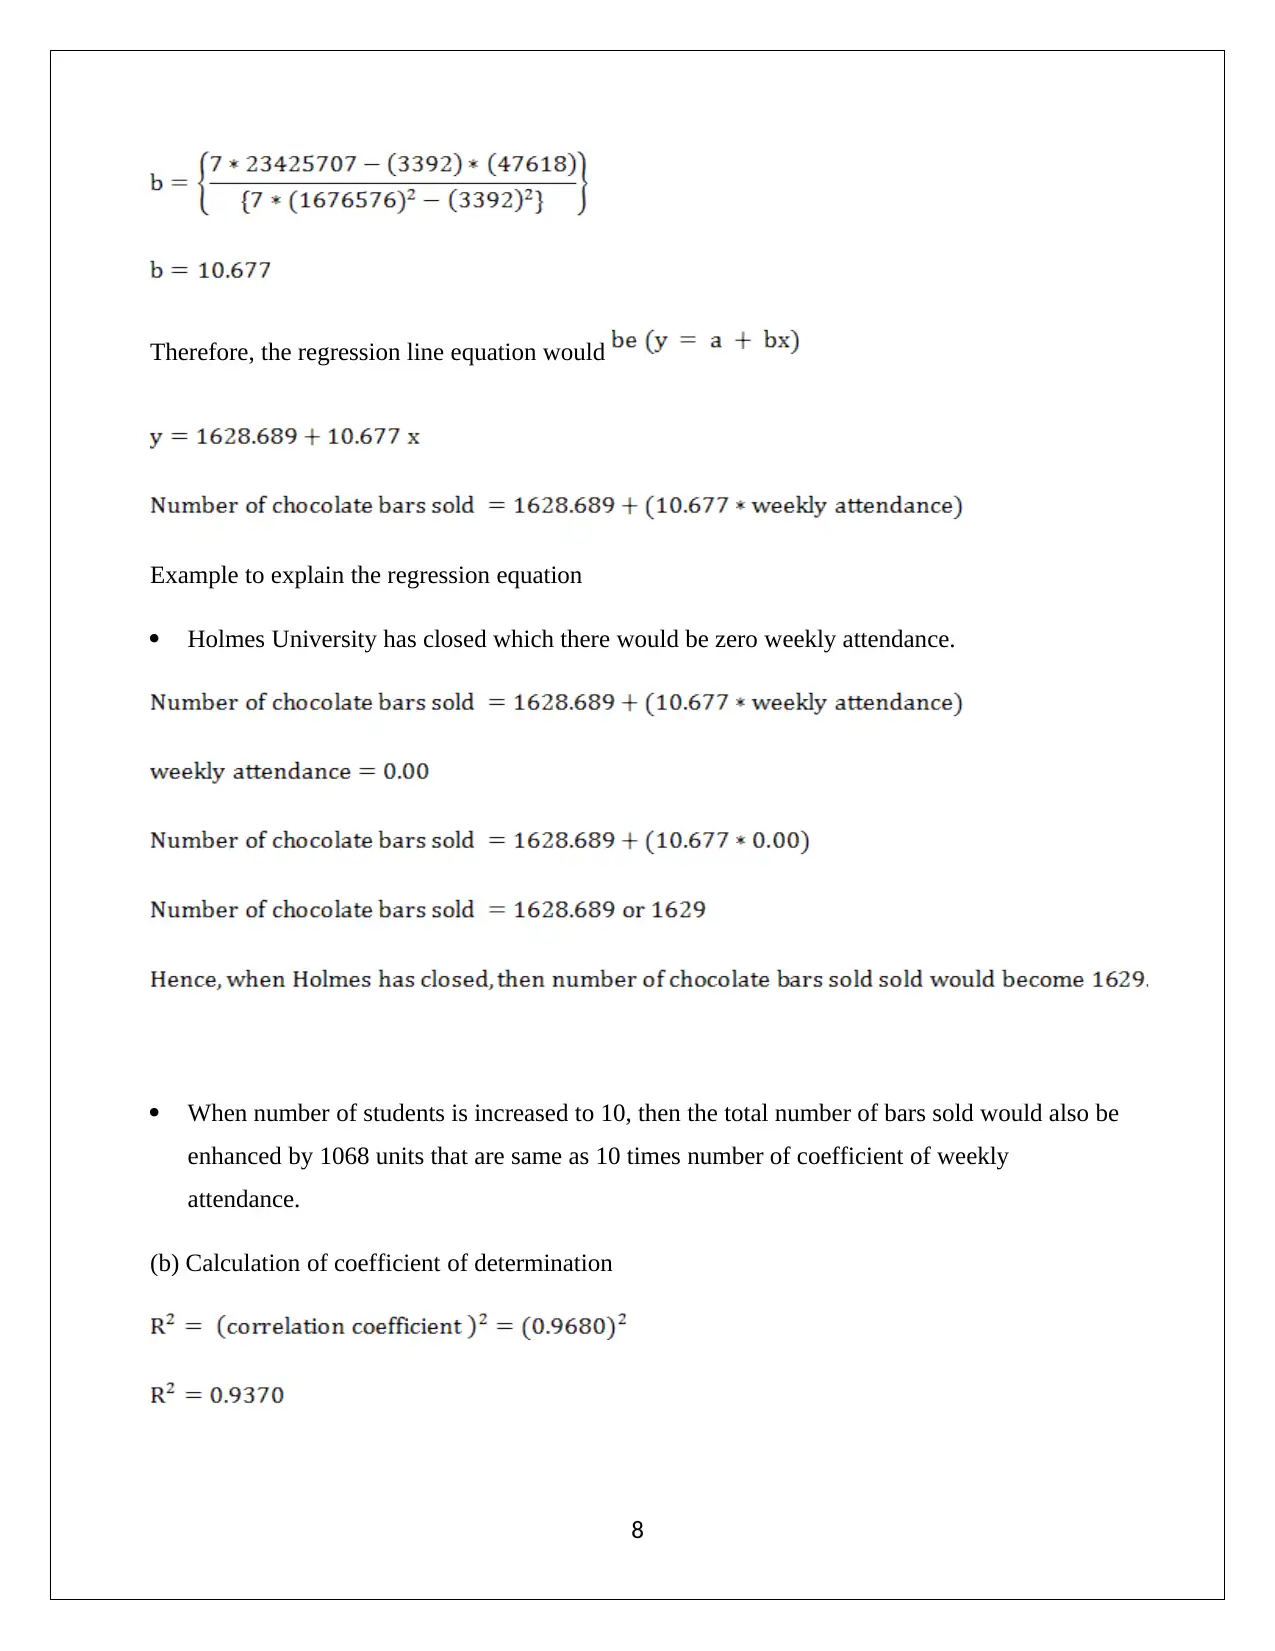
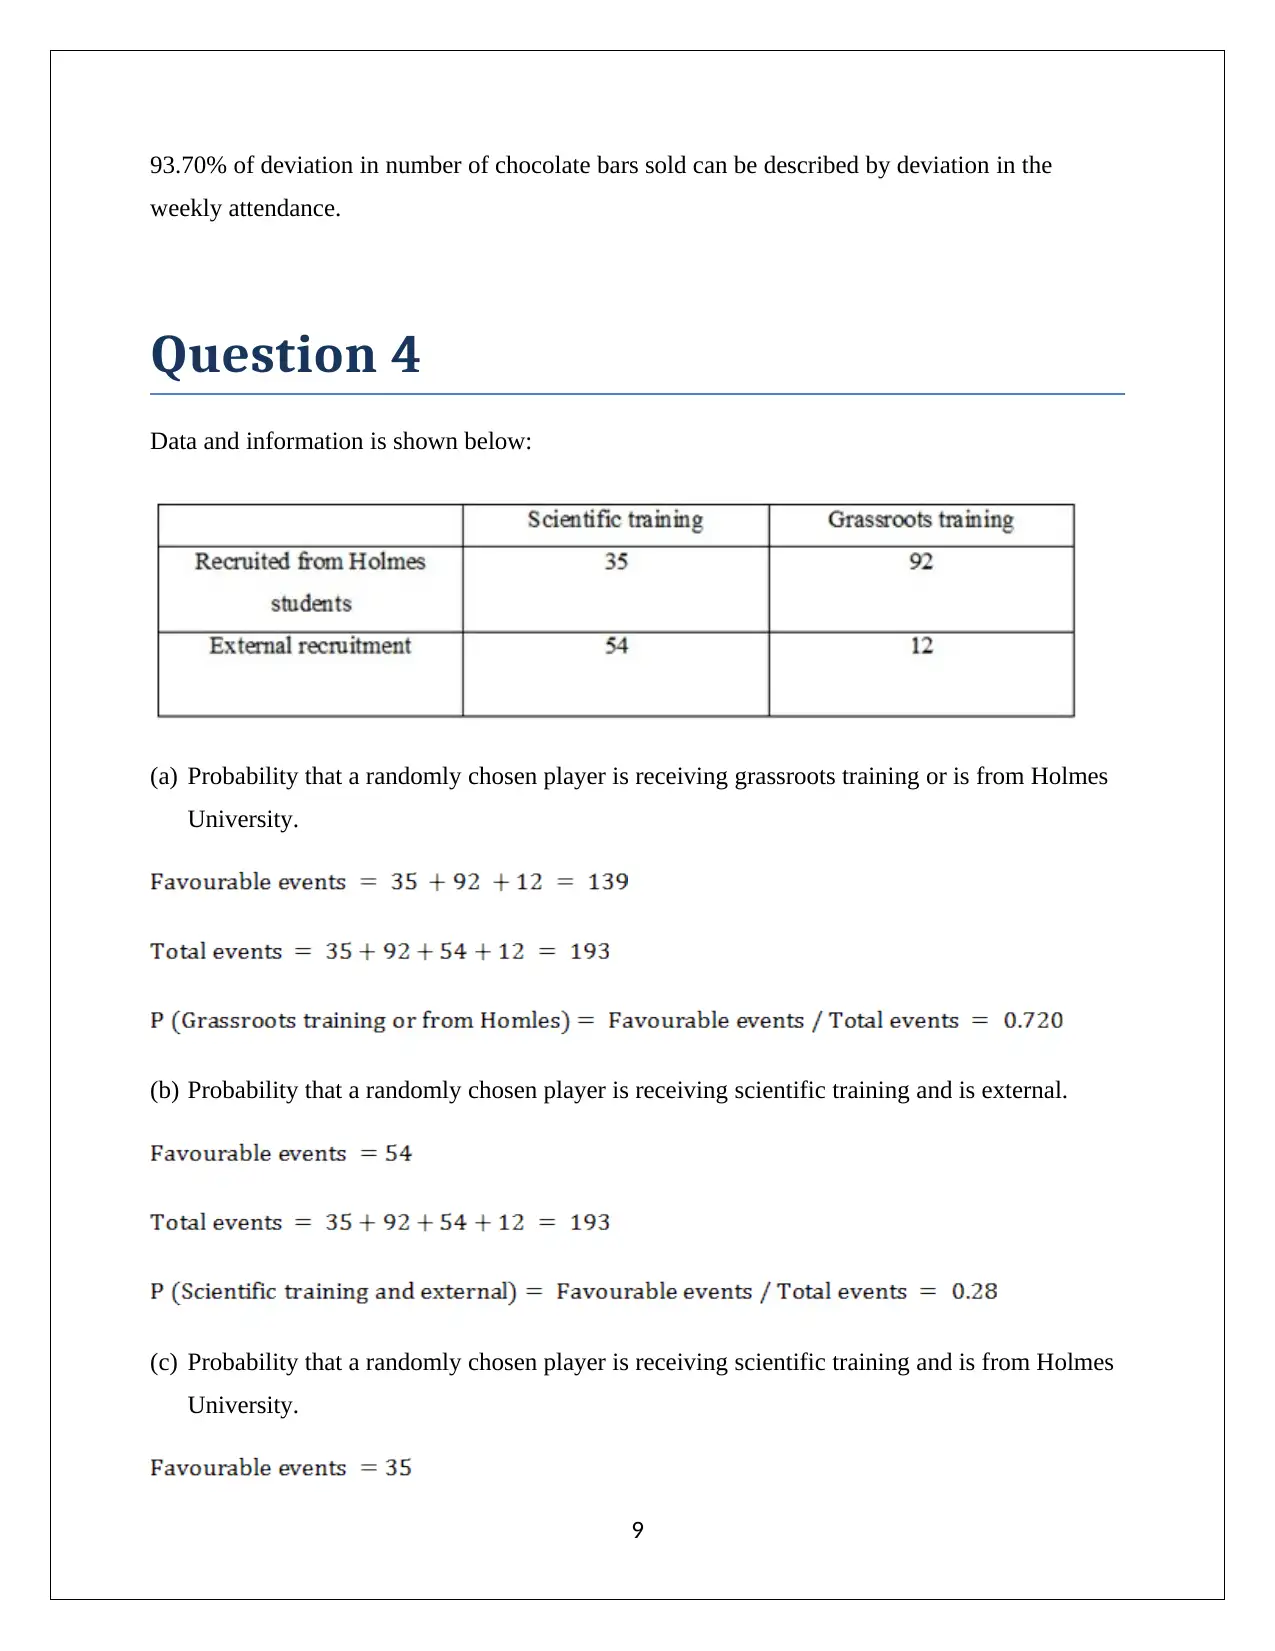
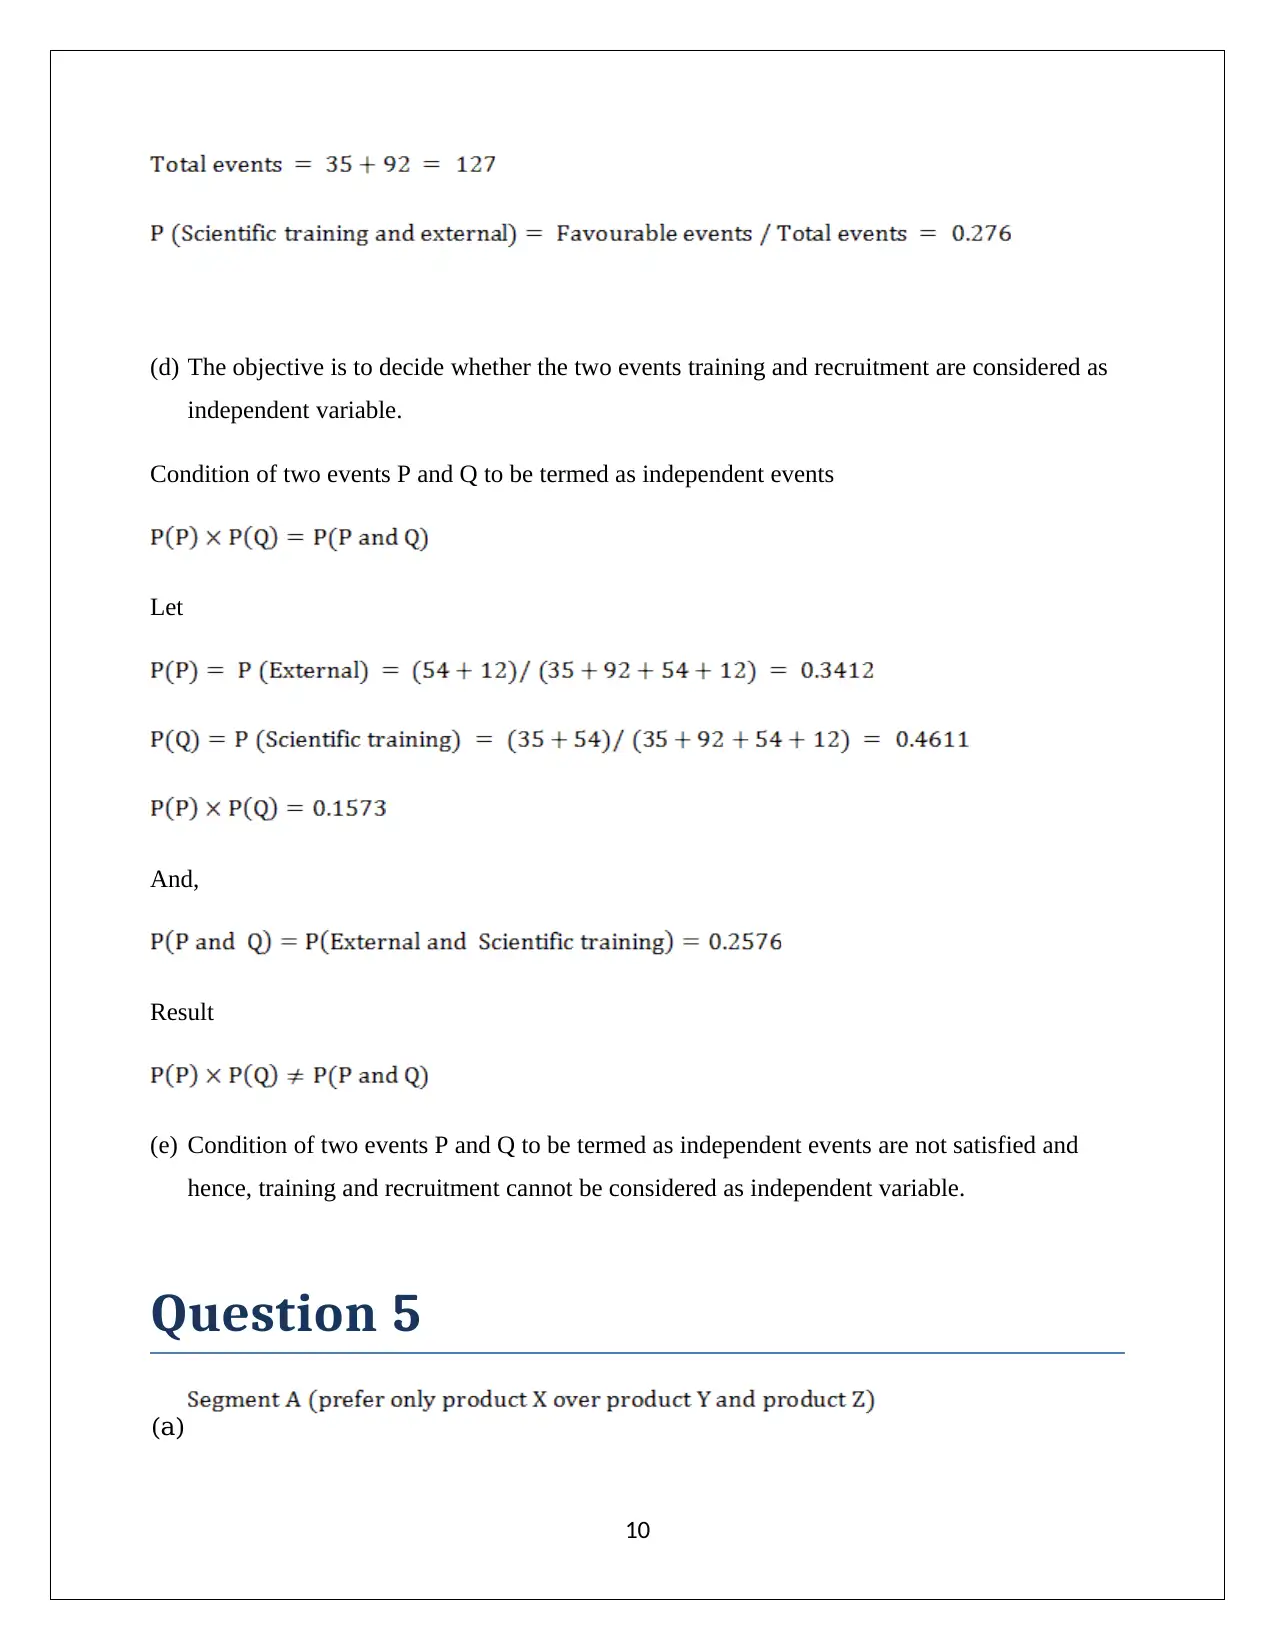
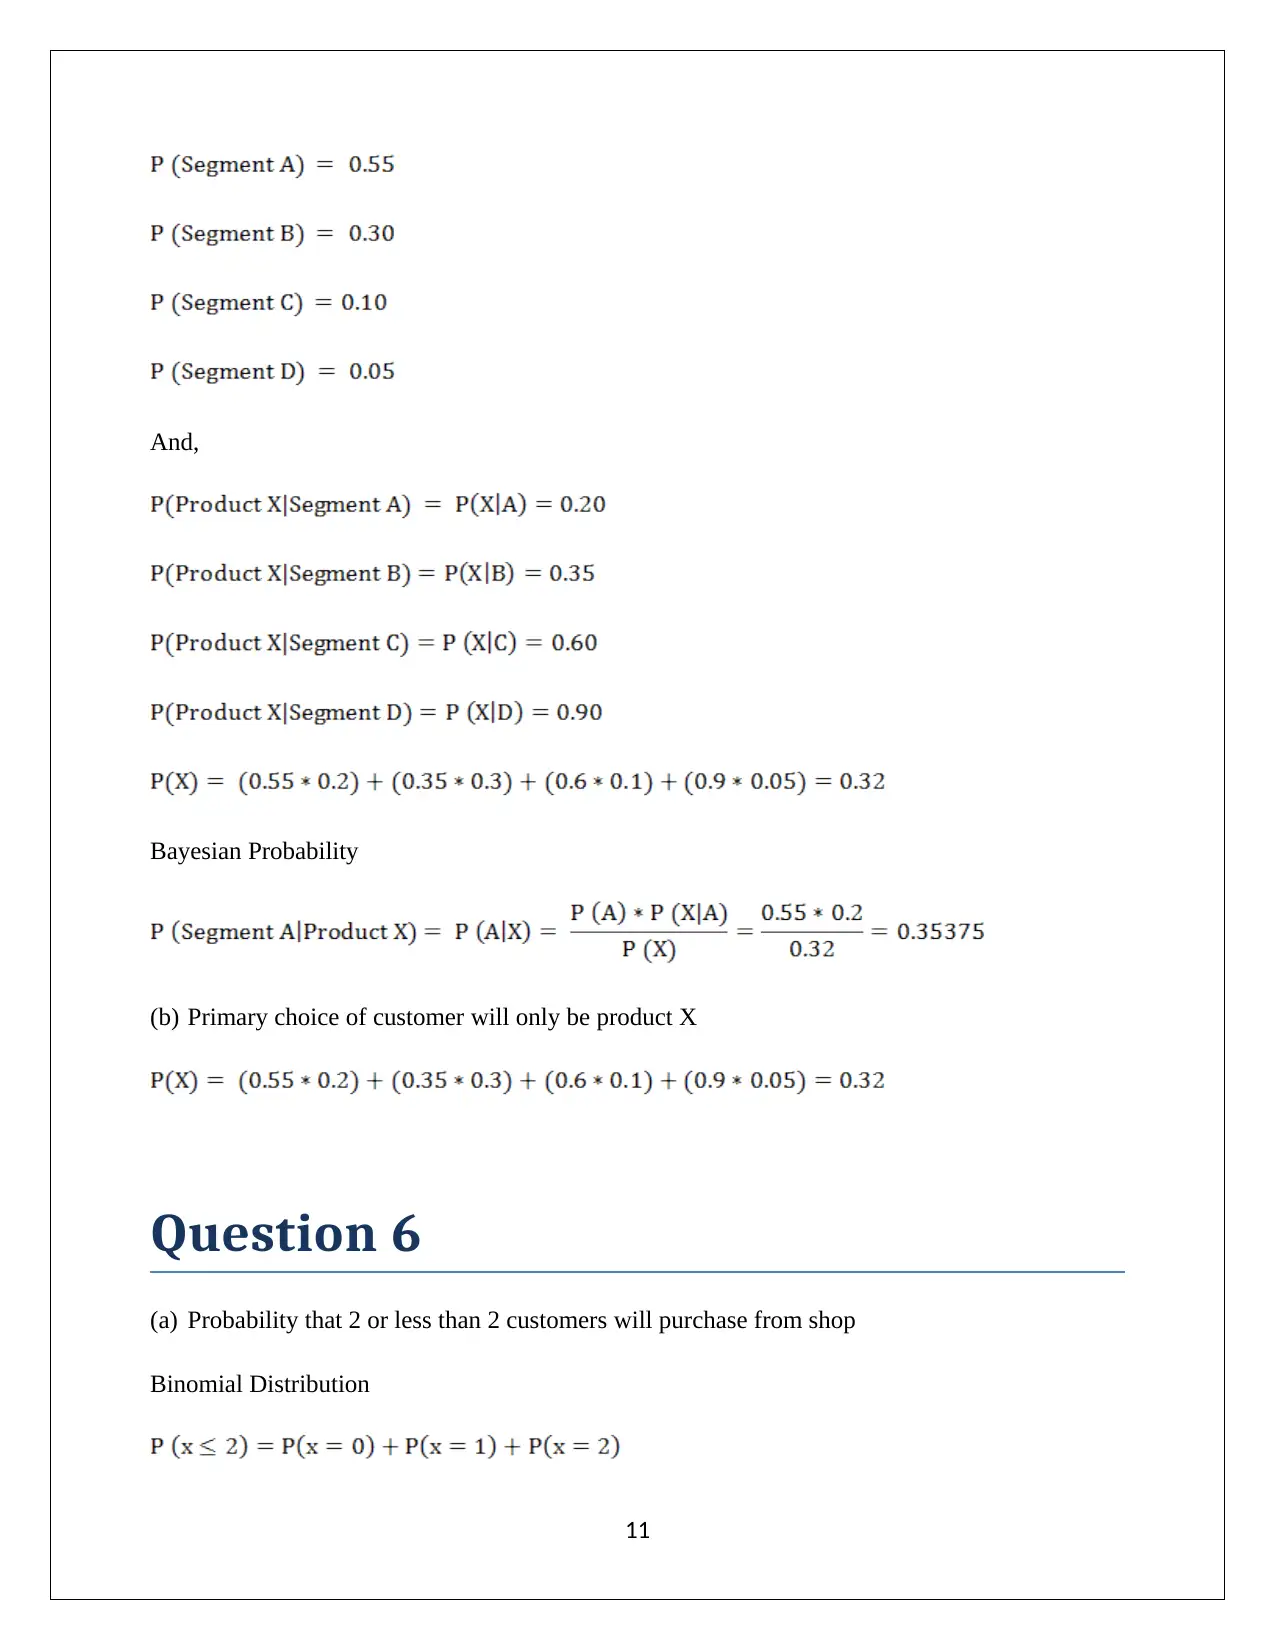
This document presents a comprehensive solution to an Applied Quantitative Methods assignment (HA1011), addressing various statistical concepts and probability distributions. The solution includes detailed calculations and explanations for questions involving frequency tables, histograms, and measures of central tendency (mean, median, and mode). It also covers topics such as standard deviation, interquartile range, correlation coefficients, and regression models, including interpretations of the regression equation. Furthermore, the assignment explores probability calculations, including conditional probabilities, binomial and Poisson distributions, and Bayesian probability. The solution also addresses hypothesis testing using the normal distribution and the central limit theorem. The document provides a complete and well-structured response to the assignment questions, offering valuable insights into applied quantitative methods.
Document Page
APPLIED QUANTITATIVE
METHODS
HA1011
Student Name
[Pick the date]
tabler-icon-diamond-filled.svg

Paraphrase This Document

Need a fresh take? Get an instant paraphrase of this document with our AI Paraphraser
Document Page
Question 1
(a) The frequency table is highlighted below:
(b) Histogram
(c) Mean, median and mode of the data
1
Document Page
Mean
Sample size = 60
Total sum = 62600
Mean = Total sum/ Sample size = (62600/60) = 1033.3
Median
Sorted data in ascending form
2
Document Page
3
tabler-icon-diamond-filled.svg

Paraphrase This Document

Need a fresh take? Get an instant paraphrase of this document with our AI Paraphraser
Document Page
Here,
Median = 715
Mode
The maximum repetition incurred for 401 and therefore, the mode of the data is 401.
Question 2
(a) The given set of data would be categorised as sample not the population. This is because
only the data for the seven weeks has been provided and the given data does not
correspond to all the weeks for which the university is working. Hence, the data would be
sample.
(b) The standard deviation for weekly attendance
4
Document Page
Sample size = 7
Total sum = 3392
Mean (x bar) = Total sum/ Sample size =3392/7 = 484.57
Standard deviation
Standard deviation = 74.06
(c) IQR (inter quartile range)
5
Document Page
(d) Calculation of correlation coefficient (r)
6
tabler-icon-diamond-filled.svg

Paraphrase This Document

Need a fresh take? Get an instant paraphrase of this document with our AI Paraphraser
Document Page
Question 3
Regression Model
Intercept
Slope
7
Document Page
Therefore, the regression line equation would
Example to explain the regression equation
Holmes University has closed which there would be zero weekly attendance.
When number of students is increased to 10, then the total number of bars sold would also be
enhanced by 1068 units that are same as 10 times number of coefficient of weekly
attendance.
(b) Calculation of coefficient of determination
8
Document Page
93.70% of deviation in number of chocolate bars sold can be described by deviation in the
weekly attendance.
Question 4
Data and information is shown below:
(a) Probability that a randomly chosen player is receiving grassroots training or is from Holmes
University.
(b) Probability that a randomly chosen player is receiving scientific training and is external.
(c) Probability that a randomly chosen player is receiving scientific training and is from Holmes
University.
9
tabler-icon-diamond-filled.svg

Paraphrase This Document

Need a fresh take? Get an instant paraphrase of this document with our AI Paraphraser
Document Page
(d) The objective is to decide whether the two events training and recruitment are considered as
independent variable.
Condition of two events P and Q to be termed as independent events
Let
And,
Result
(e) Condition of two events P and Q to be termed as independent events are not satisfied and
hence, training and recruitment cannot be considered as independent variable.
Question 5
(a)
10
Document Page
And,
Bayesian Probability
(b) Primary choice of customer will only be product X
Question 6
(a) Probability that 2 or less than 2 customers will purchase from shop
Binomial Distribution
11
chevron_up_icon
1 out of 15
circle_padding
hide_on_mobile
zoom_out_icon
[object Object]