Holmes Institute HA1011: Applied Quantitative Methods Group Assignment

Verified

Added on  2022/11/01

|12
|1103
|265
Homework Assignment
AI Summary
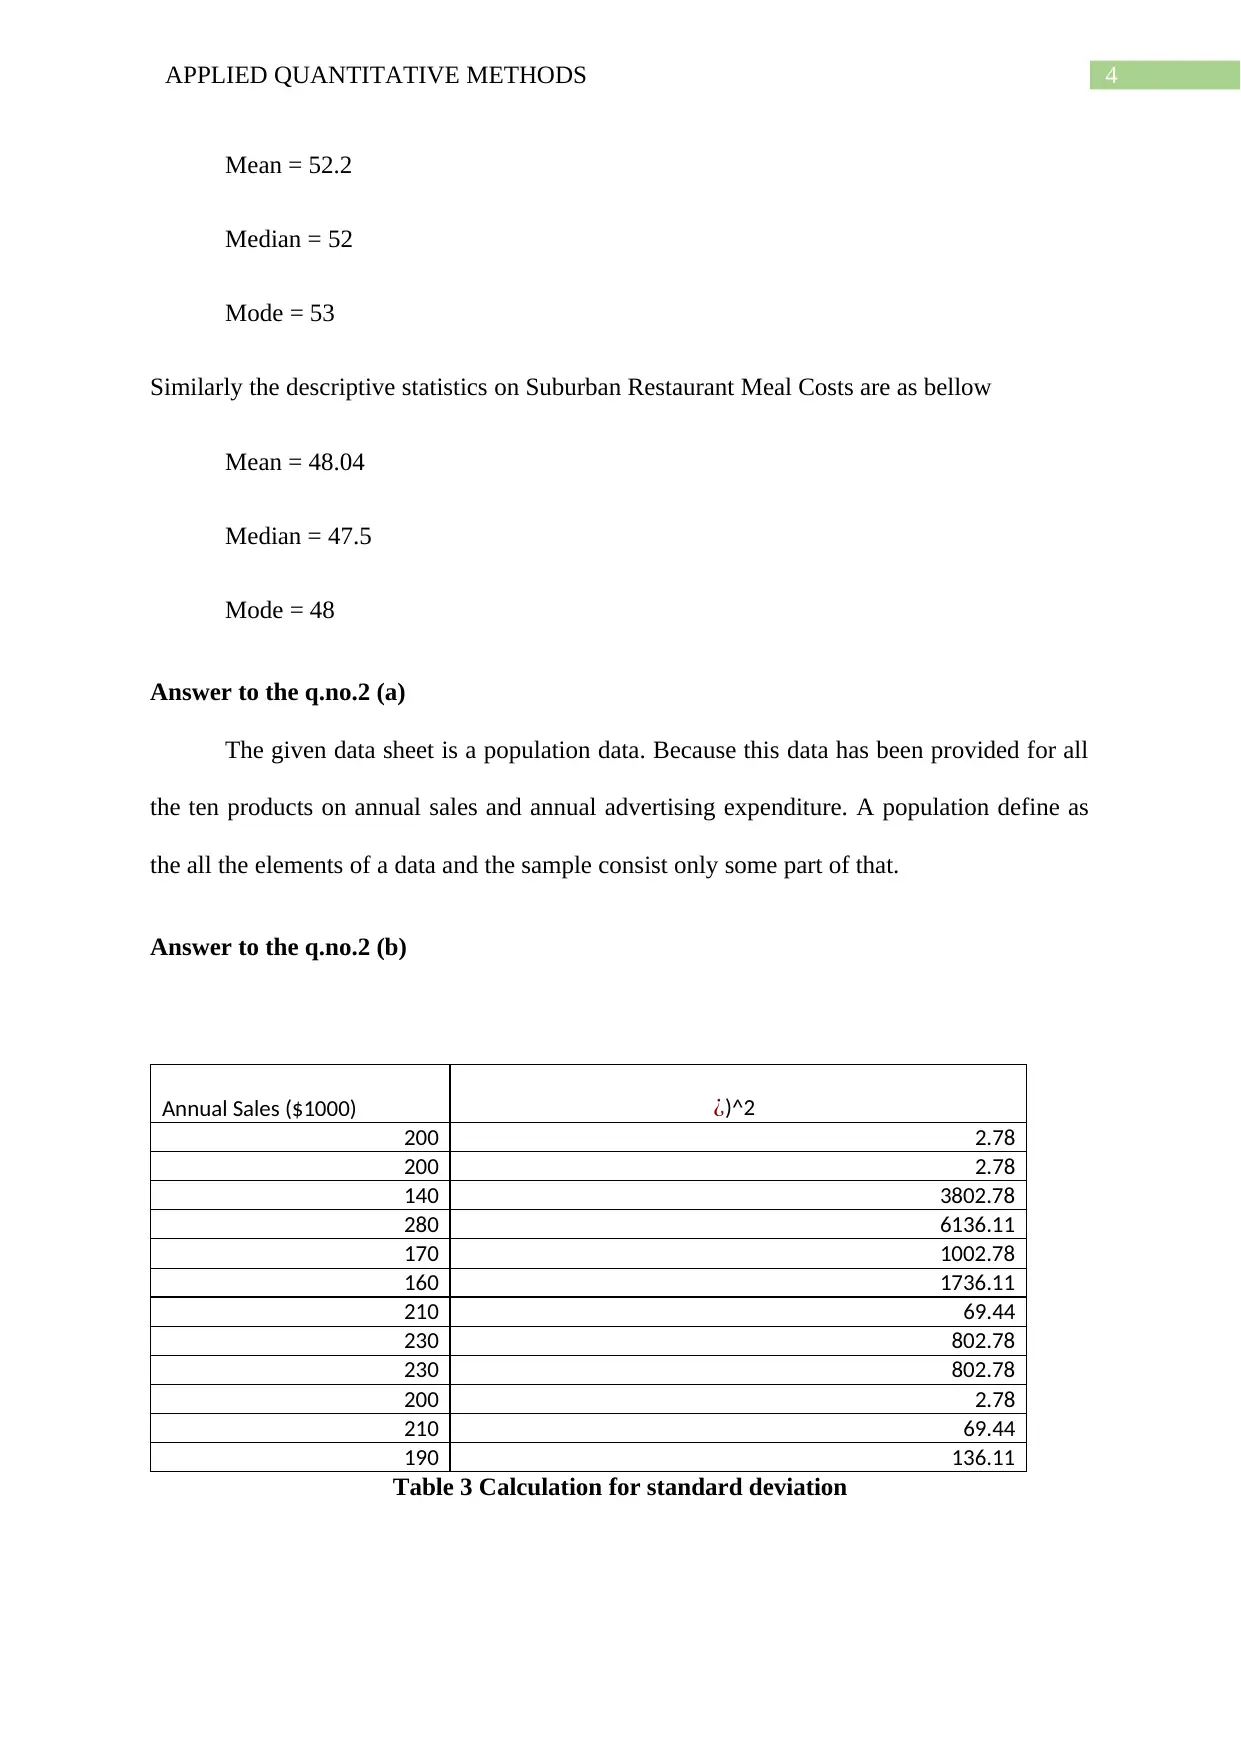
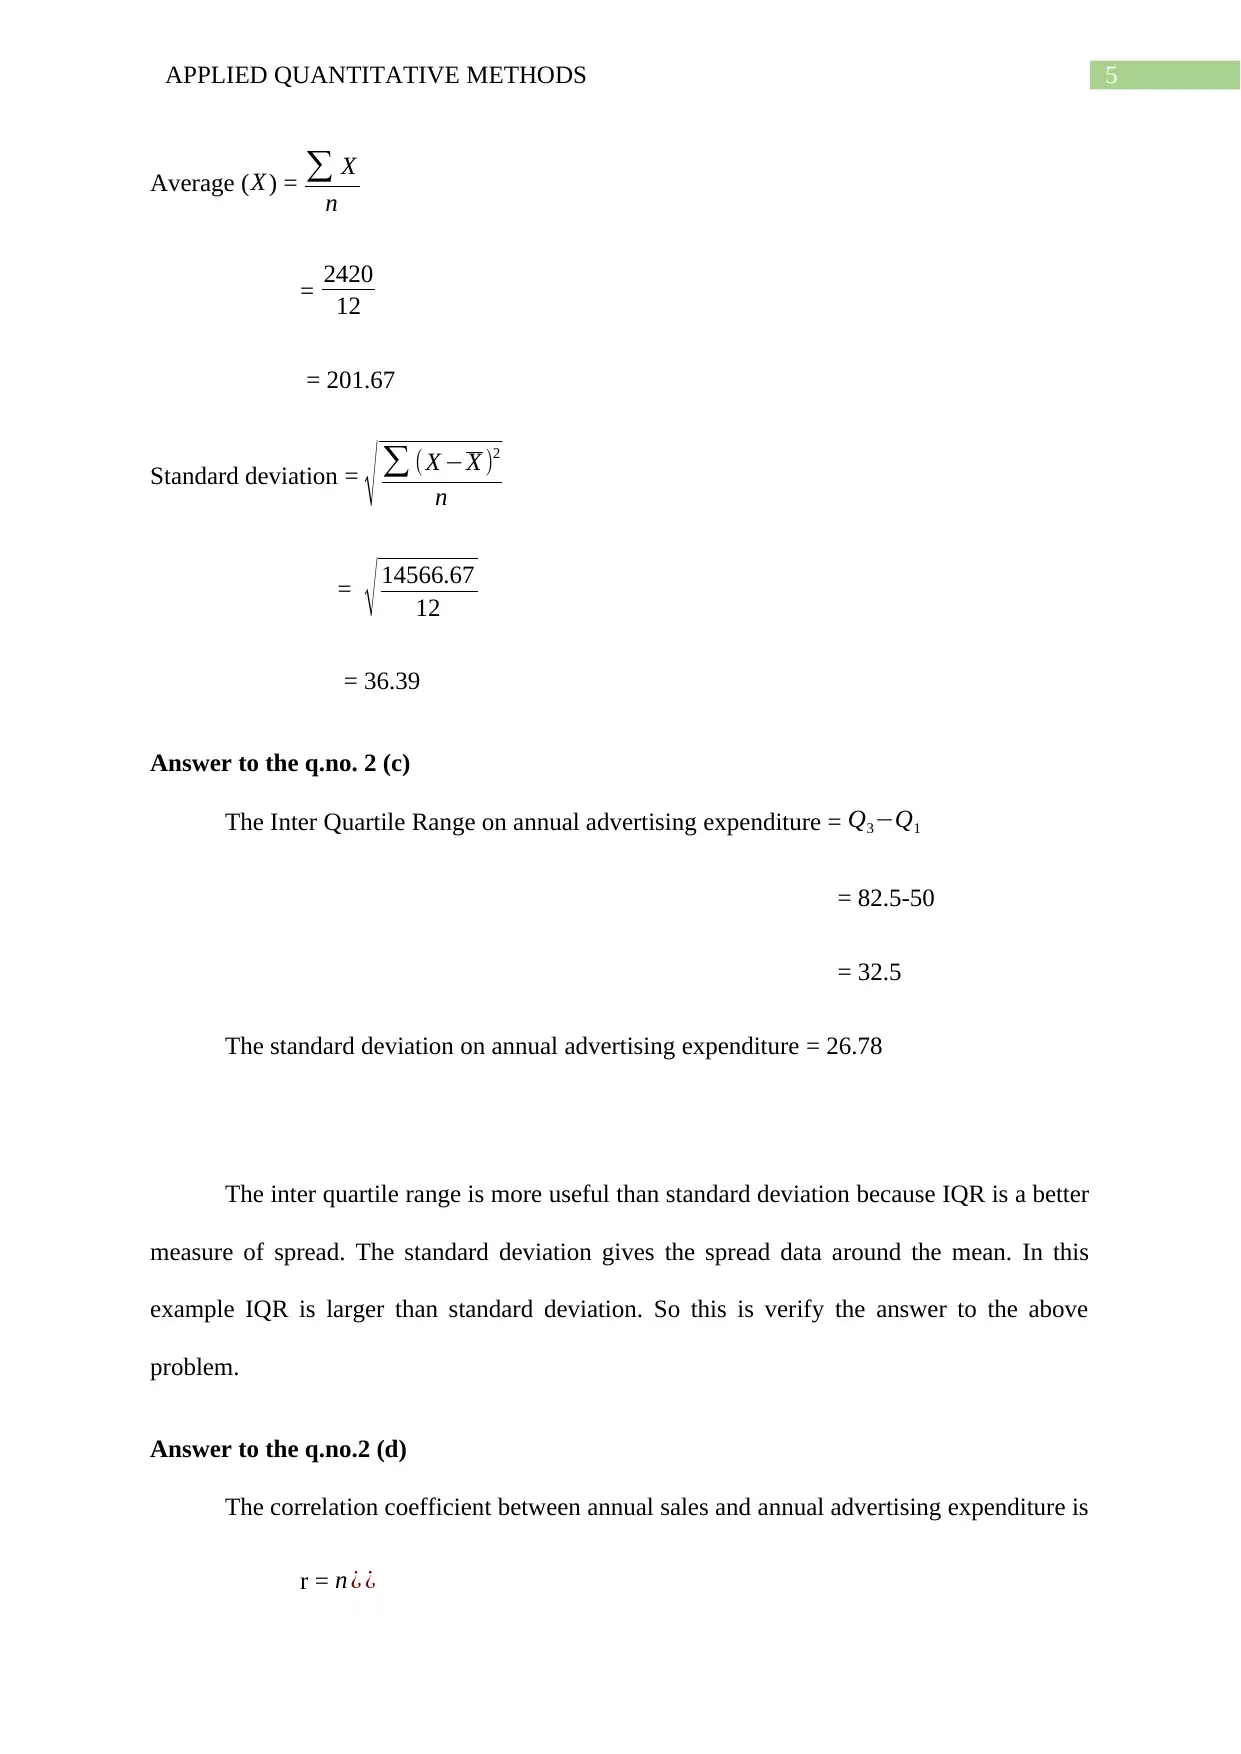
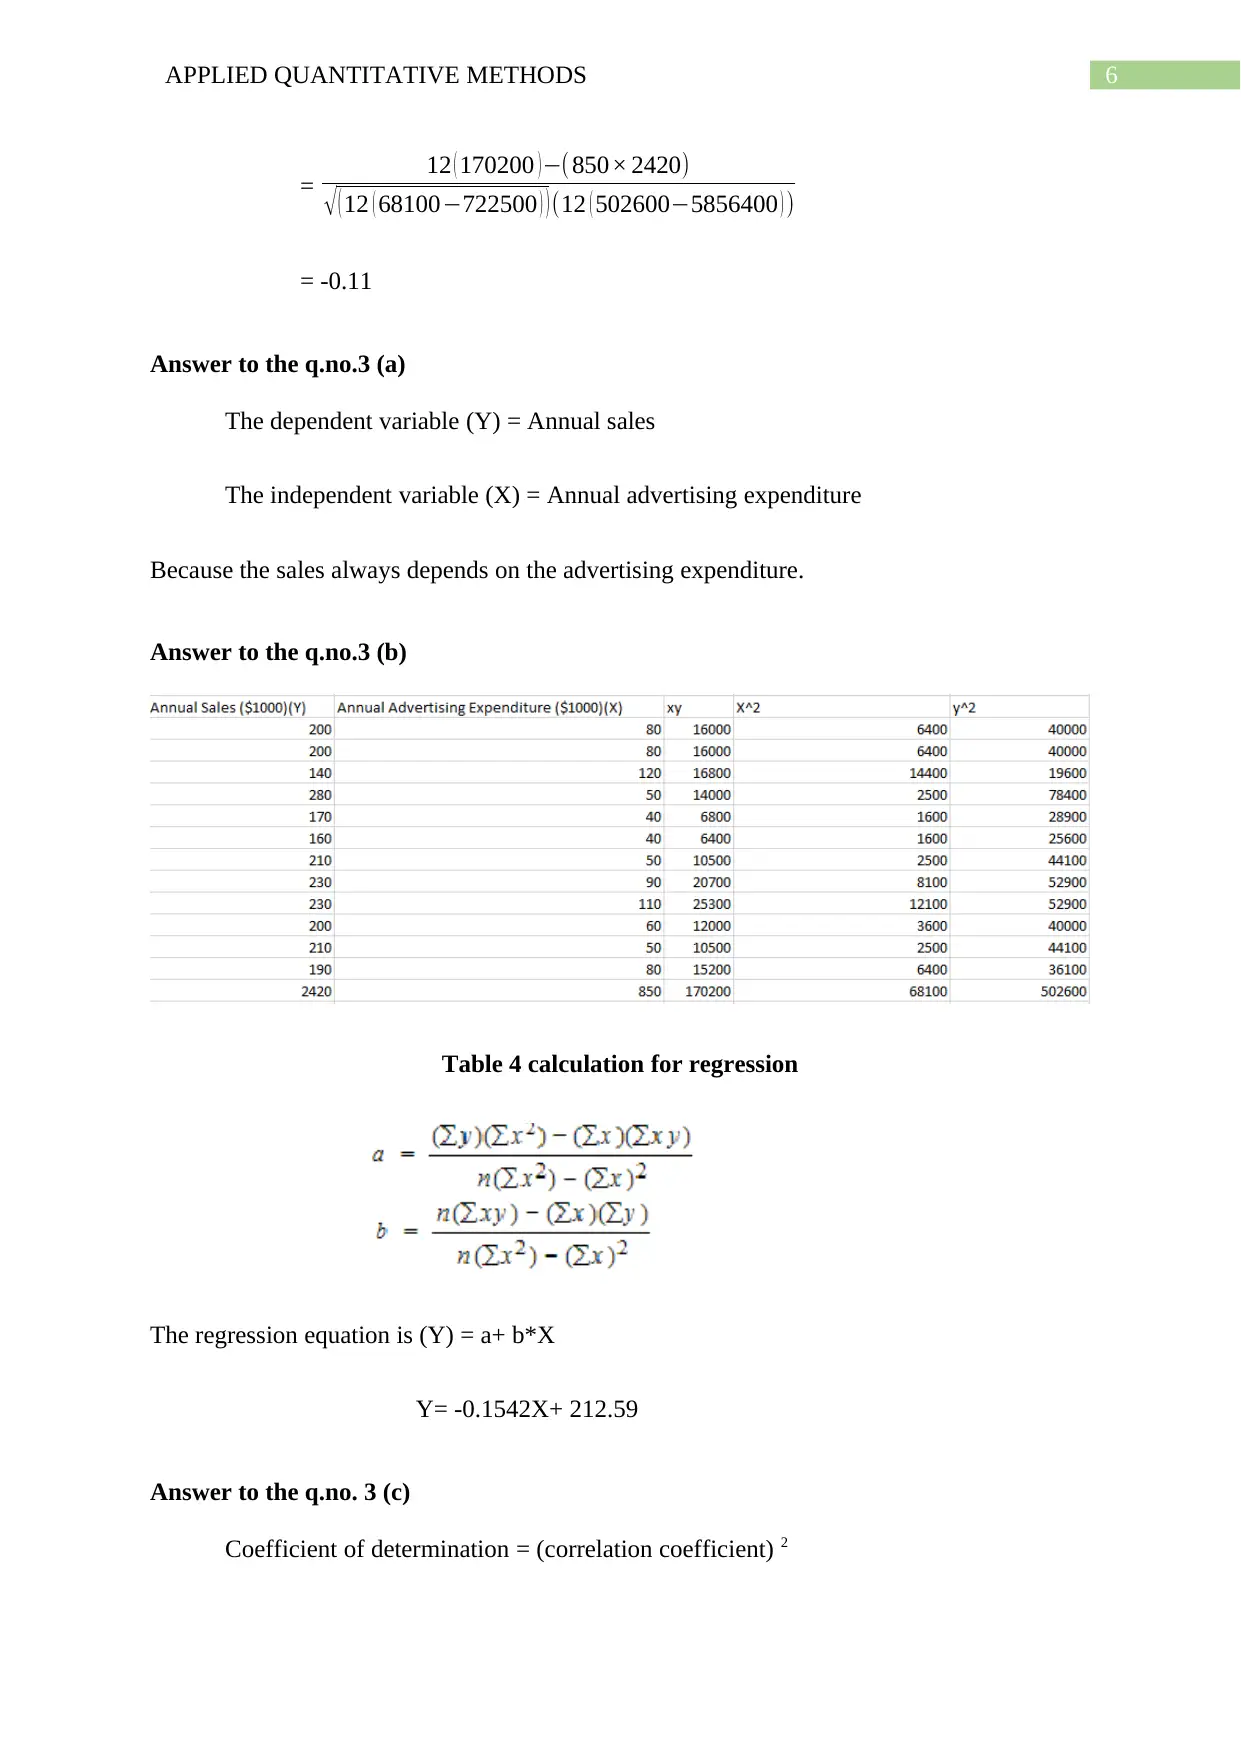
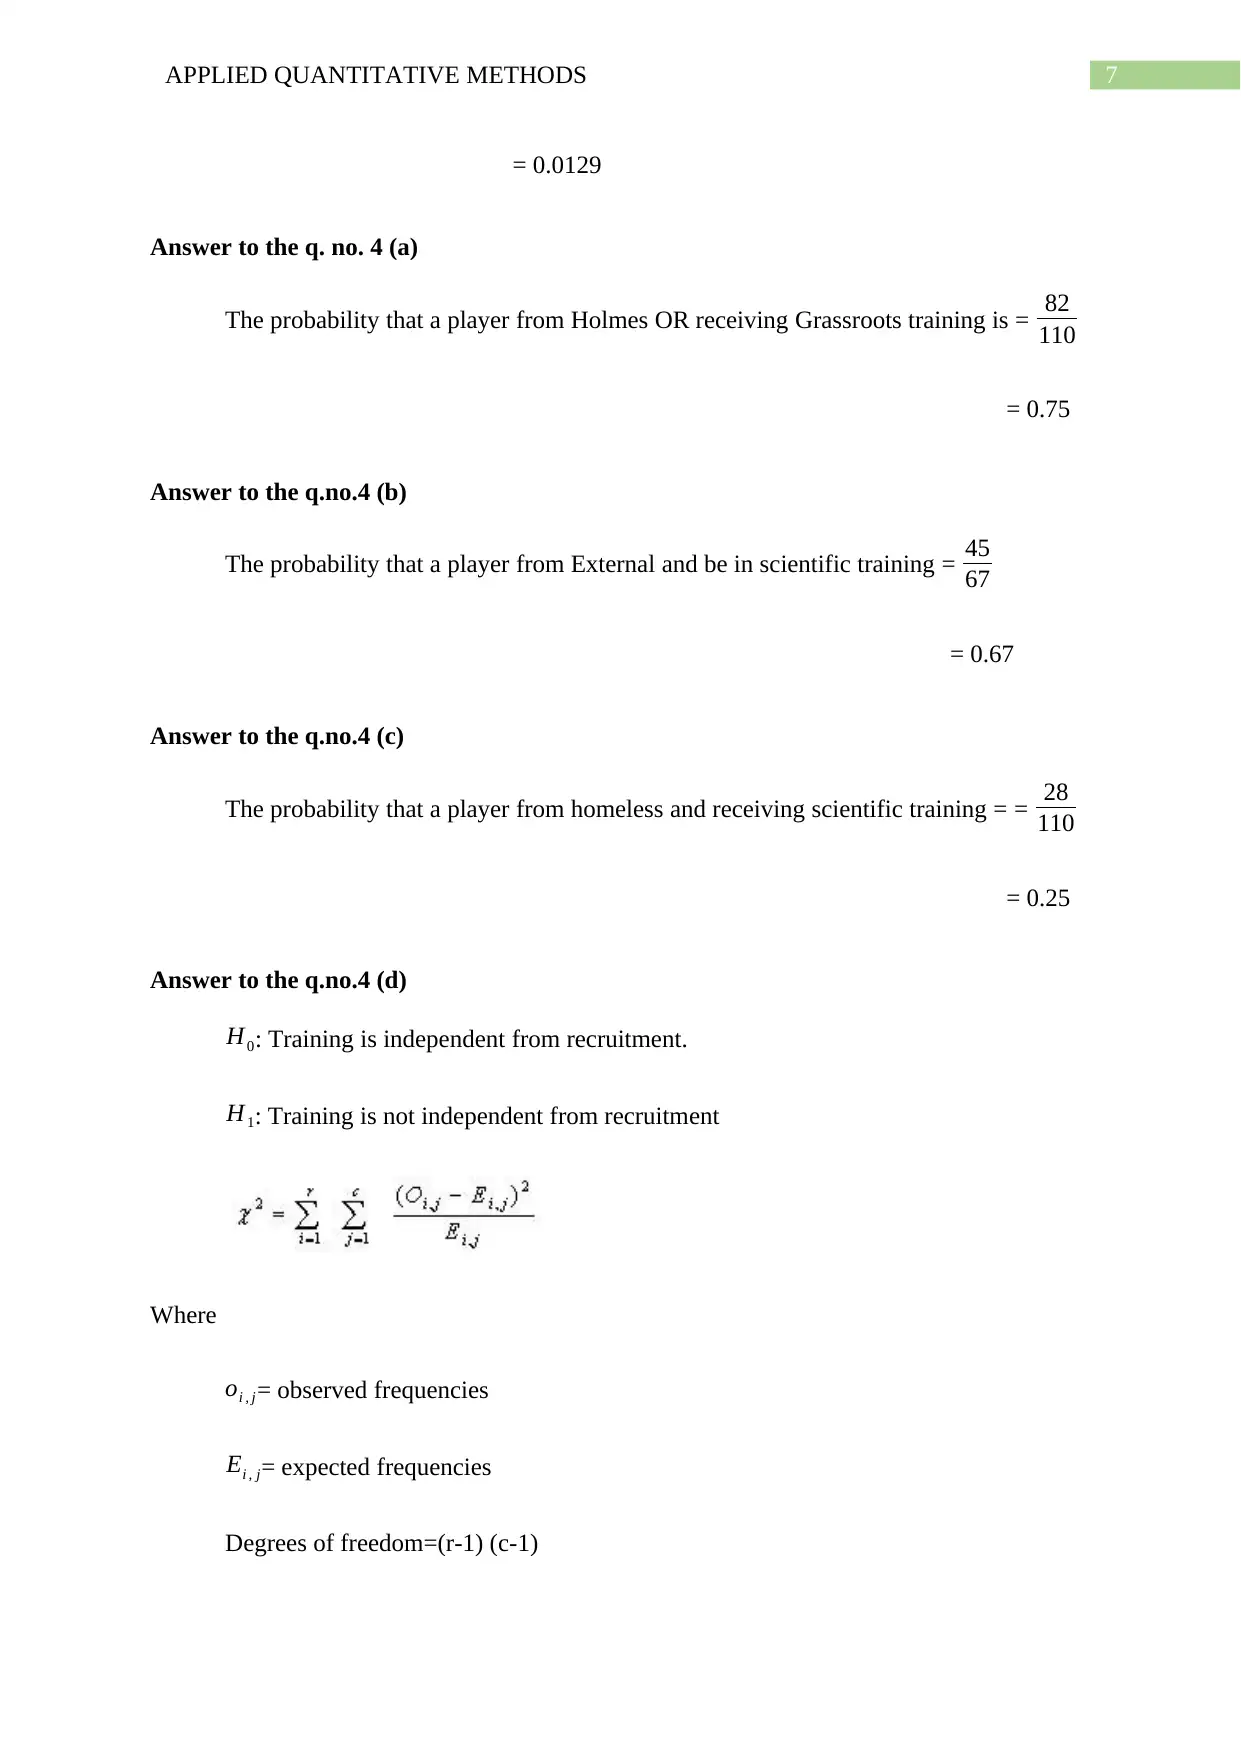
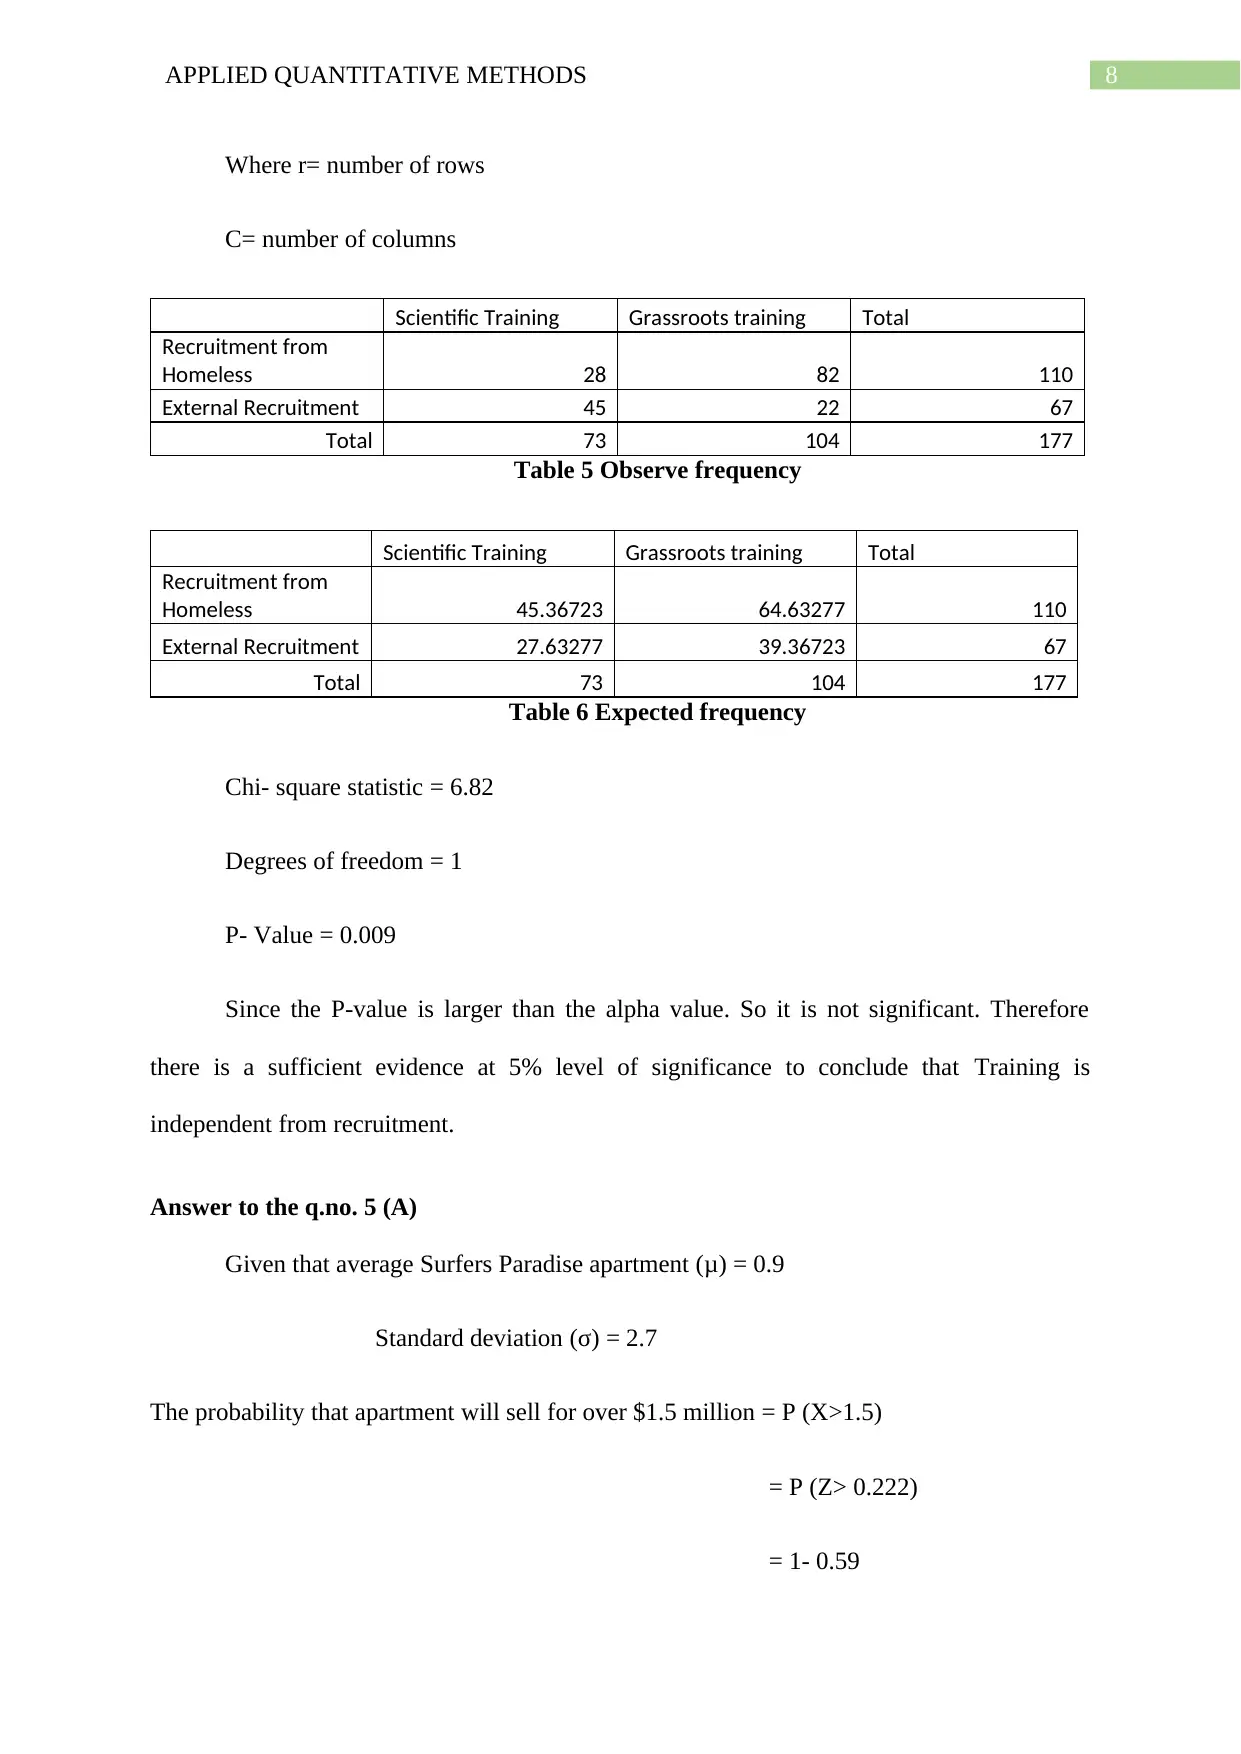
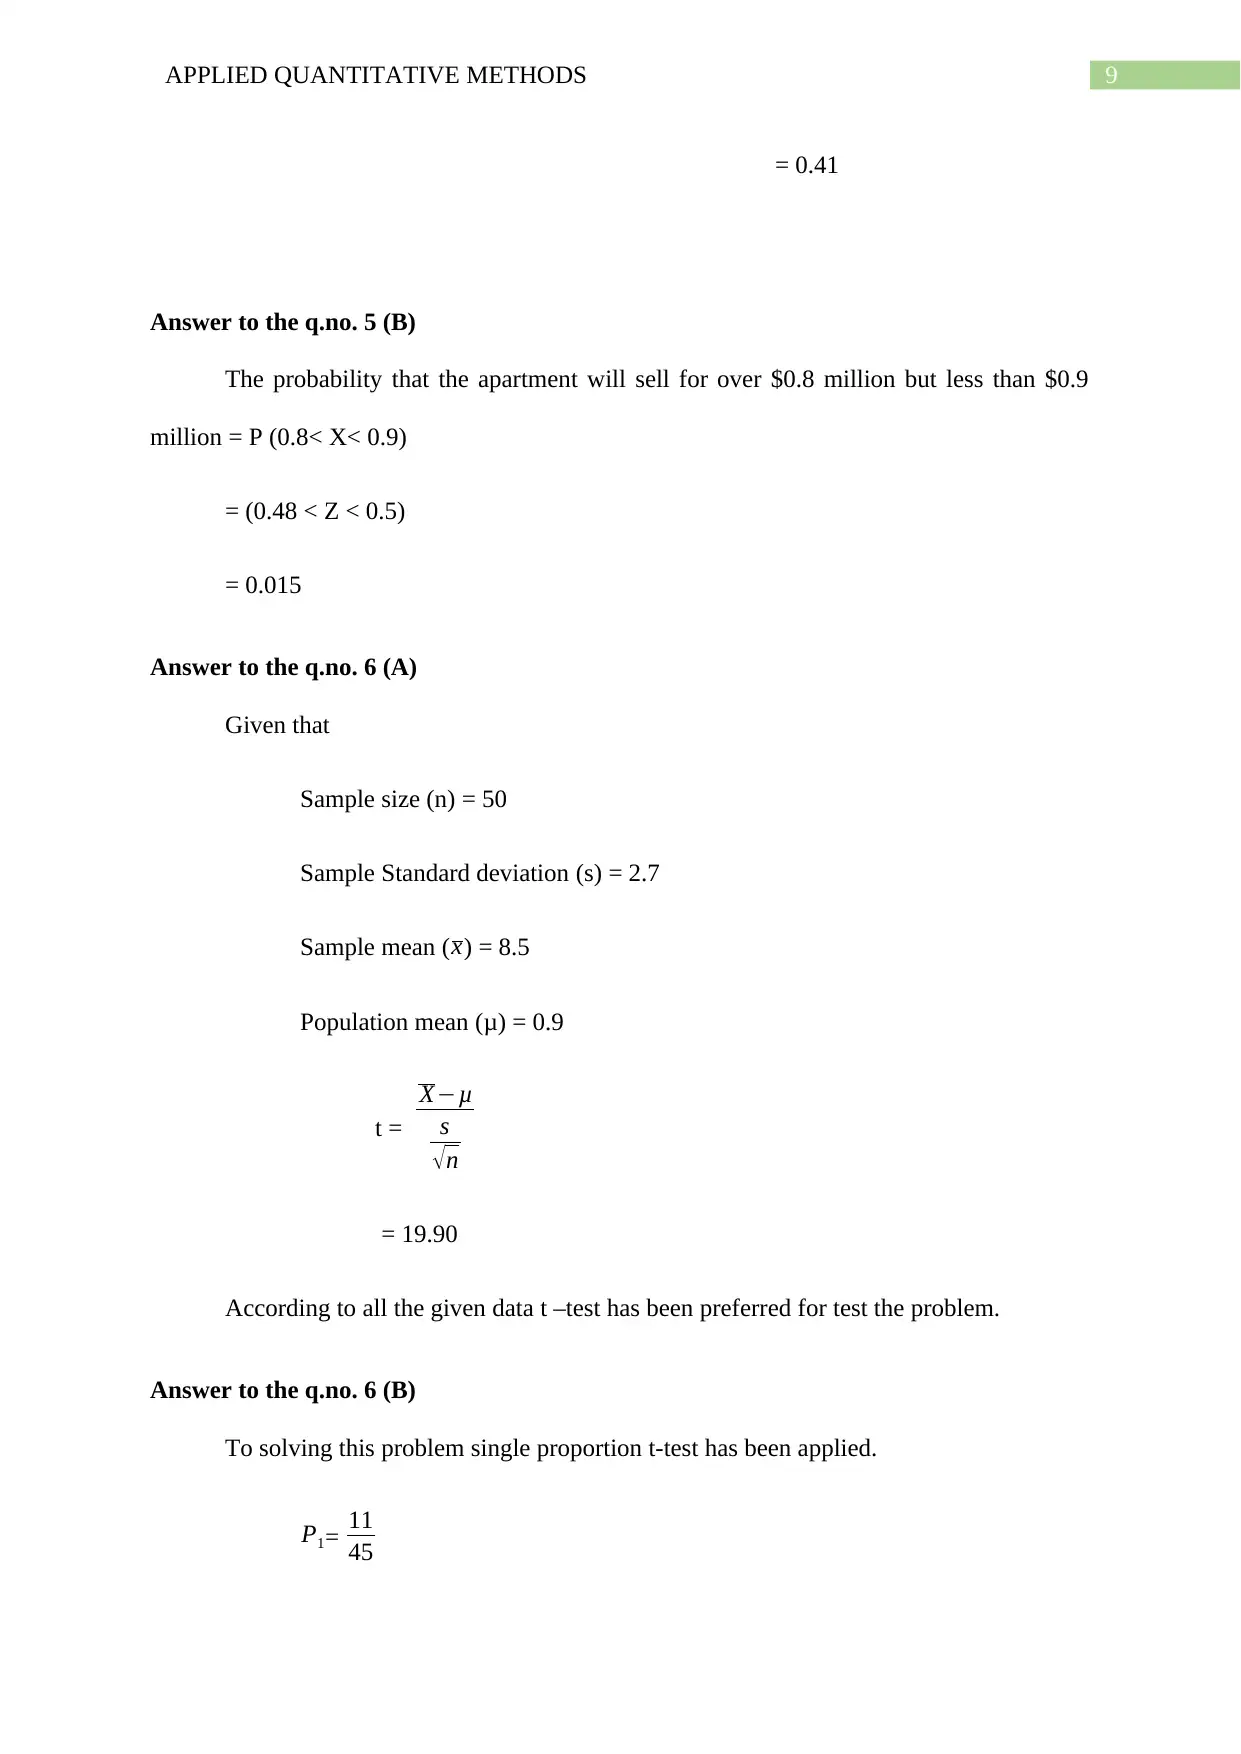
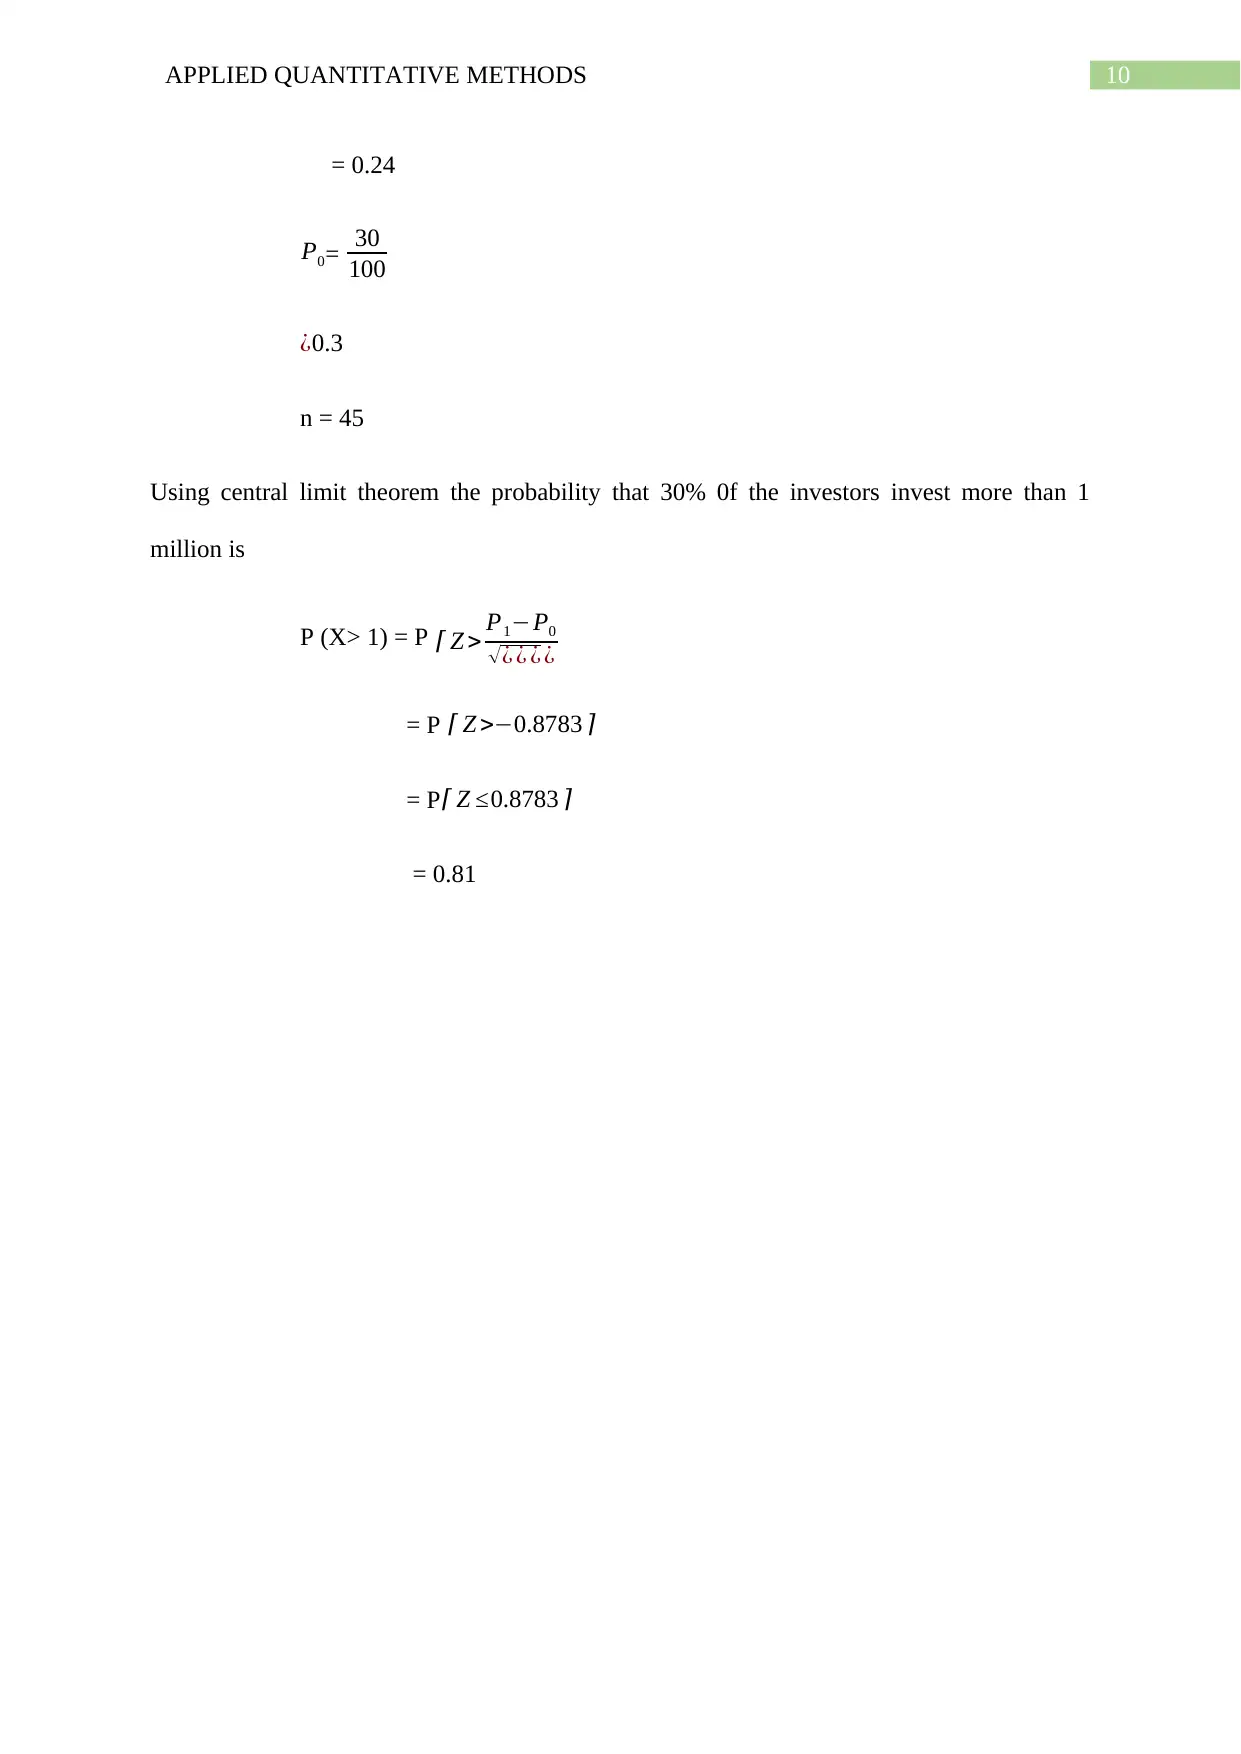
This assignment provides a comprehensive analysis of applied quantitative methods, covering a range of statistical techniques relevant to business research. The student's work includes calculations and interpretations of descriptive statistics such as mean, median, and mode for restaurant meal costs. It explores population data, calculates standard deviations, and analyzes interquartile ranges. The assignment delves into correlation coefficients, regression analysis, and the coefficient of determination to examine relationships between variables like annual sales and advertising expenditure. Furthermore, it applies probability concepts, including conditional probability and chi-square tests for independence, using scenarios related to player training and recruitment. The student also addresses probability distributions, including the normal distribution, and performs t-tests for hypothesis testing, demonstrating a strong understanding of statistical methods and their application in business contexts. References are included using Harvard referencing style.
Document Page
Running head: APPLIED QUANTITATIVE METHODS
Applied Quantitative Methods
Name of the Student
Name of the University
Author note:
tabler-icon-diamond-filled.svg

Paraphrase This Document

Need a fresh take? Get an instant paraphrase of this document with our AI Paraphraser
Document Page
1APPLIED QUANTITATIVE METHODS
Table of Contents
Answer to the q.no. 1(a).............................................................................................................2
Answer to the q.no. 1 (b)............................................................................................................3
Answer to the q.no.1(c)..............................................................................................................3
Answer to the q.no.2 (a).............................................................................................................4
Answer to the q.no.2 (b).............................................................................................................4
Answer to the q.no. 2 (c)............................................................................................................5
Answer to the q.no.2 (d).............................................................................................................5
Answer to the q.no.3 (a).............................................................................................................6
Answer to the q.no.3 (b).............................................................................................................6
Answer to the q.no. 3 (c)............................................................................................................6
Answer to the q. no. 4 (a)...........................................................................................................7
Answer to the q.no.4 (b).............................................................................................................7
Answer to the q.no.4 (c).............................................................................................................7
Answer to the q.no.4 (d).............................................................................................................7
Answer to the q.no. 5 (A)...........................................................................................................8
Answer to the q.no. 5 (B)...........................................................................................................9
Answer to the q.no. 6 (A)...........................................................................................................9
Answer to the q.no. 6 (B)...........................................................................................................9
References................................................................................................................................10
Document Page
2APPLIED QUANTITATIVE METHODS
Answer to the q.no. 1(a)
Table 1 Frequency, Relative Frequency, Cumulative Relative Frequency and Class
Midpoint on City Restaurant Meal Costs
Table 2 Frequency, Relative Frequency, Cumulative Relative Frequency and Class
Midpoint on Suburban Restaurant Meal Costs
Document Page
3APPLIED QUANTITATIVE METHODS
Answer to the q.no. 1 (b)
Figure 1 Histogram on City Restaurant Meal Costs
Figure 2 Histogram on Suburban Restaurant Meal Costs
Answer to the q.no.1(c)
The descriptive statistics on City Restaurant Meal Costs are as bellow
tabler-icon-diamond-filled.svg

Paraphrase This Document

Need a fresh take? Get an instant paraphrase of this document with our AI Paraphraser
Document Page
4APPLIED QUANTITATIVE METHODS
Mean = 52.2
Median = 52
Mode = 53
Similarly the descriptive statistics on Suburban Restaurant Meal Costs are as bellow
Mean = 48.04
Median = 47.5
Mode = 48
Answer to the q.no.2 (a)
The given data sheet is a population data. Because this data has been provided for all
the ten products on annual sales and annual advertising expenditure. A population define as
the all the elements of a data and the sample consist only some part of that.
Answer to the q.no.2 (b)
Annual Sales ($1000) ¿)^2
200 2.78
200 2.78
140 3802.78
280 6136.11
170 1002.78
160 1736.11
210 69.44
230 802.78
230 802.78
200 2.78
210 69.44
190 136.11
Table 3 Calculation for standard deviation
Document Page
5APPLIED QUANTITATIVE METHODS
Average (X ) = X
n
= 2420
12
= 201.67
Standard deviation = (X X )2
n
= 14566.67
12
= 36.39
Answer to the q.no. 2 (c)
The Inter Quartile Range on annual advertising expenditure = Q3Q1
= 82.5-50
= 32.5
The standard deviation on annual advertising expenditure = 26.78
The inter quartile range is more useful than standard deviation because IQR is a better
measure of spread. The standard deviation gives the spread data around the mean. In this
example IQR is larger than standard deviation. So this is verify the answer to the above
problem.
Answer to the q.no.2 (d)
The correlation coefficient between annual sales and annual advertising expenditure is
r = n ¿ ¿
Document Page
6APPLIED QUANTITATIVE METHODS
= 12 ( 170200 )( 850× 2420)
( 12 ( 68100722500 ) ) (12 ( 5026005856400 ) )
= -0.11
Answer to the q.no.3 (a)
The dependent variable (Y) = Annual sales
The independent variable (X) = Annual advertising expenditure
Because the sales always depends on the advertising expenditure.
Answer to the q.no.3 (b)
Table 4 calculation for regression
The regression equation is (Y) = a+ b*X
Y= -0.1542X+ 212.59
Answer to the q.no. 3 (c)
Coefficient of determination = (correlation coefficient) 2
tabler-icon-diamond-filled.svg

Paraphrase This Document

Need a fresh take? Get an instant paraphrase of this document with our AI Paraphraser
Document Page
7APPLIED QUANTITATIVE METHODS
= 0.0129
Answer to the q. no. 4 (a)
The probability that a player from Holmes OR receiving Grassroots training is = 82
110
= 0.75
Answer to the q.no.4 (b)
The probability that a player from External and be in scientific training = 45
67
= 0.67
Answer to the q.no.4 (c)
The probability that a player from homeless and receiving scientific training = = 28
110
= 0.25
Answer to the q.no.4 (d)
H0: Training is independent from recruitment.
H1: Training is not independent from recruitment
Where
oi , j= observed frequencies
Ei , j= expected frequencies
Degrees of freedom=(r-1) (c-1)
Document Page
8APPLIED QUANTITATIVE METHODS
Where r= number of rows
C= number of columns
Scientific Training Grassroots training Total
Recruitment from
Homeless 28 82 110
External Recruitment 45 22 67
Total 73 104 177
Table 5 Observe frequency
Scientific Training Grassroots training Total
Recruitment from
Homeless 45.36723 64.63277 110
External Recruitment 27.63277 39.36723 67
Total 73 104 177
Table 6 Expected frequency
Chi- square statistic = 6.82
Degrees of freedom = 1
P- Value = 0.009
Since the P-value is larger than the alpha value. So it is not significant. Therefore
there is a sufficient evidence at 5% level of significance to conclude that Training is
independent from recruitment.
Answer to the q.no. 5 (A)
Given that average Surfers Paradise apartment (μ) = 0.9
Standard deviation (σ) = 2.7
The probability that apartment will sell for over $1.5 million = P (X>1.5)
= P (Z> 0.222)
= 1- 0.59
Document Page
9APPLIED QUANTITATIVE METHODS
= 0.41
Answer to the q.no. 5 (B)
The probability that the apartment will sell for over $0.8 million but less than $0.9
million = P (0.8< X< 0.9)
= (0.48 < Z < 0.5)
= 0.015
Answer to the q.no. 6 (A)
Given that
Sample size (n) = 50
Sample Standard deviation (s) = 2.7
Sample mean (x) = 8.5
Population mean (μ) = 0.9
t =
Xμ
s
n
= 19.90
According to all the given data t –test has been preferred for test the problem.
Answer to the q.no. 6 (B)
To solving this problem single proportion t-test has been applied.
P1= 11
45
tabler-icon-diamond-filled.svg

Paraphrase This Document

Need a fresh take? Get an instant paraphrase of this document with our AI Paraphraser
Document Page
10APPLIED QUANTITATIVE METHODS
= 0.24
P0= 30
100
¿0.3
n = 45
Using central limit theorem the probability that 30% 0f the investors invest more than 1
million is
P (X> 1) = P Z > P1P0
¿ ¿ ¿ ¿
= P Z >0.8783
= P Z 0.8783
= 0.81
Document Page
11APPLIED QUANTITATIVE METHODS
References
Cameron, A.C. and Trivedi, P.K., 2013. Regression analysis of count data (Vol. 53).
Cambridge university press.
McHugh, M.L., 2013. The chi-square test of independence. Biochemia medica: Biochemia
medica, 23(2), pp.143-149.
chevron_up_icon
1 out of 12
circle_padding
hide_on_mobile
zoom_out_icon
[object Object]