Applied Research Design: Insurance Customer Survey

Verified

Added on  2022/09/12

|4
|2135
|21
Homework Assignment
AI Summary
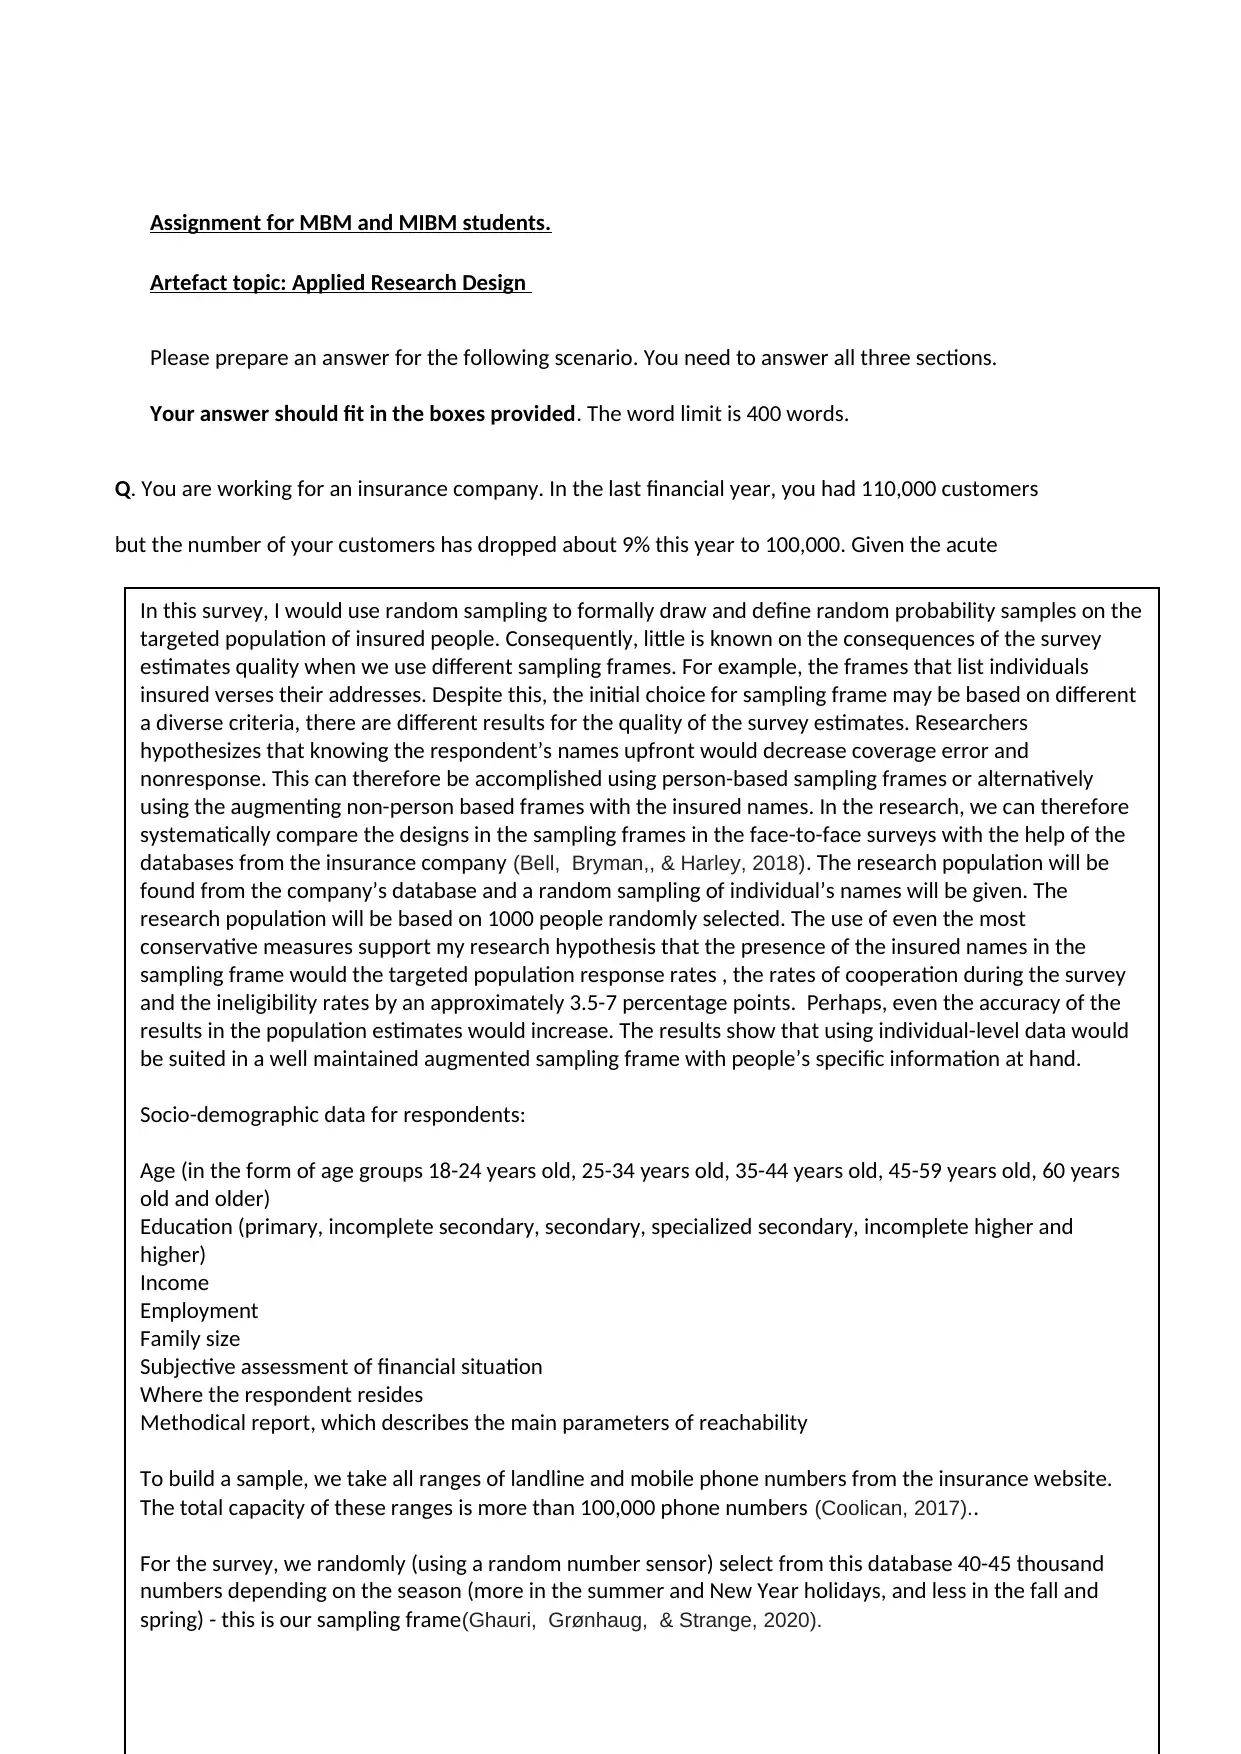
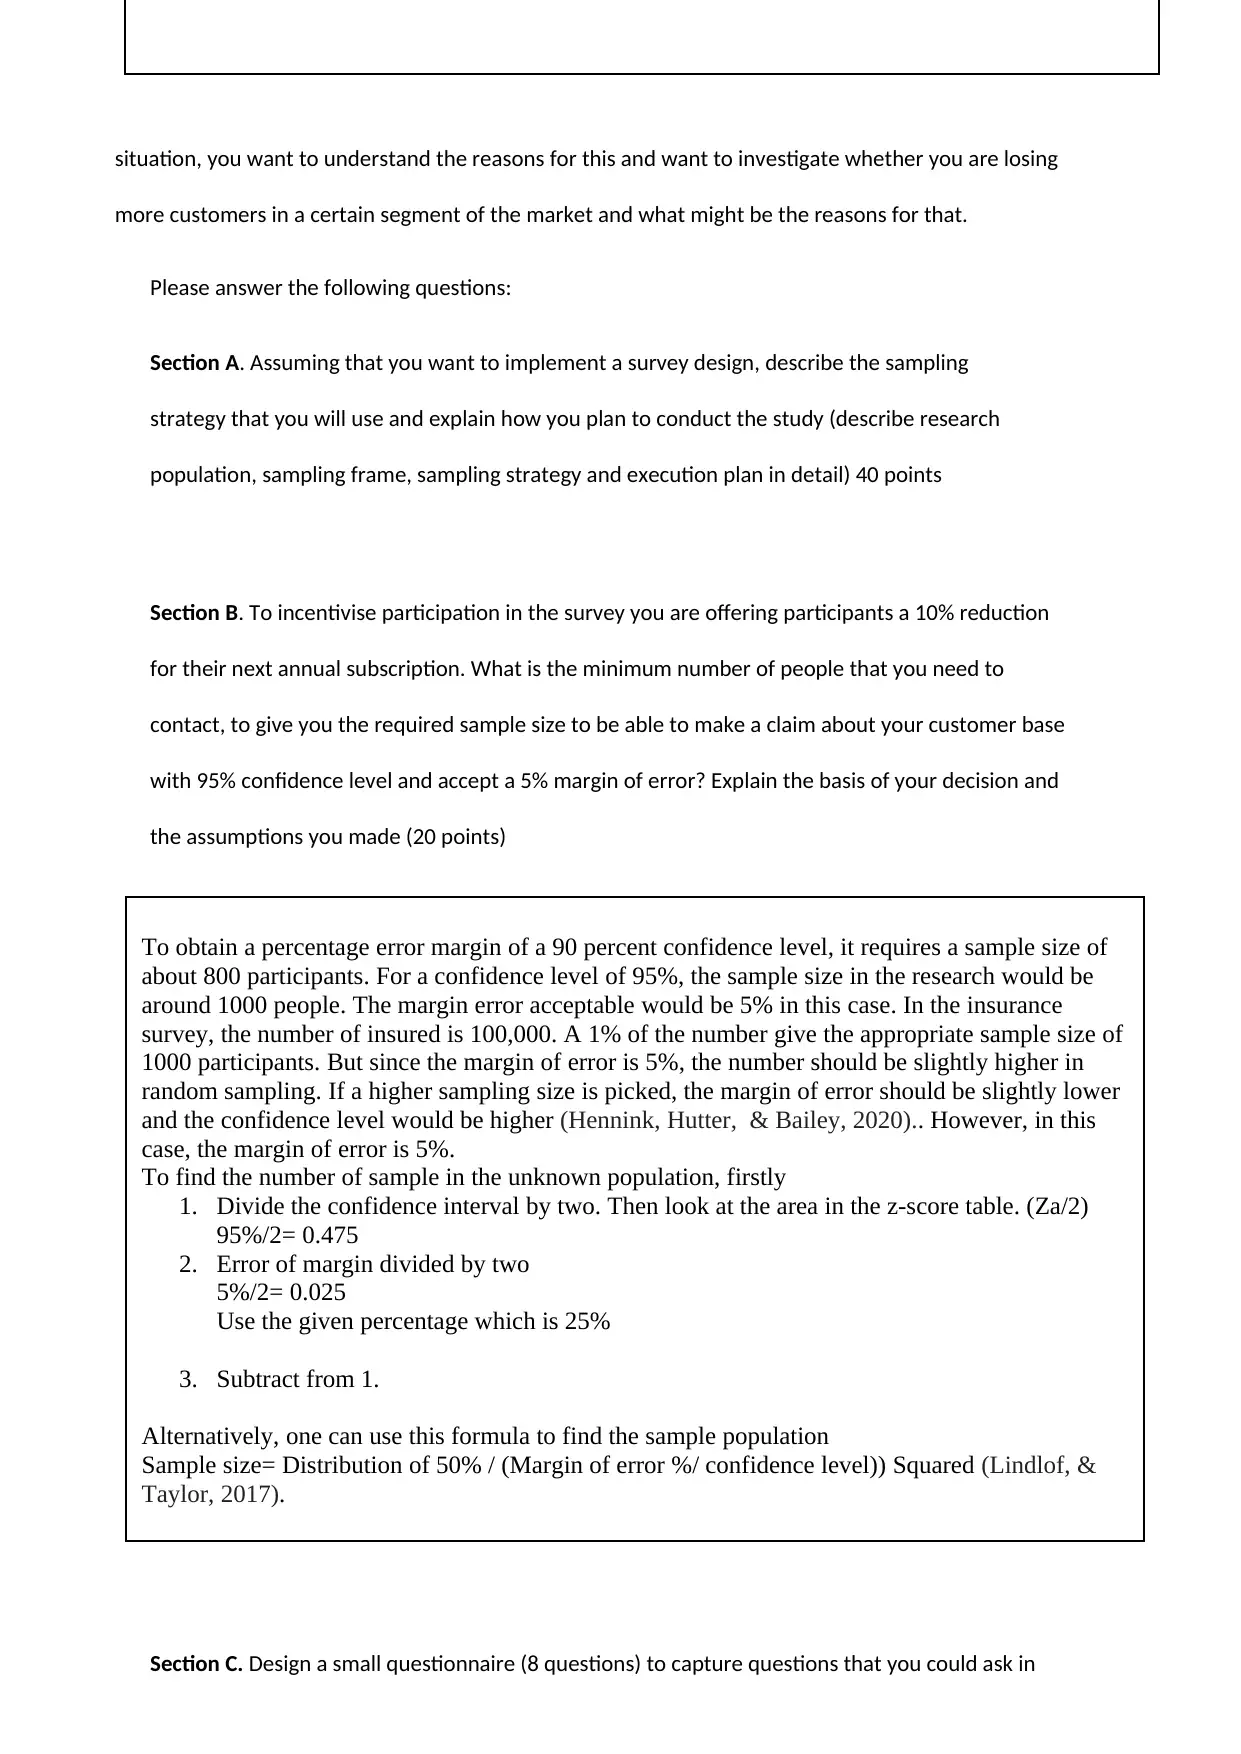
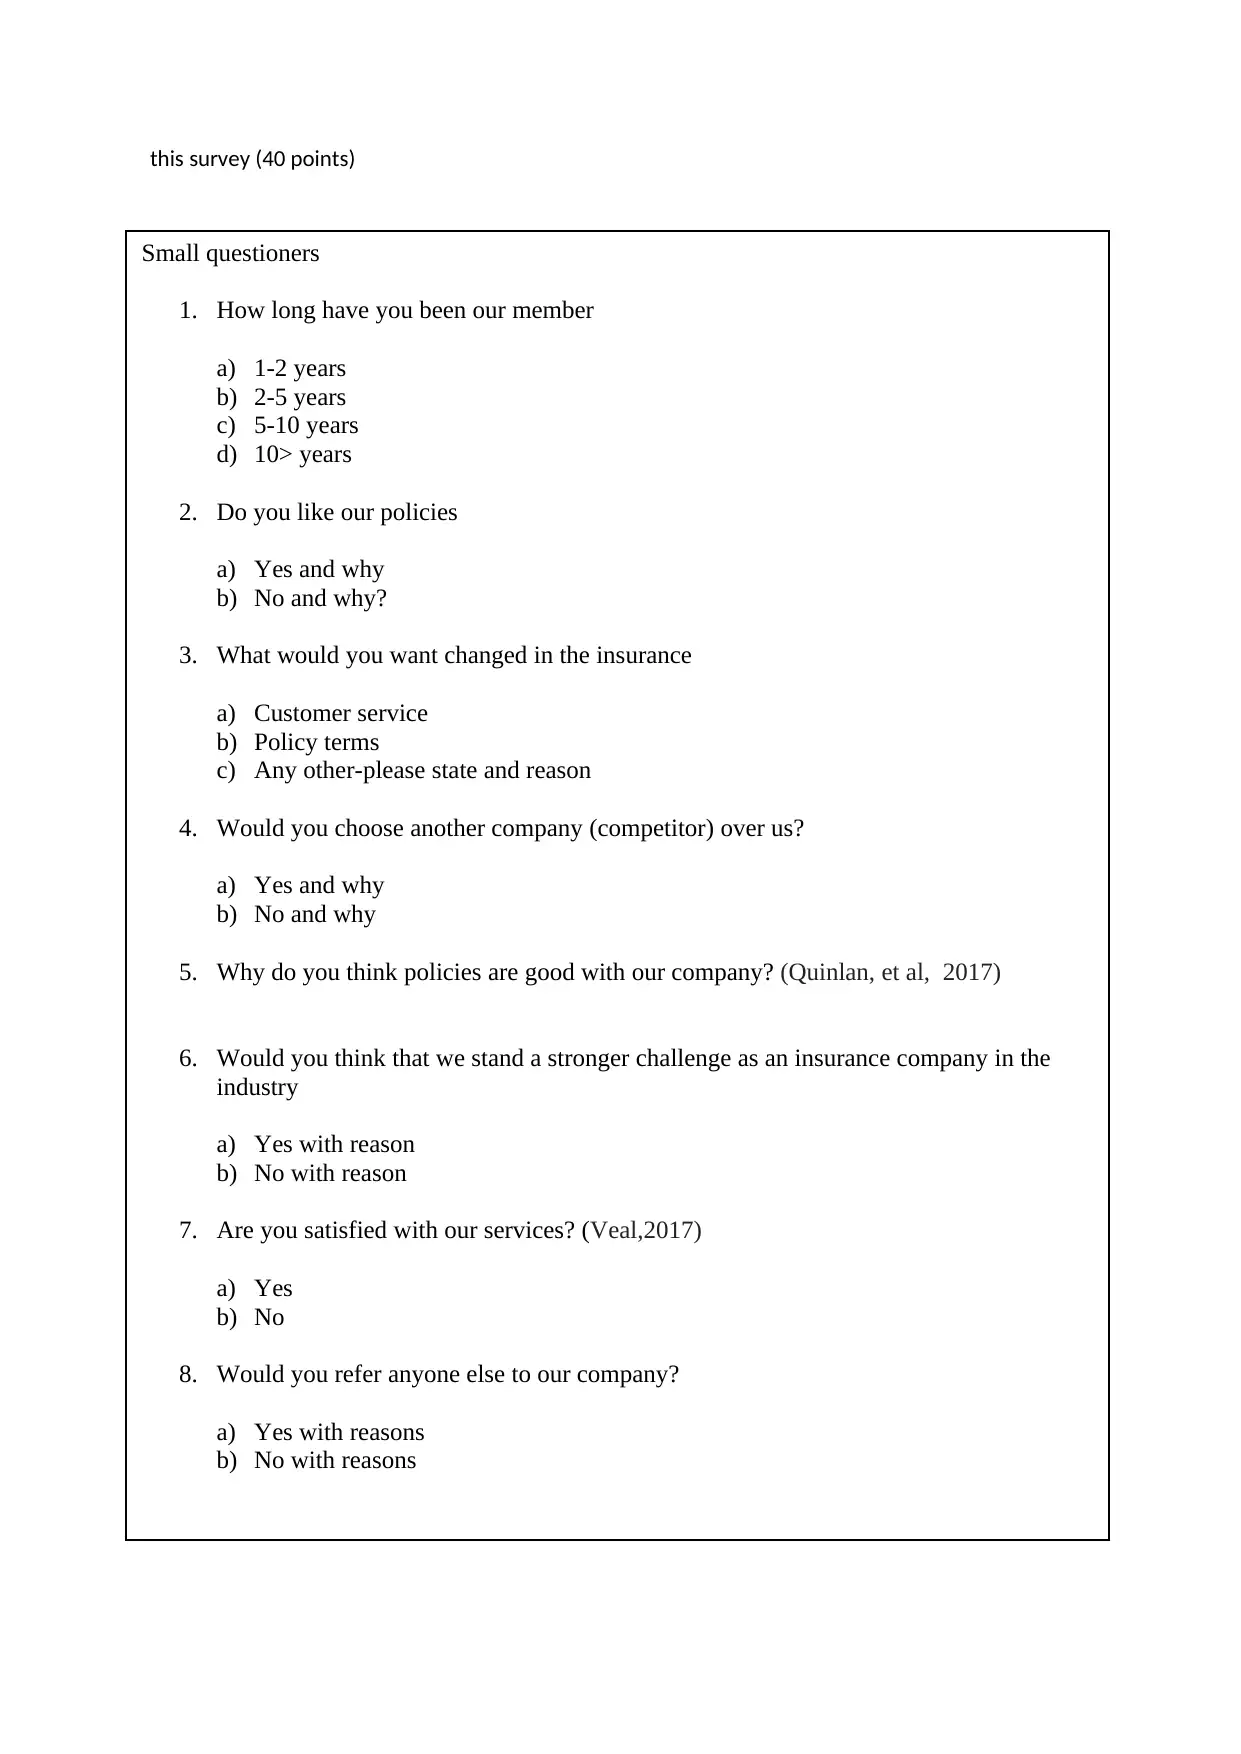
This assignment addresses a scenario where an insurance company experiences a customer decline and needs to understand the reasons. Section A details a comprehensive survey design, including the research population (all customers), sampling frame (customer database), and a stratified random sampling strategy to target specific customer segments. It outlines the execution plan, including data collection methods and analysis. Section B calculates the required sample size for a 95% confidence level with a 5% margin of error, explaining the assumptions made and the formula used, considering the population size. Section C presents a concise questionnaire with eight questions designed to gather customer feedback on various aspects, such as satisfaction, policy preferences, and reasons for potential departures, to identify areas for improvement and retention strategies. The solution references academic sources for methodological support.
Document Page
Assignment for MBM and MIBM students.
Artefact topic: Applied Research Design
Please prepare an answer for the following scenario. You need to answer all three sections.
Your answer should fit in the boxes provided. The word limit is 400 words.
Q. You are working for an insurance company. In the last financial year, you had 110,000 customers
but the number of your customers has dropped about 9% this year to 100,000. Given the acute
In this survey, I would use random sampling to formally draw and define random probability samples on the
targeted population of insured people. Consequently, little is known on the consequences of the survey
estimates quality when we use different sampling frames. For example, the frames that list individuals
insured verses their addresses. Despite this, the initial choice for sampling frame may be based on different
a diverse criteria, there are different results for the quality of the survey estimates. Researchers
hypothesizes that knowing the respondent’s names upfront would decrease coverage error and
nonresponse. This can therefore be accomplished using person-based sampling frames or alternatively
using the augmenting non-person based frames with the insured names. In the research, we can therefore
systematically compare the designs in the sampling frames in the face-to-face surveys with the help of the
databases from the insurance company (Bell, Bryman,, & Harley, 2018). The research population will be
found from the company’s database and a random sampling of individual’s names will be given. The
research population will be based on 1000 people randomly selected. The use of even the most
conservative measures support my research hypothesis that the presence of the insured names in the
sampling frame would the targeted population response rates , the rates of cooperation during the survey
and the ineligibility rates by an approximately 3.5-7 percentage points. Perhaps, even the accuracy of the
results in the population estimates would increase. The results show that using individual-level data would
be suited in a well maintained augmented sampling frame with people’s specific information at hand.
Socio-demographic data for respondents:
Age (in the form of age groups 18-24 years old, 25-34 years old, 35-44 years old, 45-59 years old, 60 years
old and older)
Education (primary, incomplete secondary, secondary, specialized secondary, incomplete higher and
higher)
Income
Employment
Family size
Subjective assessment of financial situation
Where the respondent resides
Methodical report, which describes the main parameters of reachability
To build a sample, we take all ranges of landline and mobile phone numbers from the insurance website.
The total capacity of these ranges is more than 100,000 phone numbers (Coolican, 2017)..
For the survey, we randomly (using a random number sensor) select from this database 40-45 thousand
numbers depending on the season (more in the summer and New Year holidays, and less in the fall and
spring) - this is our sampling frame(Ghauri, Grønhaug, & Strange, 2020).
tabler-icon-diamond-filled.svg

Paraphrase This Document

Need a fresh take? Get an instant paraphrase of this document with our AI Paraphraser
Document Page
situation, you want to understand the reasons for this and want to investigate whether you are losing
more customers in a certain segment of the market and what might be the reasons for that.
Please answer the following questions:
Section A. Assuming that you want to implement a survey design, describe the sampling
strategy that you will use and explain how you plan to conduct the study (describe research
population, sampling frame, sampling strategy and execution plan in detail) 40 points
Section B. To incentivise participation in the survey you are offering participants a 10% reduction
for their next annual subscription. What is the minimum number of people that you need to
contact, to give you the required sample size to be able to make a claim about your customer base
with 95% confidence level and accept a 5% margin of error? Explain the basis of your decision and
the assumptions you made (20 points)
Section C. Design a small questionnaire (8 questions) to capture questions that you could ask in
To obtain a percentage error margin of a 90 percent confidence level, it requires a sample size of
about 800 participants. For a confidence level of 95%, the sample size in the research would be
around 1000 people. The margin error acceptable would be 5% in this case. In the insurance
survey, the number of insured is 100,000. A 1% of the number give the appropriate sample size of
1000 participants. But since the margin of error is 5%, the number should be slightly higher in
random sampling. If a higher sampling size is picked, the margin of error should be slightly lower
and the confidence level would be higher (Hennink, Hutter, & Bailey, 2020).. However, in this
case, the margin of error is 5%.
To find the number of sample in the unknown population, firstly
1. Divide the confidence interval by two. Then look at the area in the z-score table. (Za/2)
95%/2= 0.475
2. Error of margin divided by two
5%/2= 0.025
Use the given percentage which is 25%
3. Subtract from 1.
Alternatively, one can use this formula to find the sample population
Sample size= Distribution of 50% / (Margin of error %/ confidence level)) Squared (Lindlof, &
Taylor, 2017).
Document Page
this survey (40 points)
Small questioners
1. How long have you been our member
a) 1-2 years
b) 2-5 years
c) 5-10 years
d) 10> years
2. Do you like our policies
a) Yes and why
b) No and why?
3. What would you want changed in the insurance
a) Customer service
b) Policy terms
c) Any other-please state and reason
4. Would you choose another company (competitor) over us?
a) Yes and why
b) No and why
5. Why do you think policies are good with our company? (Quinlan, et al, 2017)
6. Would you think that we stand a stronger challenge as an insurance company in the
industry
a) Yes with reason
b) No with reason
7. Are you satisfied with our services? (Veal,2017)
a) Yes
b) No
8. Would you refer anyone else to our company?
a) Yes with reasons
b) No with reasons
Document Page
References
Bell, E., Bryman, A., & Harley, B. (2018). Business research methods. Oxford university press.
Coolican, H. (2017). Research methods and statistics in psychology. Psychology Press.
Ghauri, P., Grønhaug, K., & Strange, R. (2020). Research methods in business studies. Cambridge
University Press.
Hennink, M., Hutter, I., & Bailey, A. (2020). Qualitative research methods. SAGE Publications Limited.
Lindlof, T. R., & Taylor, B. C. (2017). Qualitative communication research methods. Sage publications.
Quinlan, C., Babin, B., Carr, J., & Griffin, M. (2019). Business research methods. South Western Cengage.
Veal, A. J. (2017). Research methods for leisure and tourism. Pearson UK.
chevron_up_icon
1 out of 4
circle_padding
hide_on_mobile
zoom_out_icon
[object Object]