Solution: Applied Quantitative Methods Assignment - Statistics Focus

Verified

Added on  2021/06/18

|15
|786
|102
Homework Assignment
AI Summary
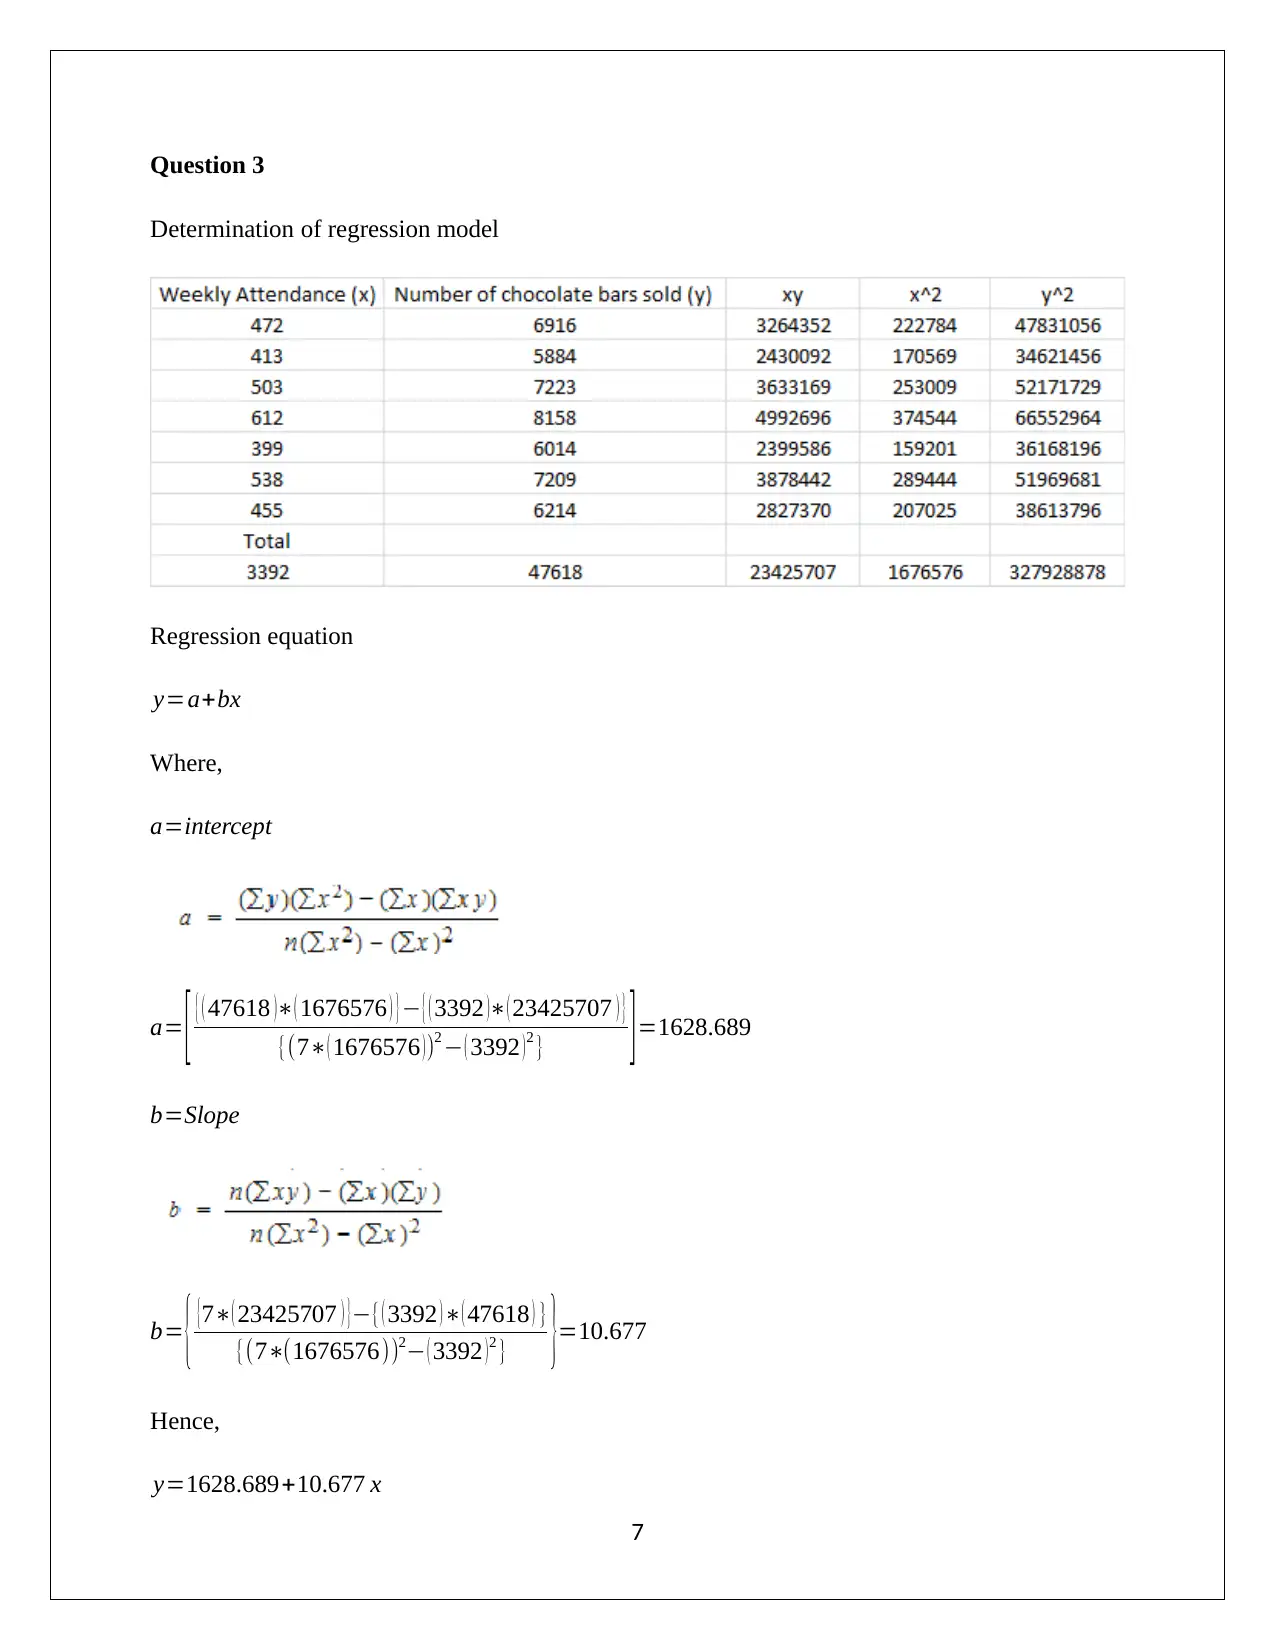
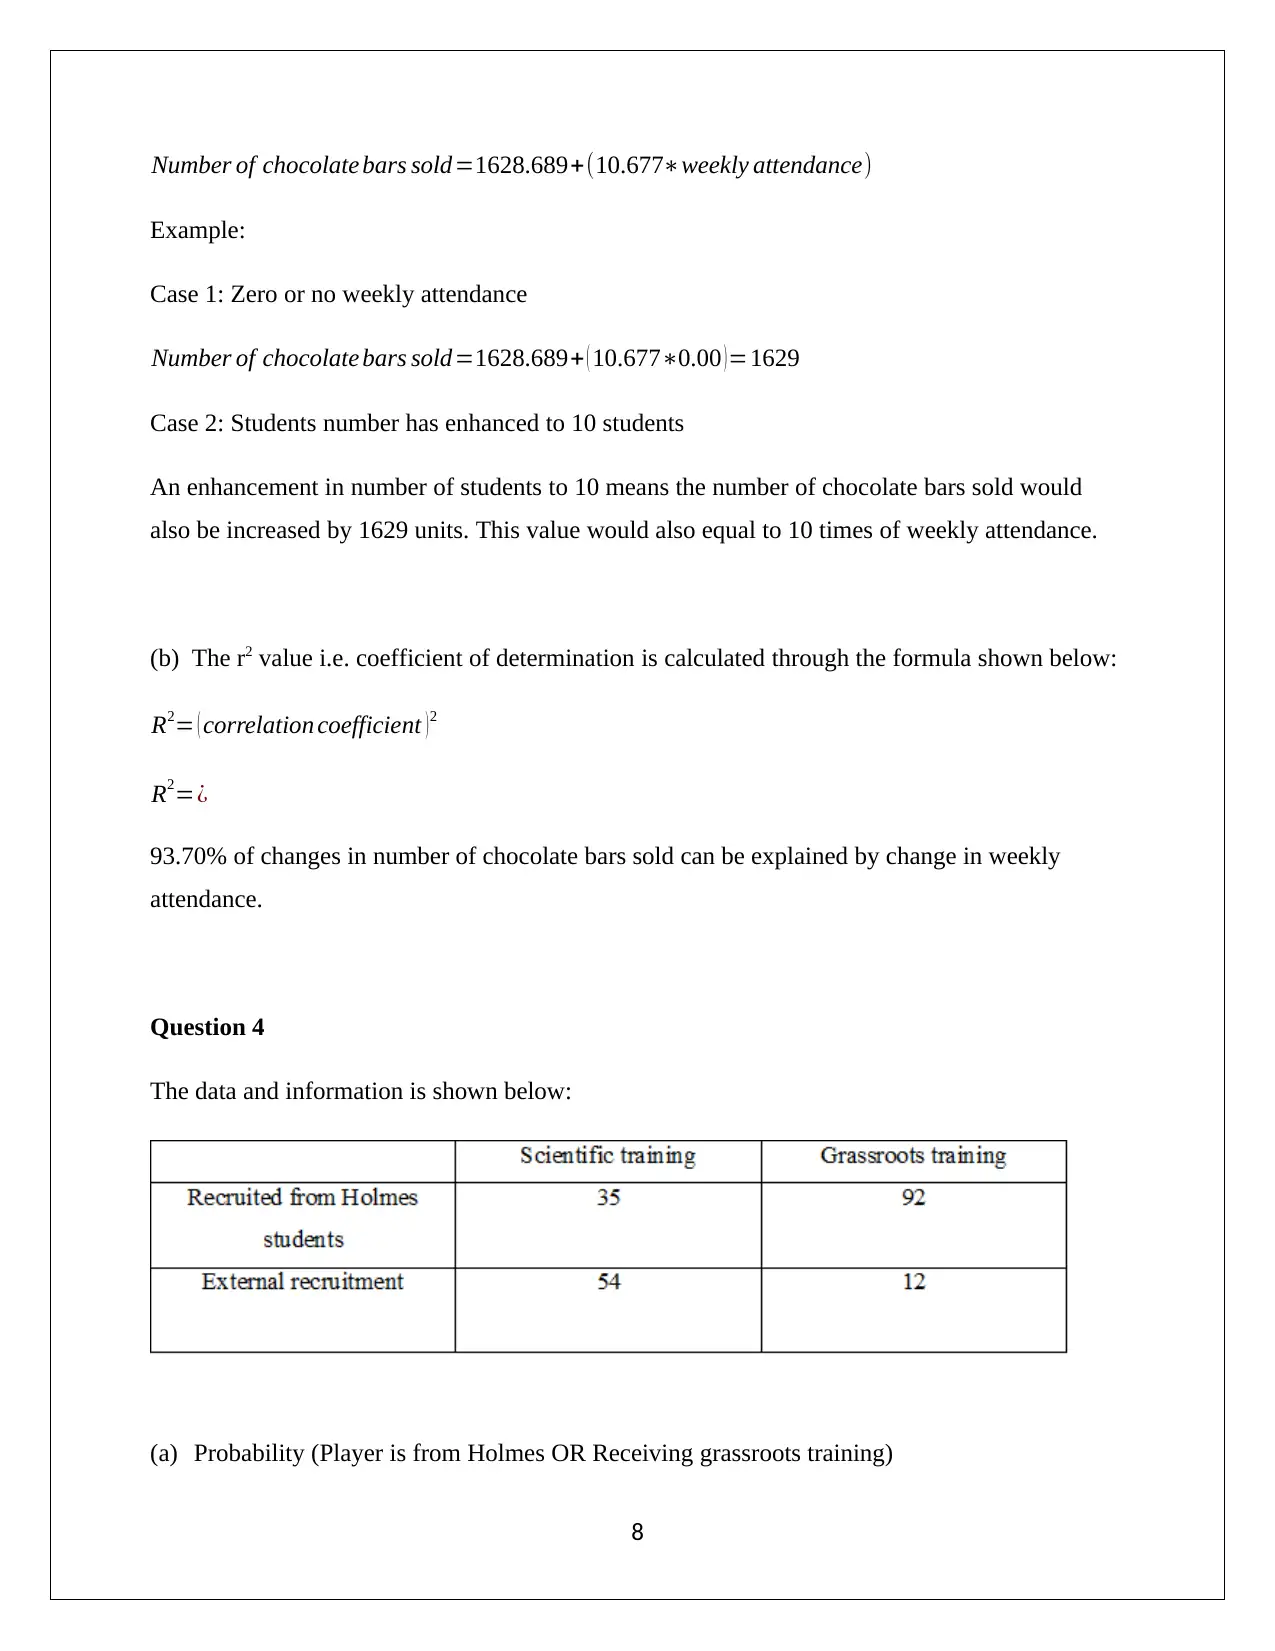
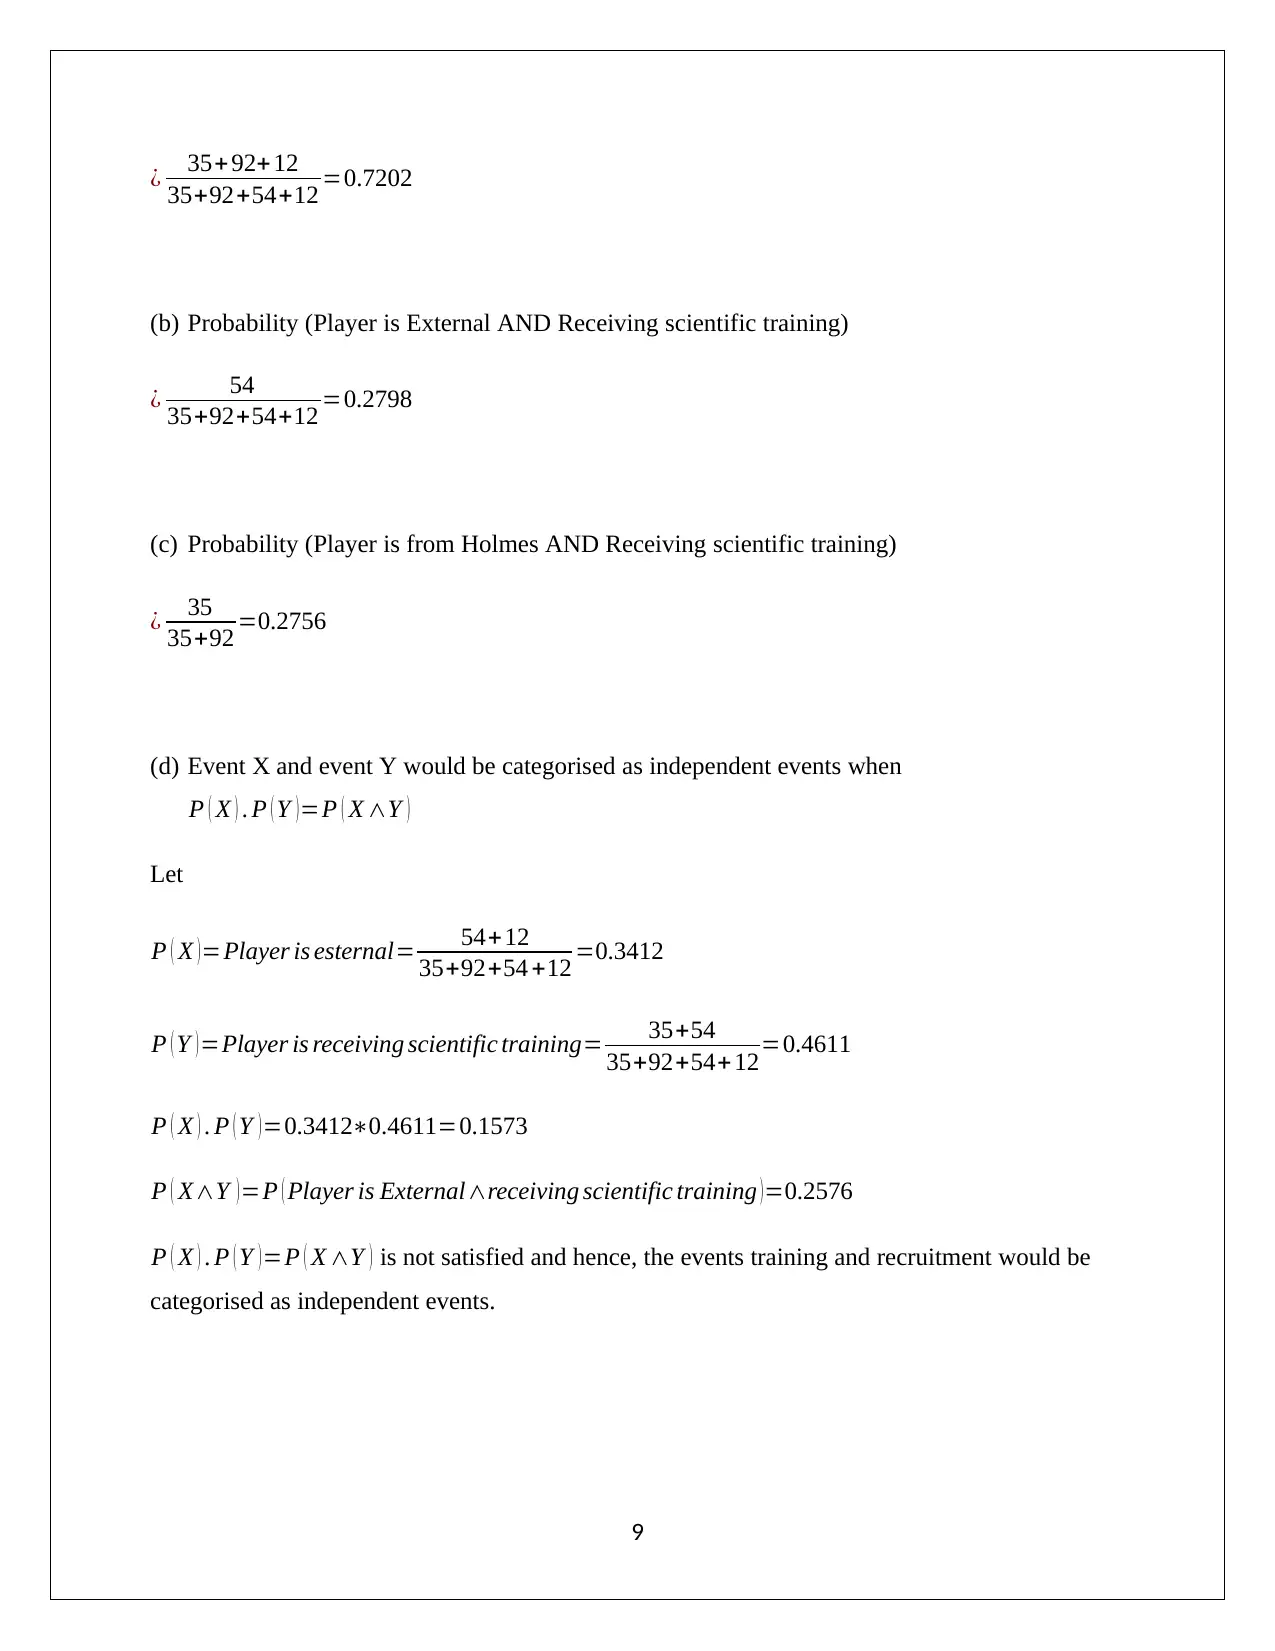
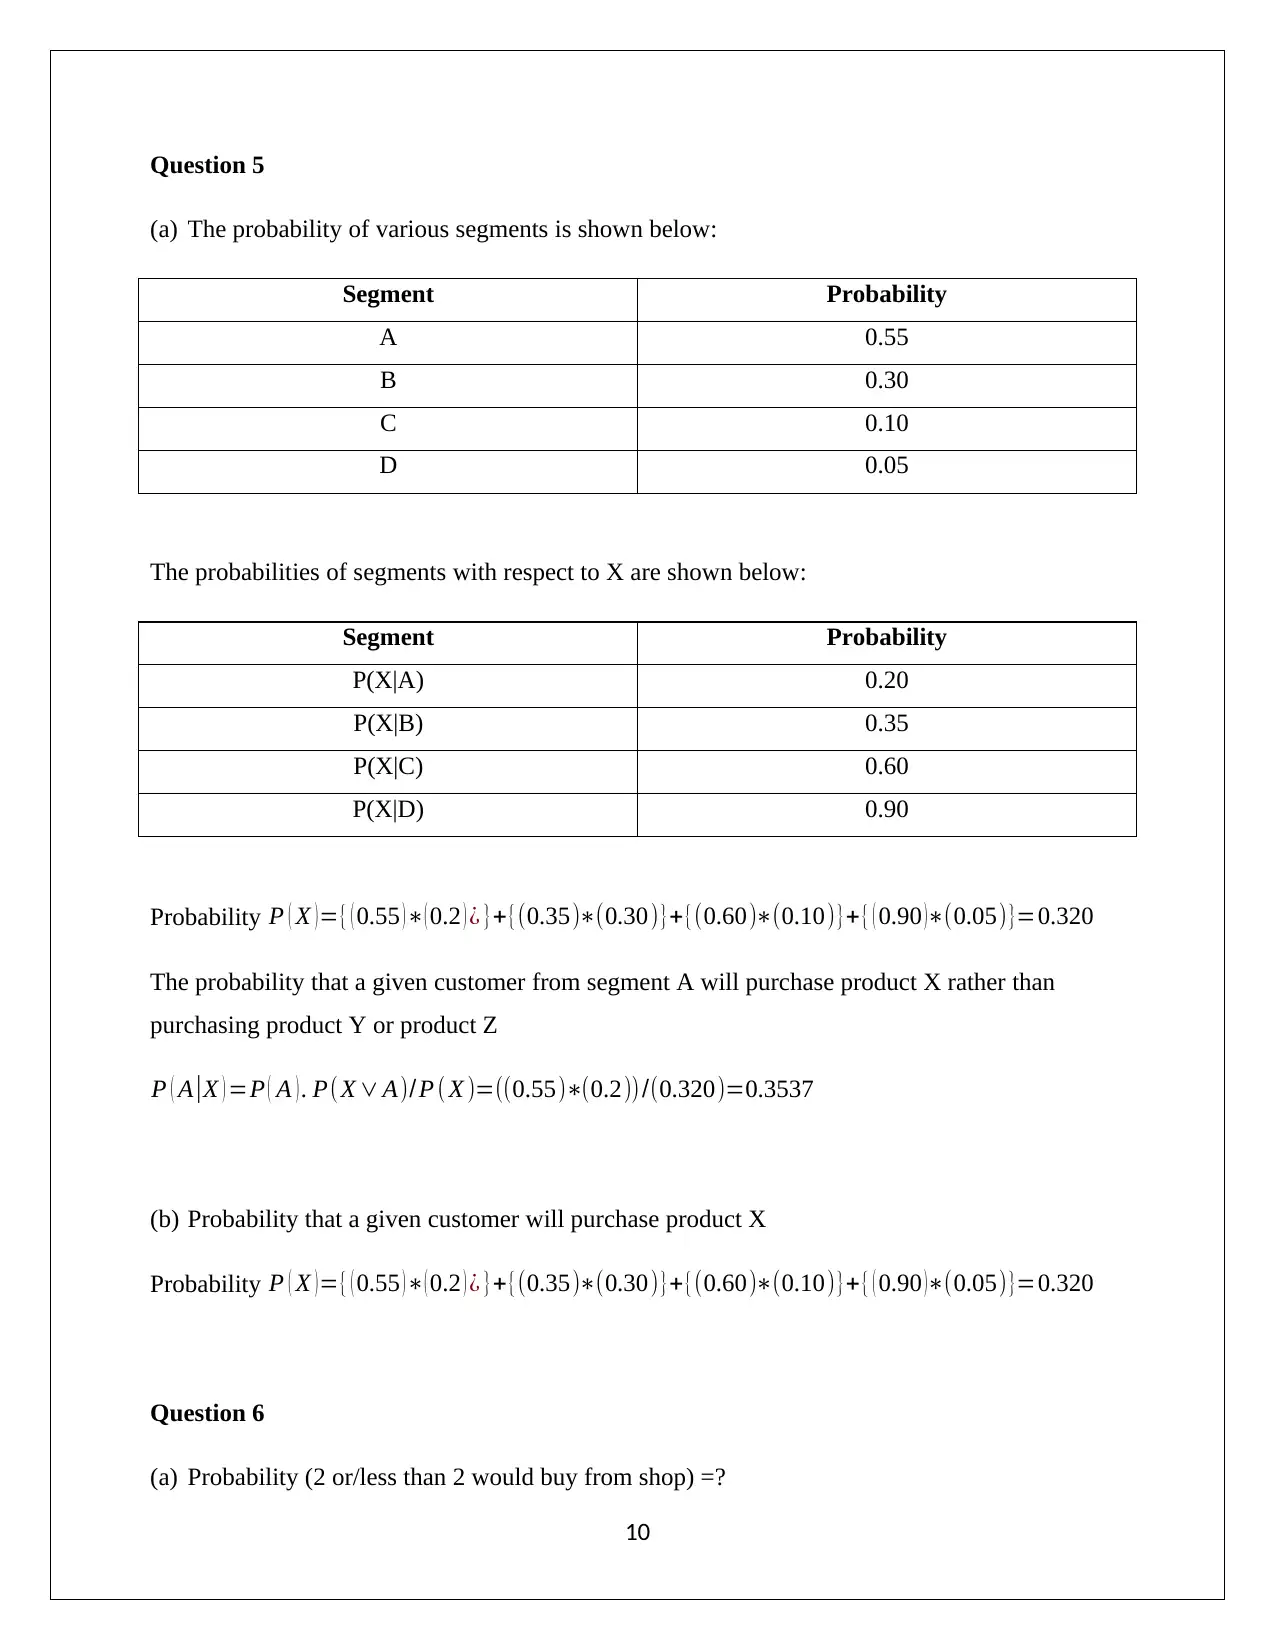
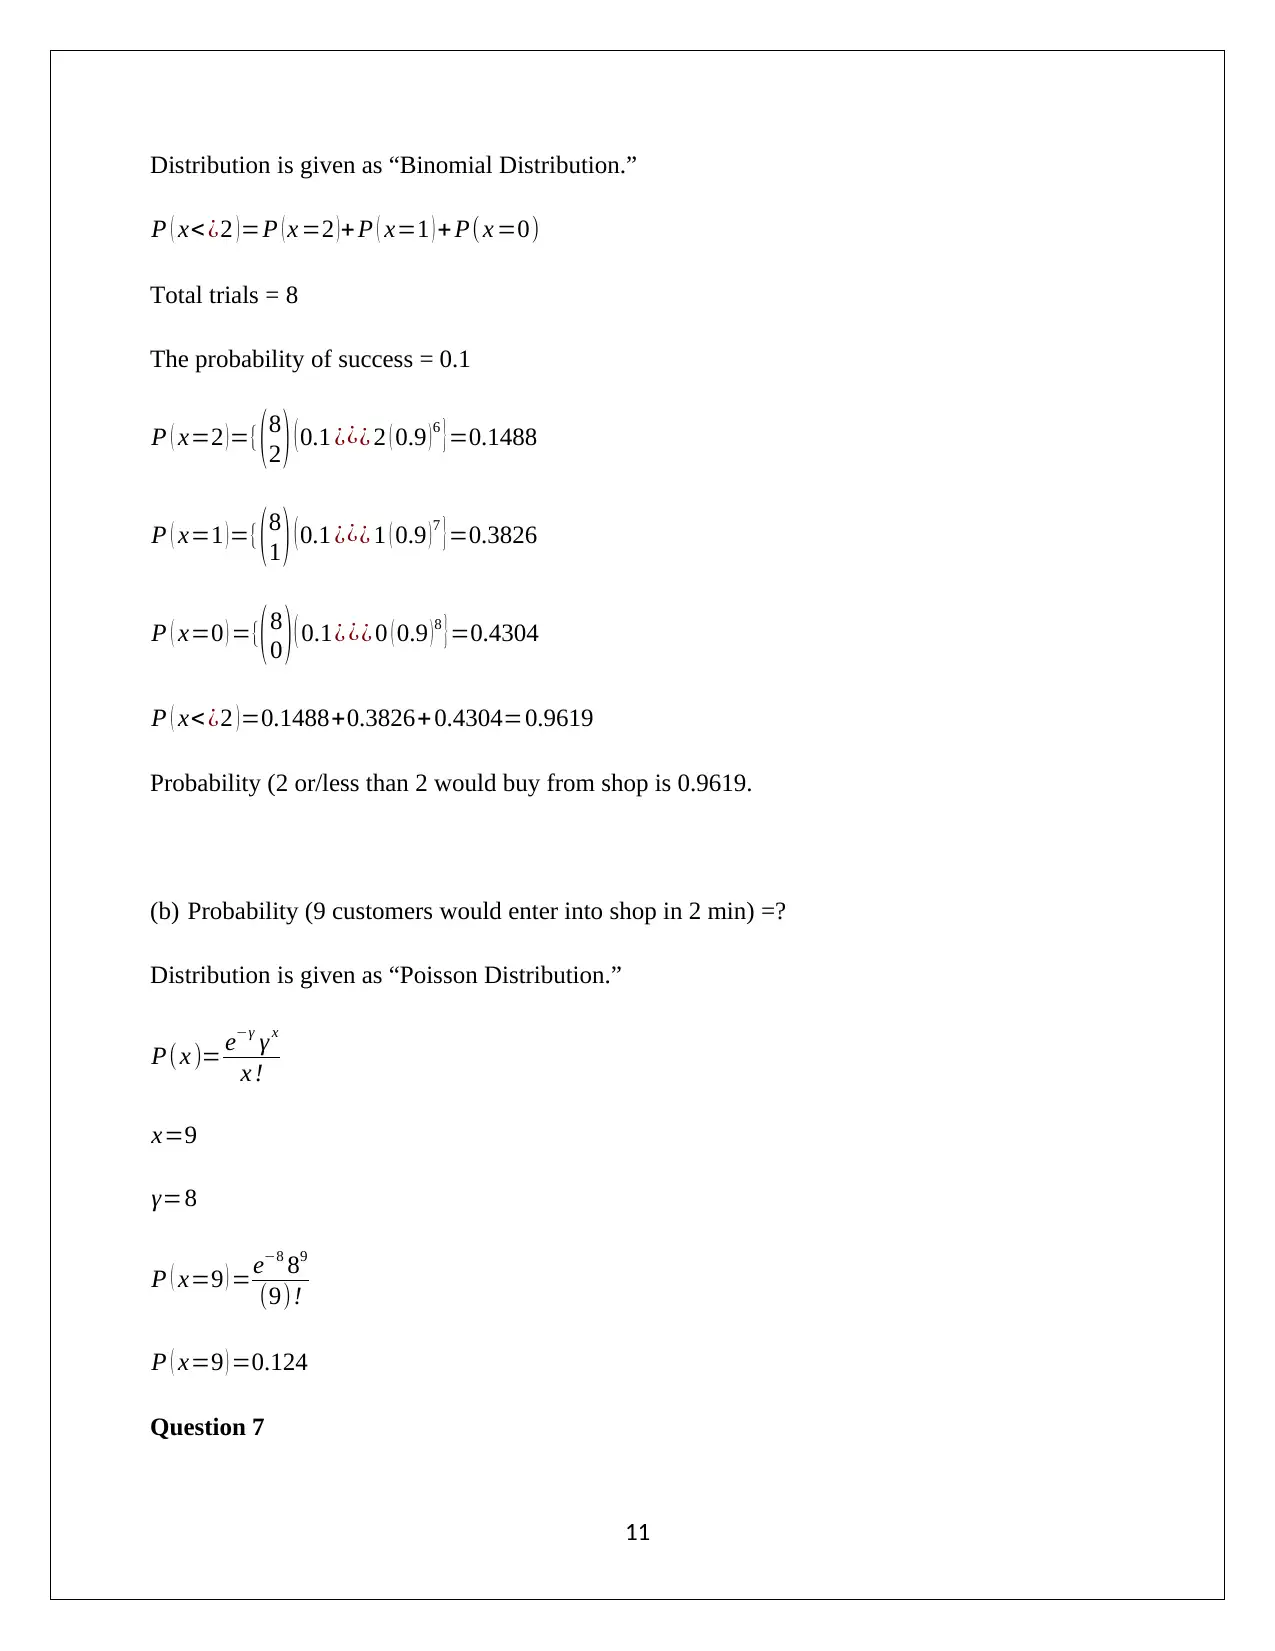
This document presents a comprehensive solution to an Applied Quantitative Methods (AQM) assignment, addressing various statistical concepts and techniques. The solution begins with descriptive statistics, including frequency distributions, histograms, and calculations of mean, median, and mode. It then delves into the analysis of sample data versus population data, calculating standard deviation and interquartile range. The assignment proceeds to explore regression models, determining regression equations and coefficients of determination to analyze relationships between variables. Probability concepts are examined through the analysis of independent events and the calculation of probabilities for various segments. Further, the solution covers binomial and Poisson distributions for calculating probabilities in specific scenarios. Finally, the assignment utilizes z-tests and the Central Limit Theorem to analyze data, including the proportion of samples and standard error, to determine the likelihood of events. This assignment provides a thorough understanding of statistical methods and their application in quantitative analysis.
Document Page
APPLIED QUANTITATIVE METHODS
Assignment
[Pick the date]
Student Name
tabler-icon-diamond-filled.svg

Paraphrase This Document

Need a fresh take? Get an instant paraphrase of this document with our AI Paraphraser
Document Page
Question 1
Summary Statistics and Graphs”
a. Frequency distribution (with number of classes =10)
b. Histogram
1
Document Page
(c) Computation of mean, median and mode
Sorted data set (smallest to largest)
2
Document Page
3
tabler-icon-diamond-filled.svg

Paraphrase This Document

Need a fresh take? Get an instant paraphrase of this document with our AI Paraphraser
Document Page
Mean
Sum = 62600
Sample size = 60
Mean = Sum / Sample size
Mean = 62600 / 60 = 1033.3
Sample size = Even Number = 60
Median= ( n
2 )+ ( n
2 +1 )
2
Median= ( 60
2 )+ ( 60
2 + 1)
2
Median=(30 th term)+(31 thterm)
2
Median= 467+733
2
Median=715
Highest frequency is for = 401
Mode = 401
Question 2
(a) The data in the given case is sample data and not population data. This becomes evident from
the observation that data provided only refers to the seven weeks and hence does not take
into consideration the complete time (i.e. all weeks) while the university is working.
Considering, the limited data chosen from the population, hence the given data corresponds
to sample.
4
Document Page
(b) For weekly attendance the standard deviation has been calculated below:
Mean
Sum = 3392
Sample size N = 7
Mean ( x ¿= Sum / Sample size
Mean ( x ¿= 3392 / 60 = 1033.3
Now,
Standard deviation of sample ¿ 1
N 1 ( xx)2= 1
71 ×( 32909.714)=74.06
(c) Inter quartile range for sample of number of chocolate bars sold
5
Document Page
Sorted data set (smallest to largest)
1st quartile = 25th percentile = {25*(7+1)/100}th value = 2nd value = 6014
3rd quartile = 75th percentile = {75*(7+1)/100}th value = 6th value = 7223
Inter quartile range = 3rd quartile - 1st quartile = 7223-6014 = 1209
(d) The r value i.e. coefficient of correlation is calculated through the formula shown below:
r =0.968
6
tabler-icon-diamond-filled.svg

Paraphrase This Document

Need a fresh take? Get an instant paraphrase of this document with our AI Paraphraser
Document Page
Question 3
Determination of regression model
Regression equation
y=a+bx
Where,
a=intercept
a= [ { ( 47618 )( 1676576 ) } { ( 3392 )( 23425707 ) }
{(7( 1676576 ) )2 ( 3392 ) 2 } ] =1628.689
b=Slope
b= { {7( 23425707 ) }{ ( 3392 ) ( 47618 ) }
{(7(1676576))2 ( 3392 ) 2 } }=10.677
Hence,
y=1628.689+10.677 x
7
Document Page
Number of chocolate bars sold=1628.689+(10.677weekly attendance)
Example:
Case 1: Zero or no weekly attendance
Number of chocolate bars sold=1628.689+ ( 10.6770.00 )=1629
Case 2: Students number has enhanced to 10 students
An enhancement in number of students to 10 means the number of chocolate bars sold would
also be increased by 1629 units. This value would also equal to 10 times of weekly attendance.
(b) The r2 value i.e. coefficient of determination is calculated through the formula shown below:
R2= ( correlation coefficient ) 2
R2=¿
93.70% of changes in number of chocolate bars sold can be explained by change in weekly
attendance.
Question 4
The data and information is shown below:
(a) Probability (Player is from Holmes OR Receiving grassroots training)
8
Document Page
¿ 35+92+ 12
35+92+54+12 =0.7202
(b) Probability (Player is External AND Receiving scientific training)
¿ 54
35+92+54+12 =0.2798
(c) Probability (Player is from Holmes AND Receiving scientific training)
¿ 35
35+92 =0.2756
(d) Event X and event Y would be categorised as independent events when
P ( X ) . P ( Y ) =P ( X Y )
Let
P ( X )=Player is esternal= 54+12
35+92+54 +12 =0.3412
P ( Y )=Player is receiving scientific training= 35+54
35+92+54+ 12=0.4611
P ( X ) . P ( Y )=0.34120.4611=0.1573
P ( XY ) =P ( Player is Externalreceiving scientific training ) =0.2576
P ( X ) . P ( Y ) =P ( X Y ) is not satisfied and hence, the events training and recruitment would be
categorised as independent events.
9
tabler-icon-diamond-filled.svg

Paraphrase This Document

Need a fresh take? Get an instant paraphrase of this document with our AI Paraphraser
Document Page
Question 5
(a) The probability of various segments is shown below:
Segment Probability
A 0.55
B 0.30
C 0.10
D 0.05
The probabilities of segments with respect to X are shown below:
Segment Probability
P(X|A) 0.20
P(X|B) 0.35
P(X|C) 0.60
P(X|D) 0.90
Probability P ( X ) ={ ( 0.55 ) ( 0.2 ) ¿ }+{(0.35)(0.30)}+{(0.60)(0.10)}+{ ( 0.90 )(0.05)}=0.320
The probability that a given customer from segment A will purchase product X rather than
purchasing product Y or product Z
P ( A |X ) =P ( A ) . P(X A)/P ( X )=((0.55)(0.2))/(0.320)=0.3537
(b) Probability that a given customer will purchase product X
Probability P ( X ) ={ ( 0.55 ) ( 0.2 ) ¿ }+{(0.35)(0.30)}+{(0.60)(0.10)}+{ ( 0.90 )(0.05)}=0.320
Question 6
(a) Probability (2 or/less than 2 would buy from shop) =?
10
Document Page
Distribution is given as “Binomial Distribution.”
P ( x< ¿2 ) =P ( x =2 ) + P ( x=1 ) + P( x =0)
Total trials = 8
The probability of success = 0.1
P ( x=2 )={(8
2 ) (0.1 ¿¿¿ 2 ( 0.9 )6 }=0.1488
P ( x=1 ) ={( 8
1 ) ( 0.1 ¿¿¿ 1 ( 0.9 ) 7 } =0.3826
P ( x=0 ) ={(8
0 ) ( 0.1¿ ¿¿ 0 ( 0.9 )8 }=0.4304
P ( x< ¿2 )=0.1488+0.3826+ 0.4304=0.9619
Probability (2 or/less than 2 would buy from shop is 0.9619.
(b) Probability (9 customers would enter into shop in 2 min) =?
Distribution is given as “Poisson Distribution.”
P(x )= eγ γ x
x !
x=9
γ=8
P ( x=9 ) =e8 89
(9)!
P ( x=9 ) =0.124
Question 7
11
chevron_up_icon
1 out of 15
circle_padding
hide_on_mobile
zoom_out_icon
[object Object]