User Experience, Purchase Intention & Satisfaction: AR Shopping Report
VerifiedAdded on 2023/01/09
|20
|3722
|85
Report
AI Summary
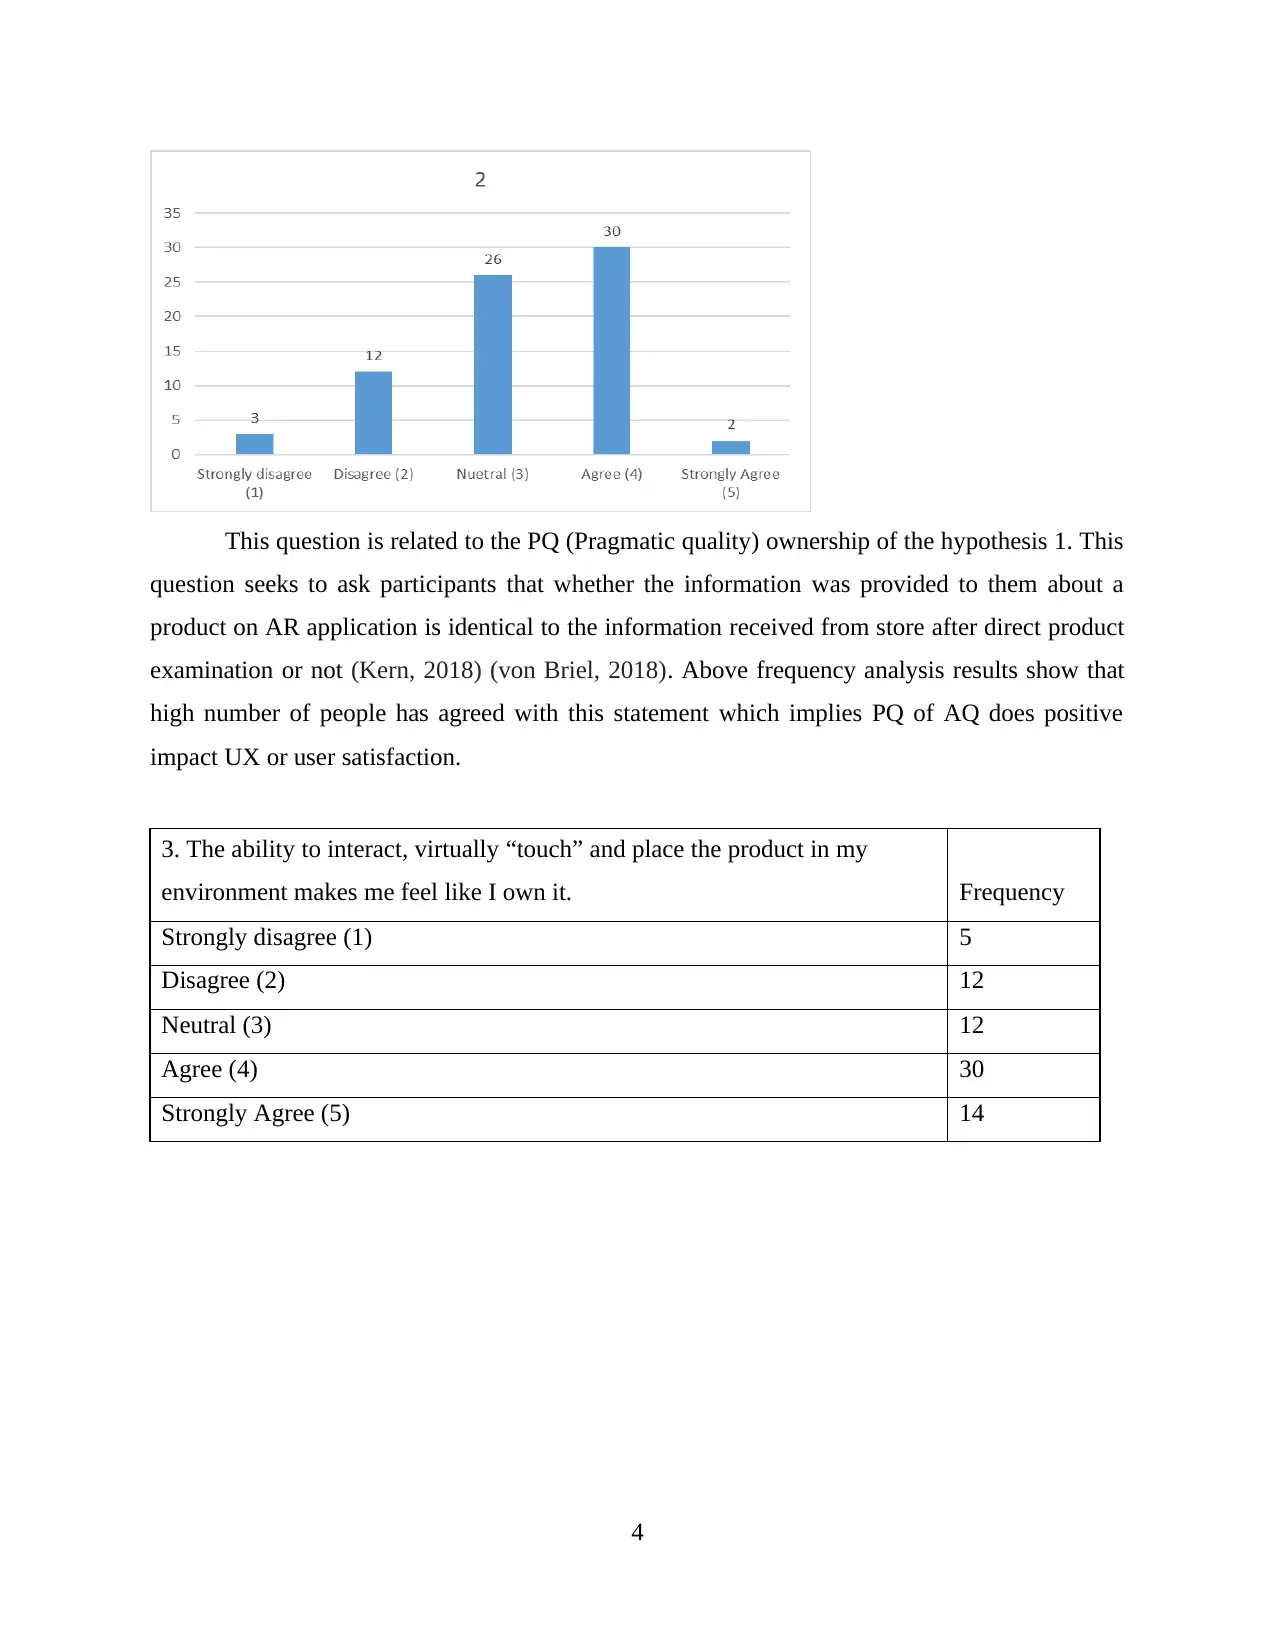
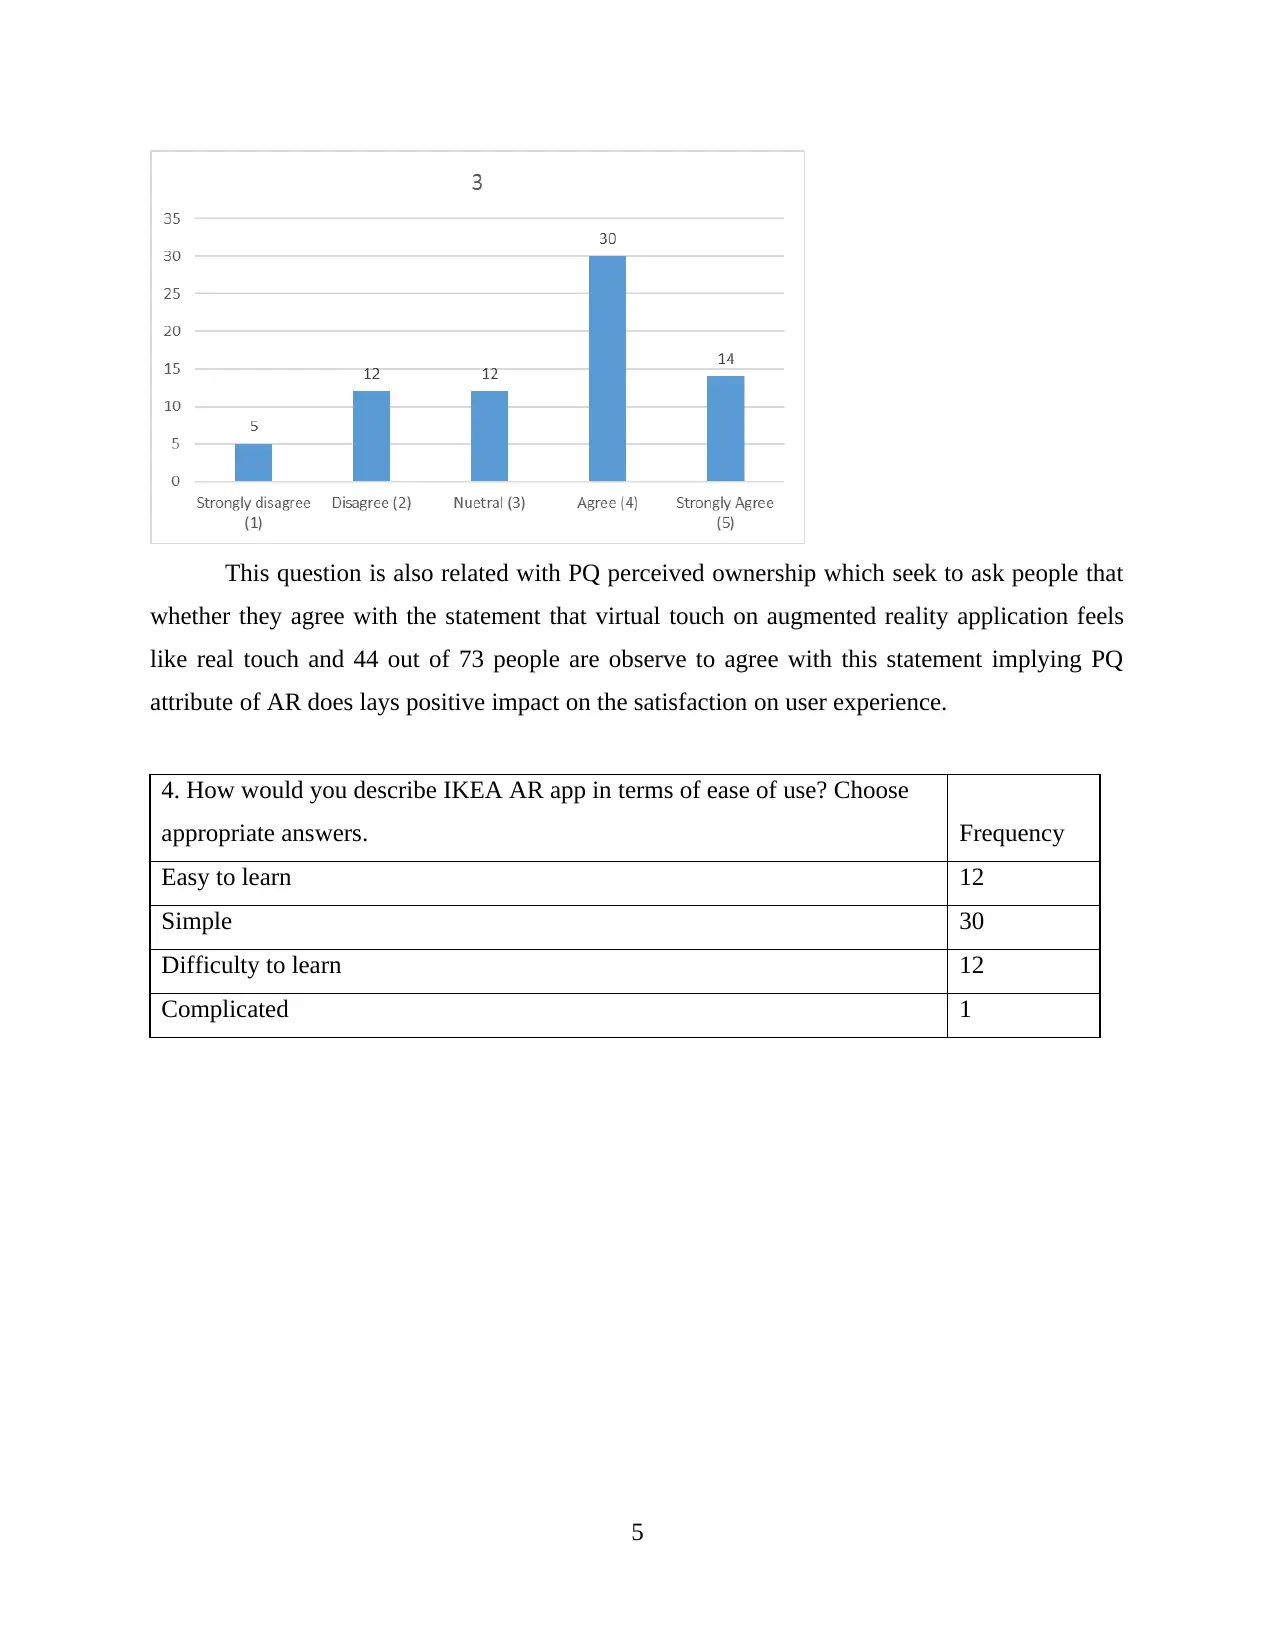
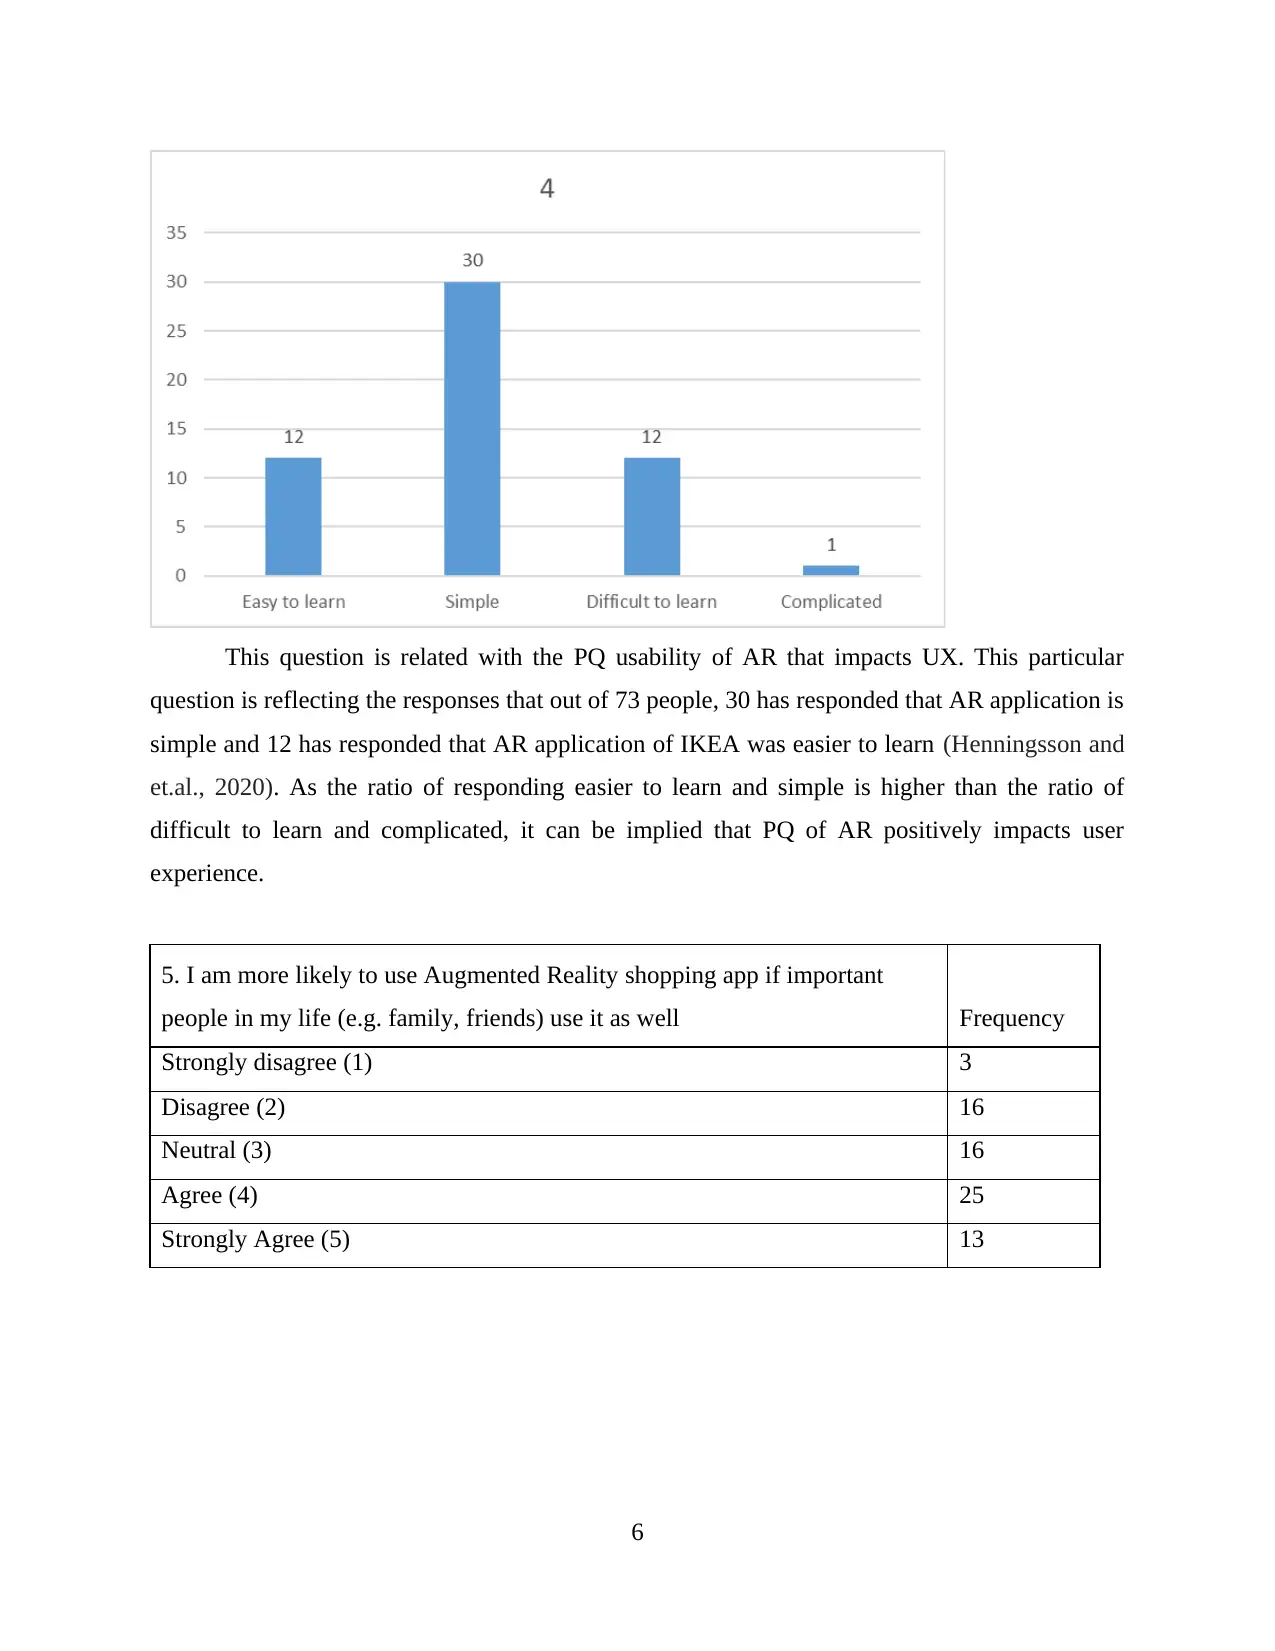
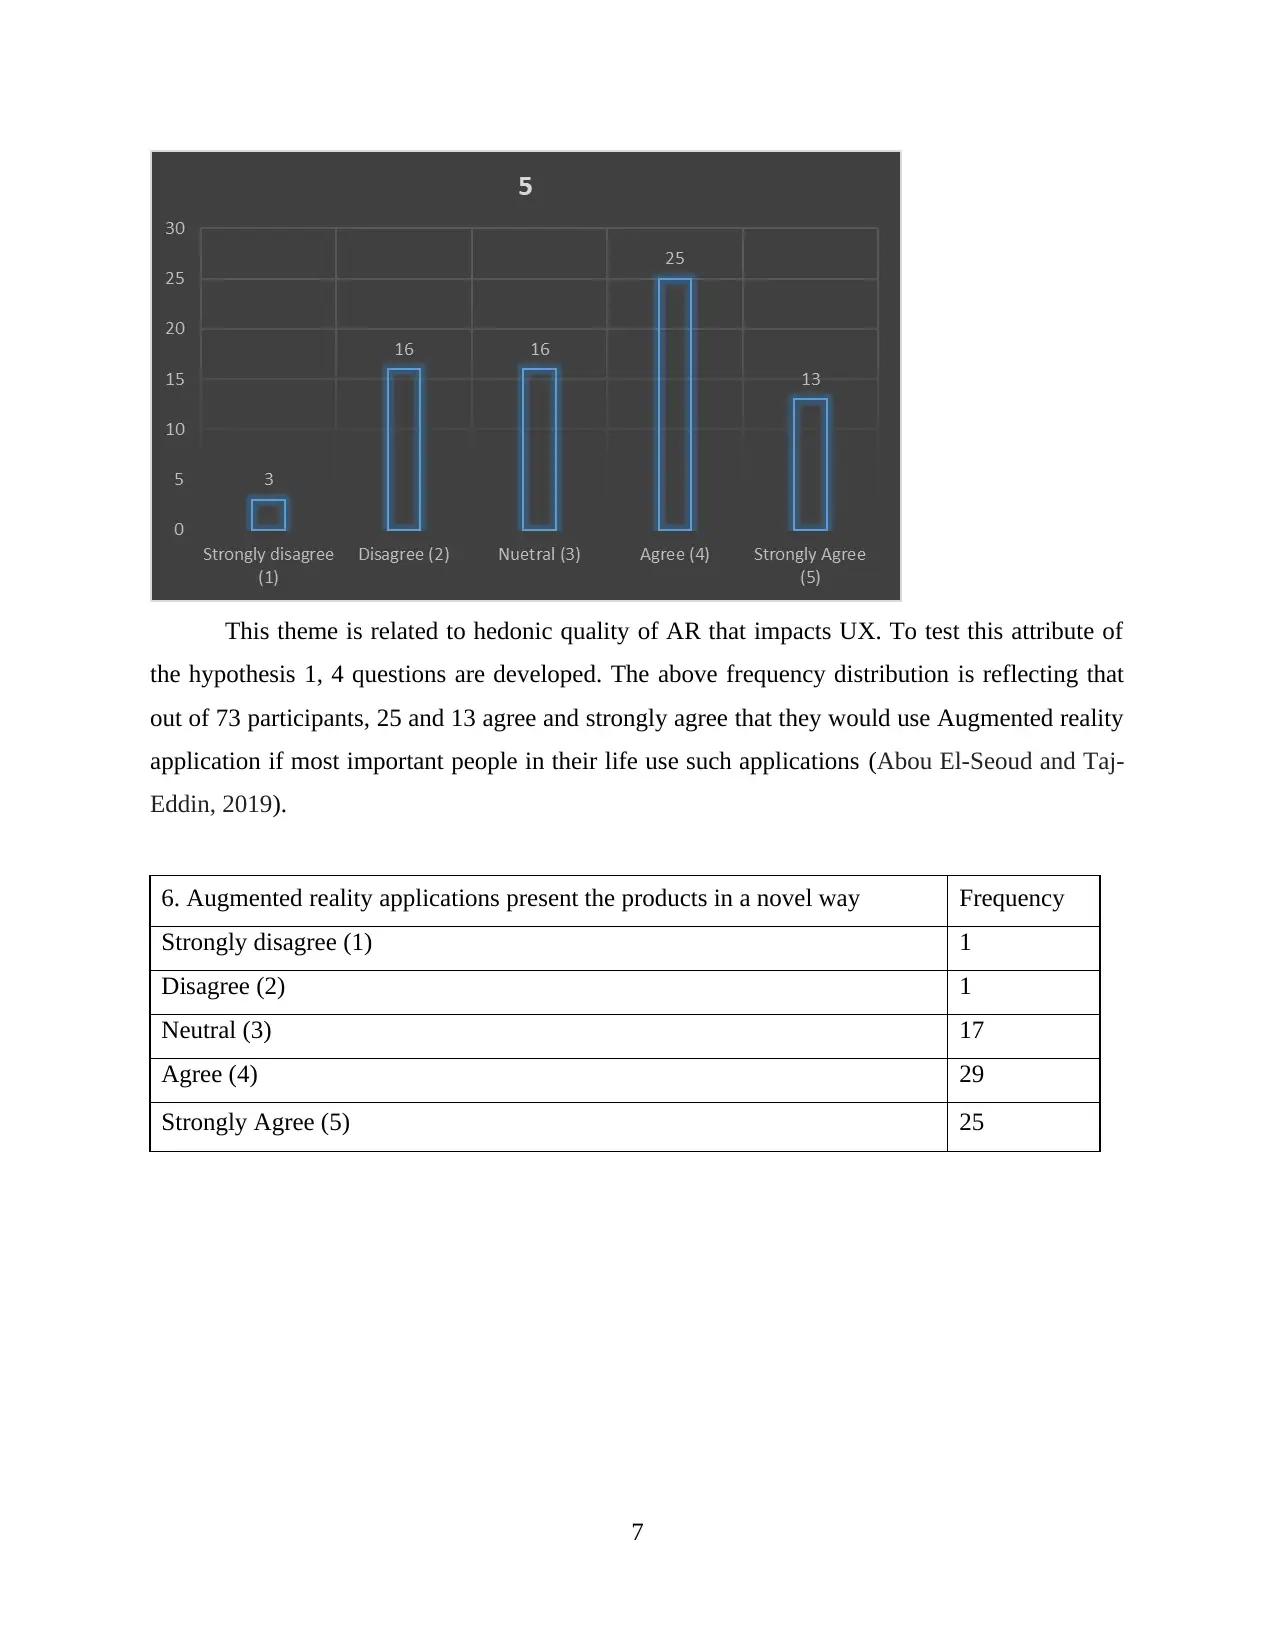
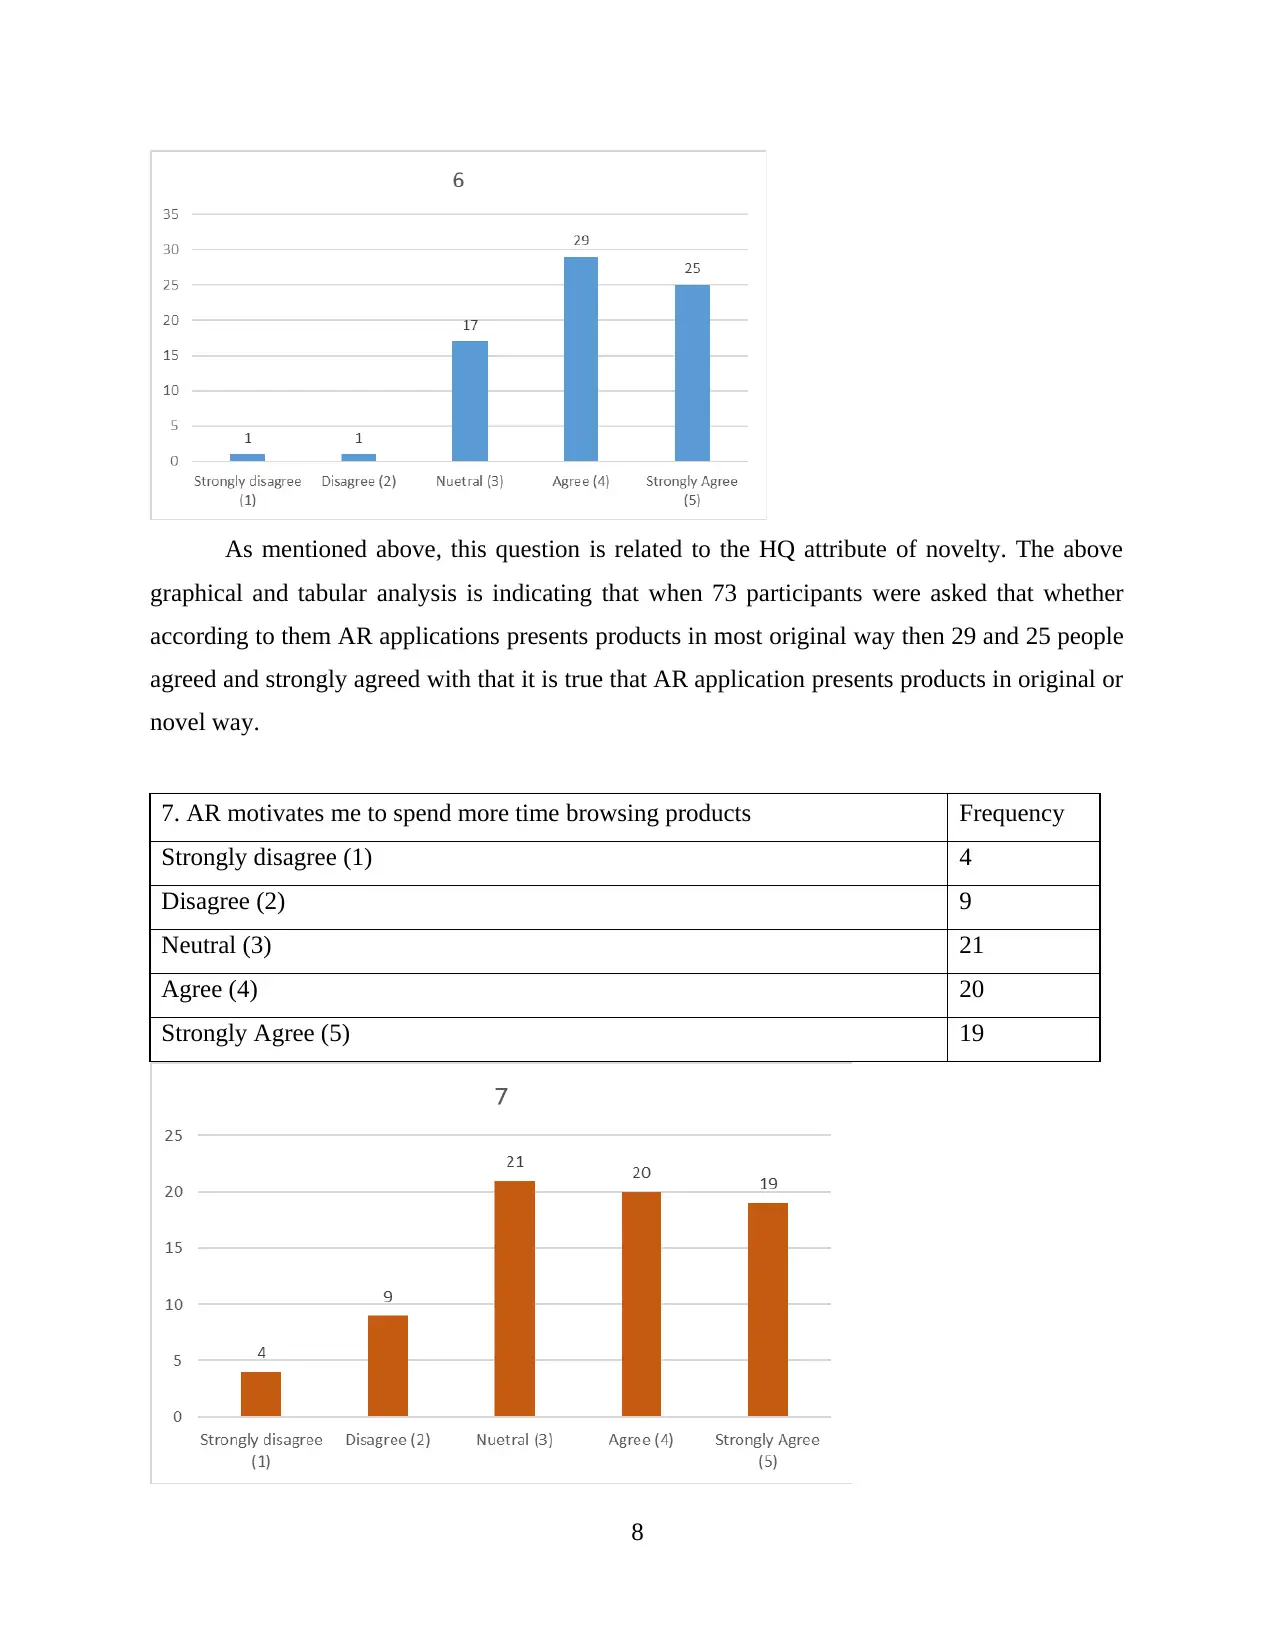
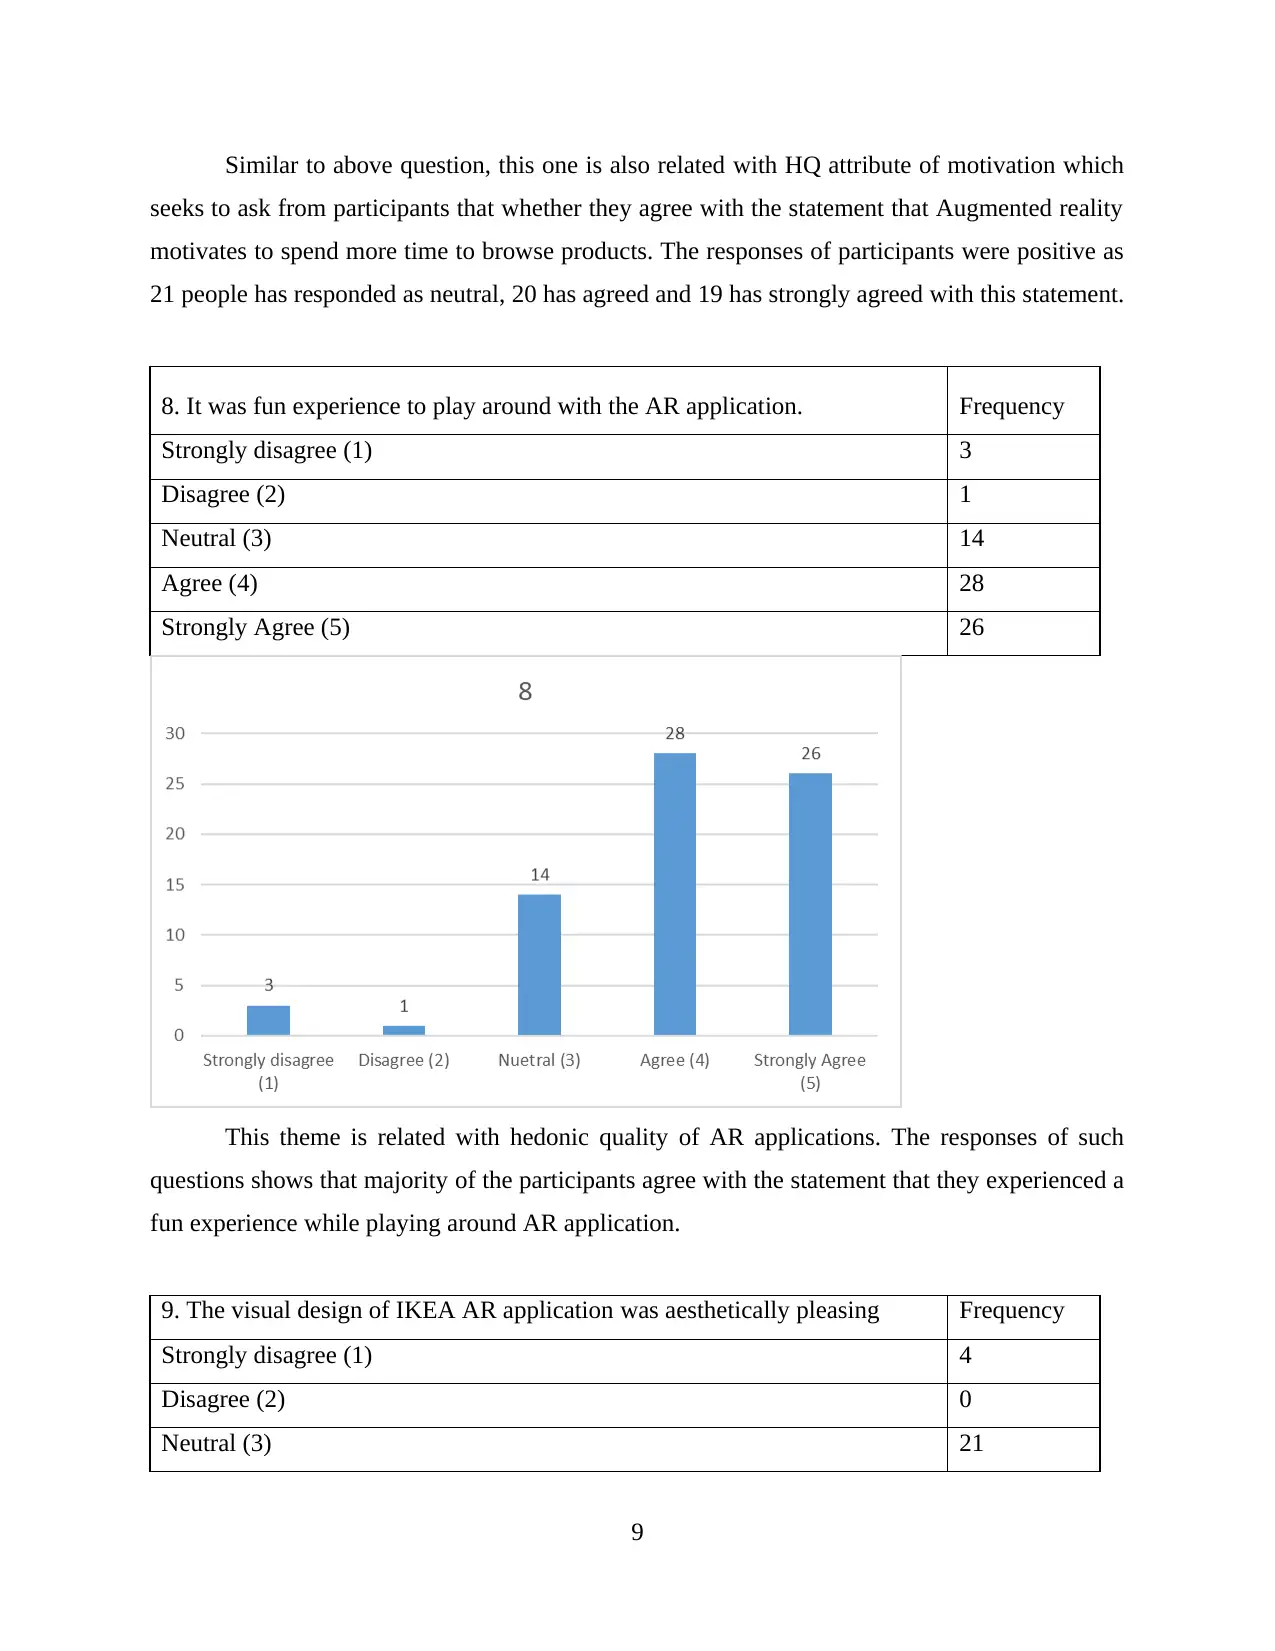
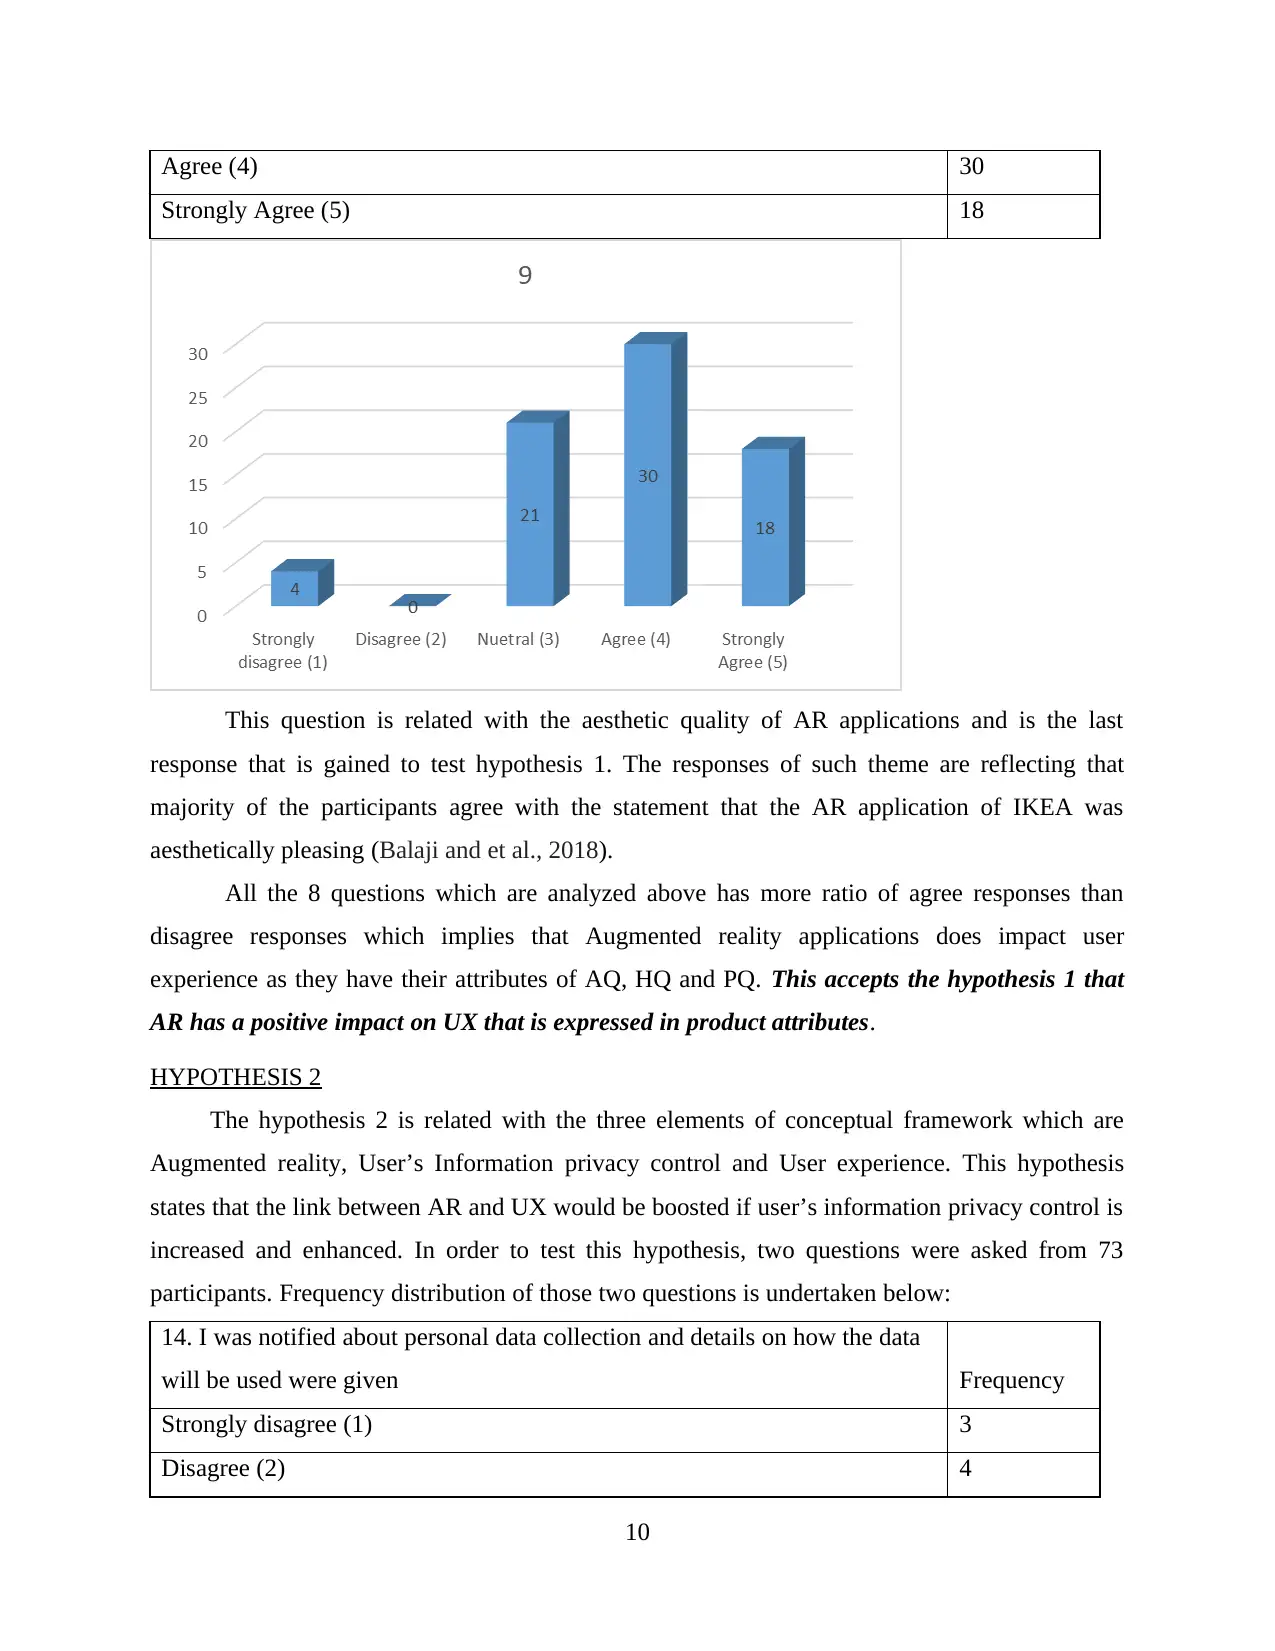
This report presents the findings of a study investigating the impact of augmented reality (AR) shopping applications on user experience (UX), willingness to buy, and user satisfaction. The research, based on a survey of 73 respondents, examines four hypotheses. The analysis utilizes frequency distribution to assess the influence of AR on UX, considering factors like pragmatic quality (PQ), hedonic quality (HQ), and aesthetic quality (AQ). The study explores the relationship between AR and UX, considering the role of user information privacy control. The results indicate a positive correlation between AR and UX, with enhanced privacy controls further boosting the user experience. The report also examines the impact of AR-enhanced UX on customer satisfaction. The findings are supported by the analysis of demographic data and participant responses to various questions related to their experiences with AR applications, particularly the IKEA AR app. The conclusion summarizes the key findings and offers recommendations based on the research outcomes.

Results
Paraphrase This Document
Need a fresh take? Get an instant paraphrase of this document with our AI Paraphraser

Contents
RESULTS / FINDINGS..................................................................................................................1
HYPOTHESIS 1..........................................................................................................................2
HYPOTHESIS 2........................................................................................................................10
HYPOTHESIS 3........................................................................................................................12
HYPOTHESIS 4........................................................................................................................14
RECOMMENDATION.................................................................................................................16
CONCLUSION..............................................................................................................................17
REFERENCES..............................................................................................................................18

RESULTS / FINDINGS
In this section of results and findings, the data collected will be analysed in order to achieve
the research aim of “To identify how augmented reality shopping applications impact the user
experience, willingness to buy and user satisfaction”. For the achievement of this aim, four
hypotheses were devised which will be tested in this section (Park and Yoo, 2020). It must be
noted that each hypothesis is intended to be tested using the questions which were asked from 73
respondents. The technique of analysis which is used in this section is frequency distribution.
Demographic information:
Before testing the hypothesis, it is important to analyse the respondents who has participated
in the study. For this, two questions in the questionnaire were related to demographic data of
participants which is gender and age.
What is your gender? Frequency
Female 49
Male 23
Prefer not to say 1
From the above frequency distribution, it can be seen that out of 73 participants, 49 were
females, 23 were males and 1 participant preferred not to reveal their gender identity. As the
percentage of females in this study is higher than males, there is a high possibility that the
responses are gender biased.
What is your age? Frequency
18 - 24 27
1
⊘ This is a preview!⊘
Do you want full access?
Subscribe today to unlock all pages.

Trusted by 1+ million students worldwide

25 - 34 34
35 - 44 8
45 - 54 1
55+ 3
Above analysis of frequency distribution and graphical analysis is related to age
information of 73 participants of this study. This analysis helps in identify that out of 73
participants, 27 are aged between 18 to 24, 34 are aged between 25 to 34 and rest are aged
between 35 and above. This provides a clarity that the most of the participants of this study are
young people and by including young participants, a study on augmented reality is ensured to be
effective.
HYPOTHESIS 1
After analyzing the demographic information of the participants, it is now important that
hypotheses of this research are tested. In order to test the first hypothesis which states AR has
positive effect on UX which is expressed in product attributes such as PQ, HQ, HQ simulation
and AQ (Romano, Sands and Pallant, 2020), its related questions will be analyzed with
frequency distribution below:
1: I have used AR application to purchase products (e.g. furniture,
sunglasses, clothing, jewelry) in the past Frequency
Yes 42
No 31
2
Paraphrase This Document
Need a fresh take? Get an instant paraphrase of this document with our AI Paraphraser

The first question which has been asked from the participants has been asked to gain a
general understanding that whether they have used augmented reality for purchasing products or
not. This question will allow to analyses the ratio of people who have used the technology of
AR. 42 out of 73 affirmatively responded this question and stated that they have a past
experience in which they have used AR to purchase products. On the other hand, 31 out of 73
participants has not used AR in past. Although, it must be considered that the participants who
has not used AR in past will not impact the results of this investigation as they were asked to use
the IKEA application before responding to further questions.
2: The product information provided by the augmented reality application is
identical to the information I would get from a direct product examination
(e.g. in store) Frequency
Strongly disagree (1) 3
Disagree (2) 12
Neutral (3) 26
Agree (4) 30
Strongly Agree (5) 2
3

This question is related to the PQ (Pragmatic quality) ownership of the hypothesis 1. This
question seeks to ask participants that whether the information was provided to them about a
product on AR application is identical to the information received from store after direct product
examination or not (Kern, 2018) (von Briel, 2018). Above frequency analysis results show that
high number of people has agreed with this statement which implies PQ of AQ does positive
impact UX or user satisfaction.
3. The ability to interact, virtually “touch” and place the product in my
environment makes me feel like I own it. Frequency
Strongly disagree (1) 5
Disagree (2) 12
Neutral (3) 12
Agree (4) 30
Strongly Agree (5) 14
4
⊘ This is a preview!⊘
Do you want full access?
Subscribe today to unlock all pages.

Trusted by 1+ million students worldwide

This question is also related with PQ perceived ownership which seek to ask people that
whether they agree with the statement that virtual touch on augmented reality application feels
like real touch and 44 out of 73 people are observe to agree with this statement implying PQ
attribute of AR does lays positive impact on the satisfaction on user experience.
4. How would you describe IKEA AR app in terms of ease of use? Choose
appropriate answers. Frequency
Easy to learn 12
Simple 30
Difficulty to learn 12
Complicated 1
5
Paraphrase This Document
Need a fresh take? Get an instant paraphrase of this document with our AI Paraphraser

This question is related with the PQ usability of AR that impacts UX. This particular
question is reflecting the responses that out of 73 people, 30 has responded that AR application is
simple and 12 has responded that AR application of IKEA was easier to learn (Henningsson and
et.al., 2020). As the ratio of responding easier to learn and simple is higher than the ratio of
difficult to learn and complicated, it can be implied that PQ of AR positively impacts user
experience.
5. I am more likely to use Augmented Reality shopping app if important
people in my life (e.g. family, friends) use it as well Frequency
Strongly disagree (1) 3
Disagree (2) 16
Neutral (3) 16
Agree (4) 25
Strongly Agree (5) 13
6

This theme is related to hedonic quality of AR that impacts UX. To test this attribute of
the hypothesis 1, 4 questions are developed. The above frequency distribution is reflecting that
out of 73 participants, 25 and 13 agree and strongly agree that they would use Augmented reality
application if most important people in their life use such applications (Abou El-Seoud and Taj-
Eddin, 2019).
6. Augmented reality applications present the products in a novel way Frequency
Strongly disagree (1) 1
Disagree (2) 1
Neutral (3) 17
Agree (4) 29
Strongly Agree (5) 25
7
⊘ This is a preview!⊘
Do you want full access?
Subscribe today to unlock all pages.

Trusted by 1+ million students worldwide

As mentioned above, this question is related to the HQ attribute of novelty. The above
graphical and tabular analysis is indicating that when 73 participants were asked that whether
according to them AR applications presents products in most original way then 29 and 25 people
agreed and strongly agreed with that it is true that AR application presents products in original or
novel way.
7. AR motivates me to spend more time browsing products Frequency
Strongly disagree (1) 4
Disagree (2) 9
Neutral (3) 21
Agree (4) 20
Strongly Agree (5) 19
8
Paraphrase This Document
Need a fresh take? Get an instant paraphrase of this document with our AI Paraphraser

Similar to above question, this one is also related with HQ attribute of motivation which
seeks to ask from participants that whether they agree with the statement that Augmented reality
motivates to spend more time to browse products. The responses of participants were positive as
21 people has responded as neutral, 20 has agreed and 19 has strongly agreed with this statement.
8. It was fun experience to play around with the AR application. Frequency
Strongly disagree (1) 3
Disagree (2) 1
Neutral (3) 14
Agree (4) 28
Strongly Agree (5) 26
This theme is related with hedonic quality of AR applications. The responses of such
questions shows that majority of the participants agree with the statement that they experienced a
fun experience while playing around AR application.
9. The visual design of IKEA AR application was aesthetically pleasing Frequency
Strongly disagree (1) 4
Disagree (2) 0
Neutral (3) 21
9

Agree (4) 30
Strongly Agree (5) 18
This question is related with the aesthetic quality of AR applications and is the last
response that is gained to test hypothesis 1. The responses of such theme are reflecting that
majority of the participants agree with the statement that the AR application of IKEA was
aesthetically pleasing (Balaji and et al., 2018).
All the 8 questions which are analyzed above has more ratio of agree responses than
disagree responses which implies that Augmented reality applications does impact user
experience as they have their attributes of AQ, HQ and PQ. This accepts the hypothesis 1 that
AR has a positive impact on UX that is expressed in product attributes.
HYPOTHESIS 2
The hypothesis 2 is related with the three elements of conceptual framework which are
Augmented reality, User’s Information privacy control and User experience. This hypothesis
states that the link between AR and UX would be boosted if user’s information privacy control is
increased and enhanced. In order to test this hypothesis, two questions were asked from 73
participants. Frequency distribution of those two questions is undertaken below:
14. I was notified about personal data collection and details on how the data
will be used were given Frequency
Strongly disagree (1) 3
Disagree (2) 4
10
⊘ This is a preview!⊘
Do you want full access?
Subscribe today to unlock all pages.

Trusted by 1+ million students worldwide
1 out of 20
Related Documents

Your All-in-One AI-Powered Toolkit for Academic Success.
+13062052269
info@desklib.com
Available 24*7 on WhatsApp / Email
Unlock your academic potential
Copyright © 2020–2025 A2Z Services. All Rights Reserved. Developed and managed by ZUCOL.