Exploring Trust & Democracy: Data Analysis of Arab Barometer Survey
VerifiedAdded on  2023/06/12
|6
|2505
|377
Report
AI Summary
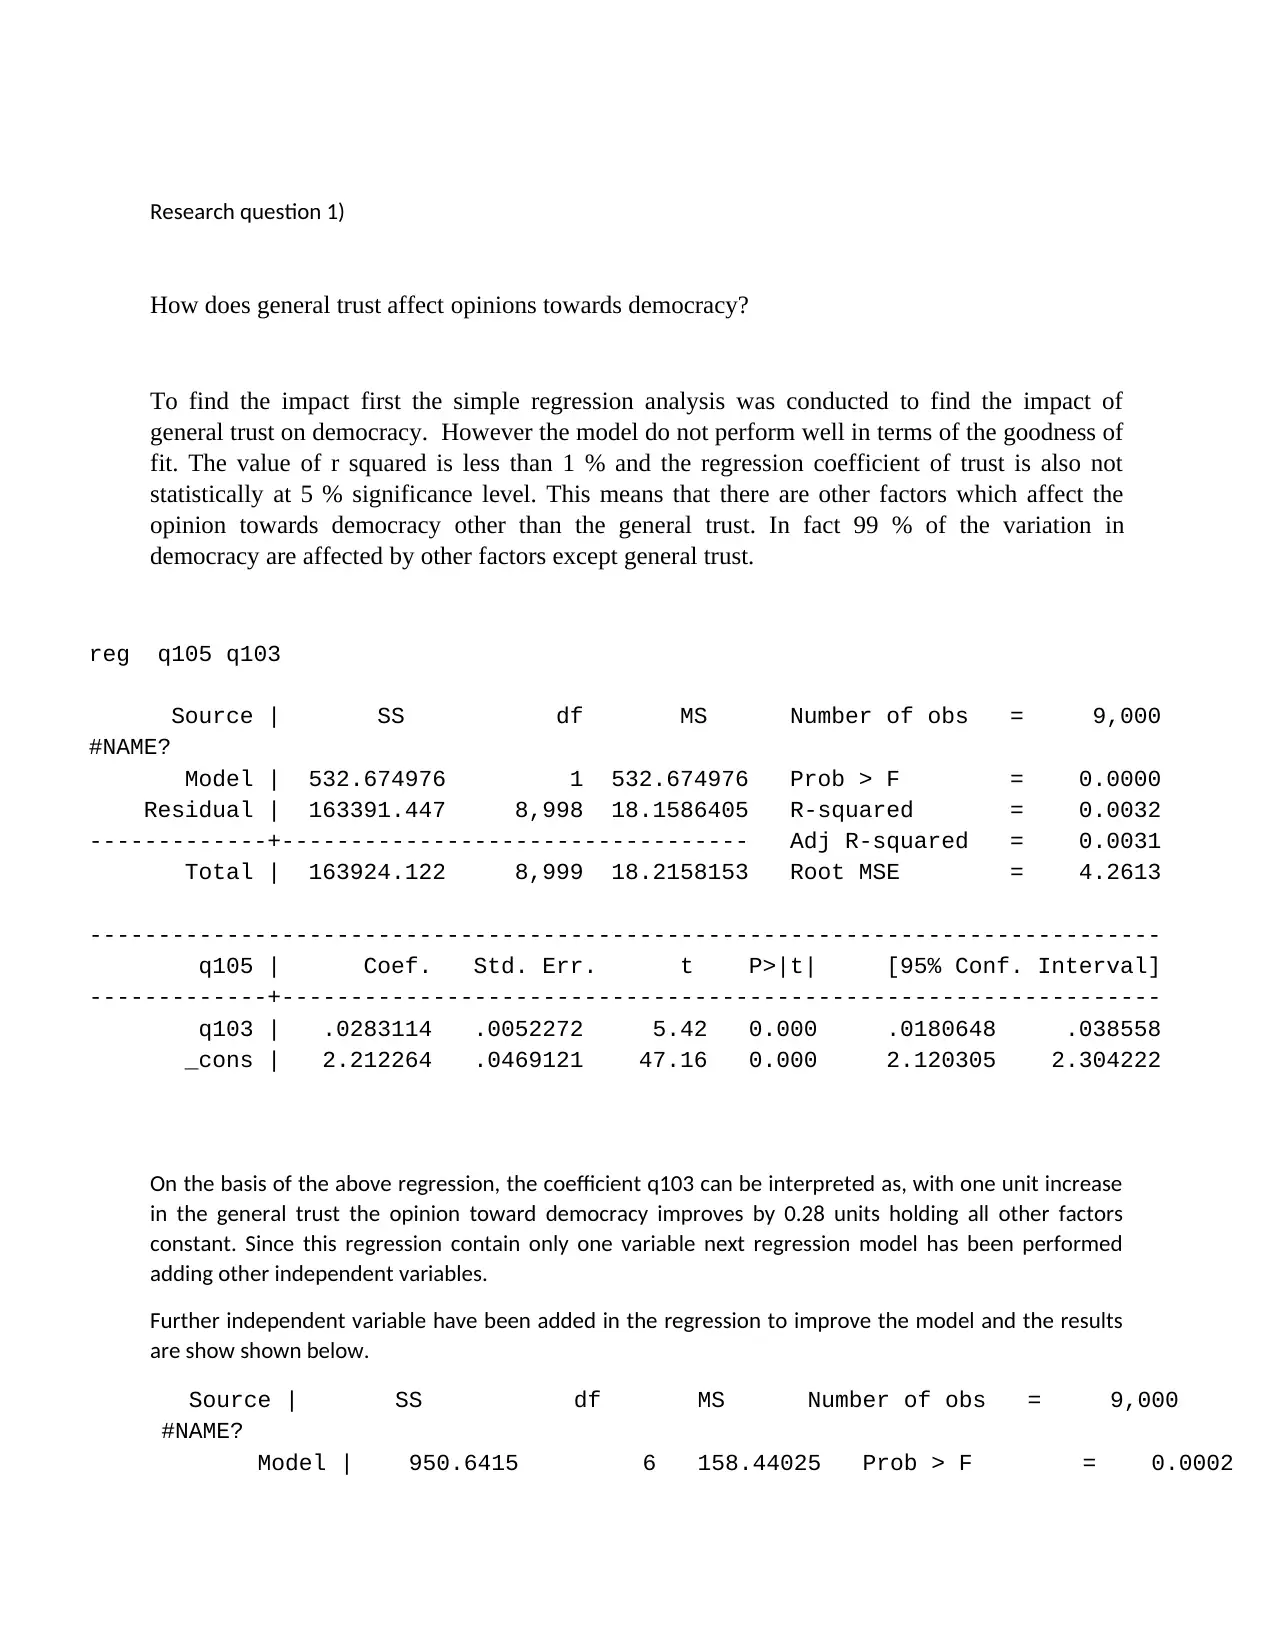
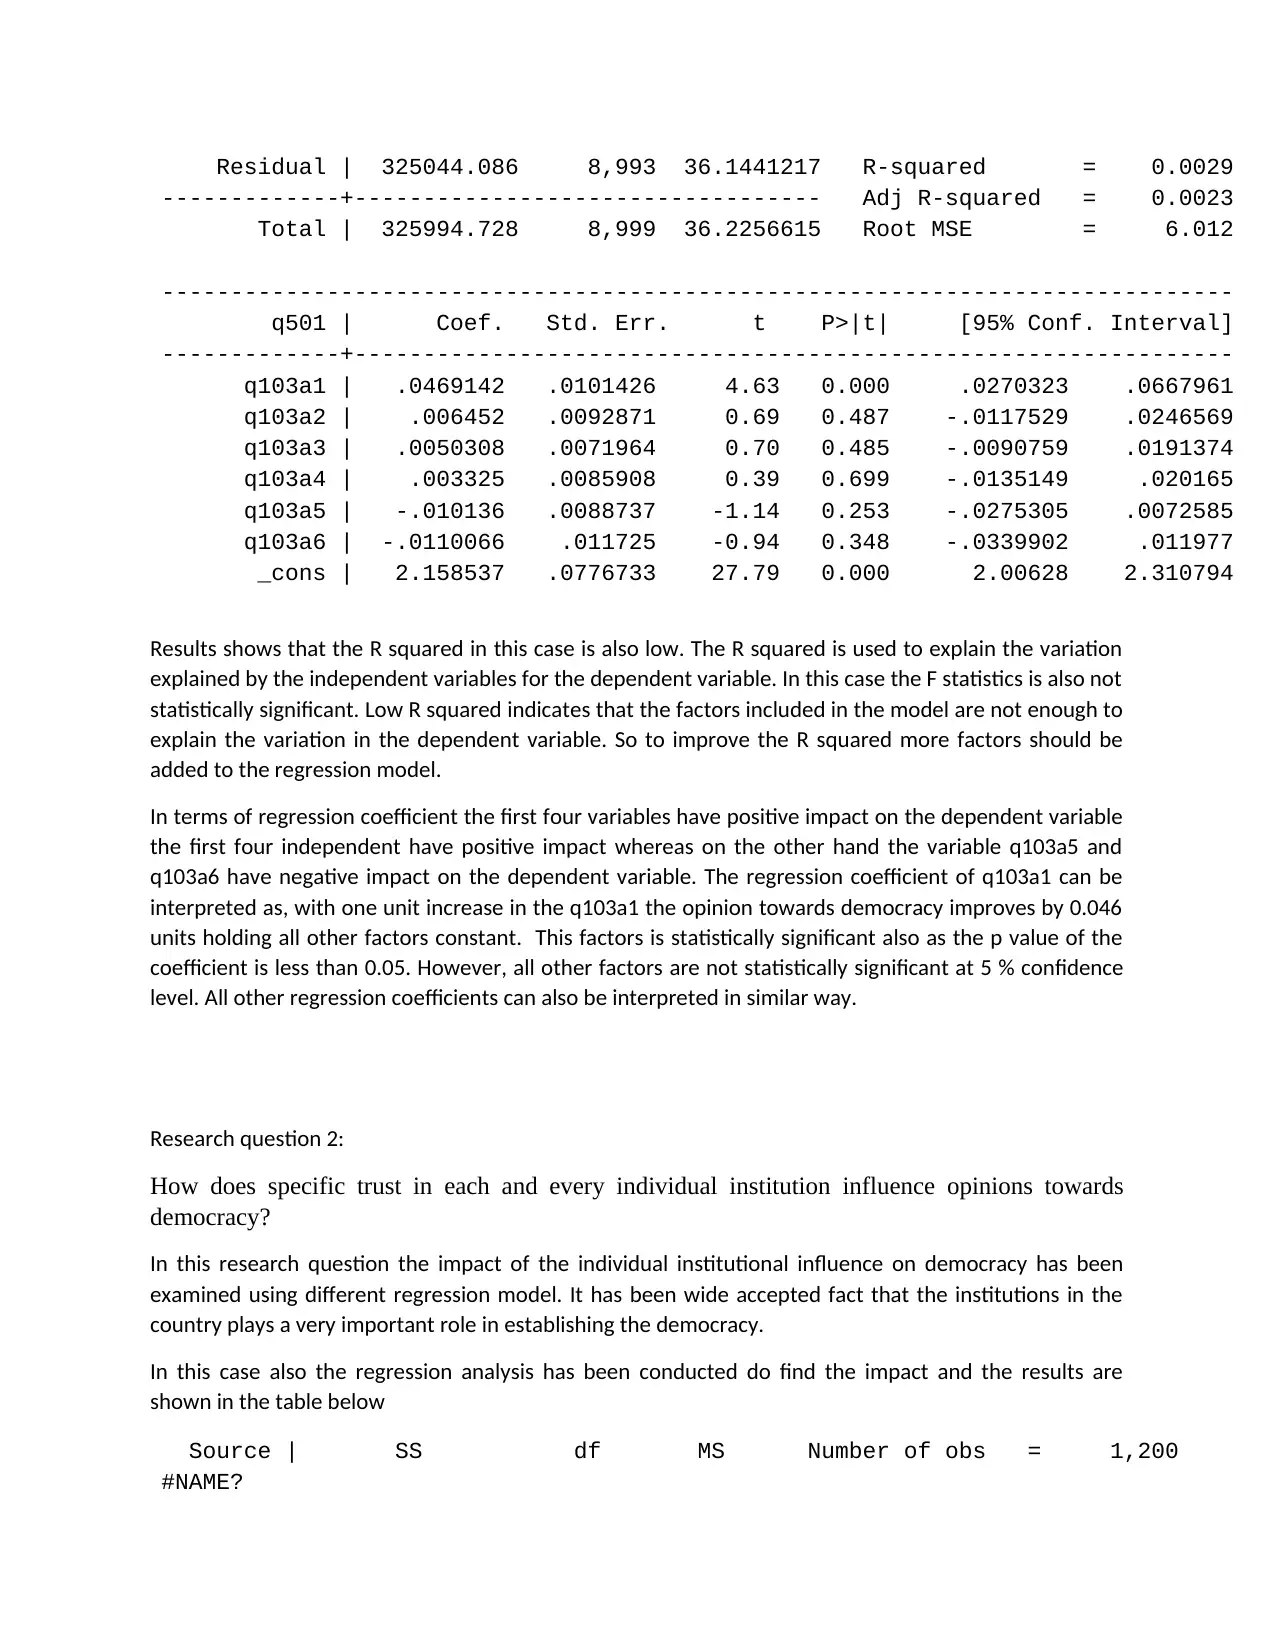
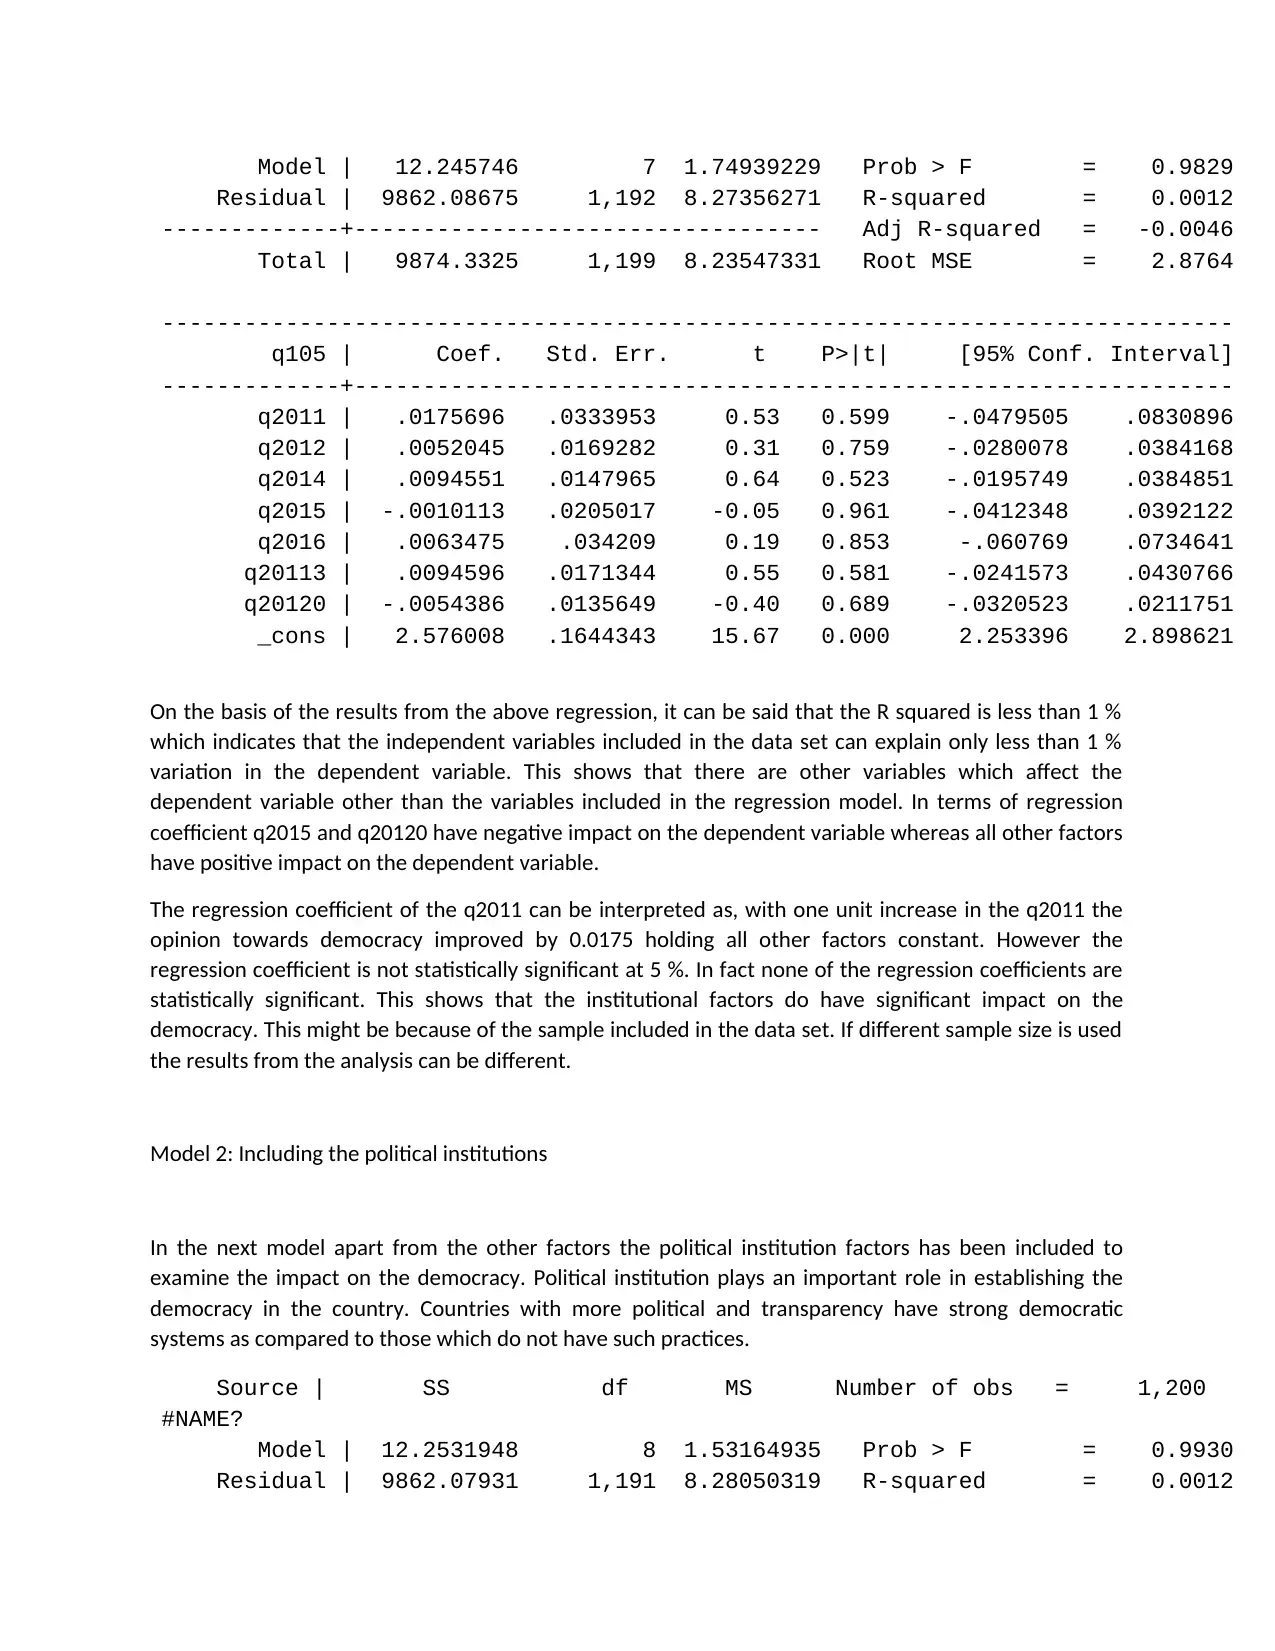
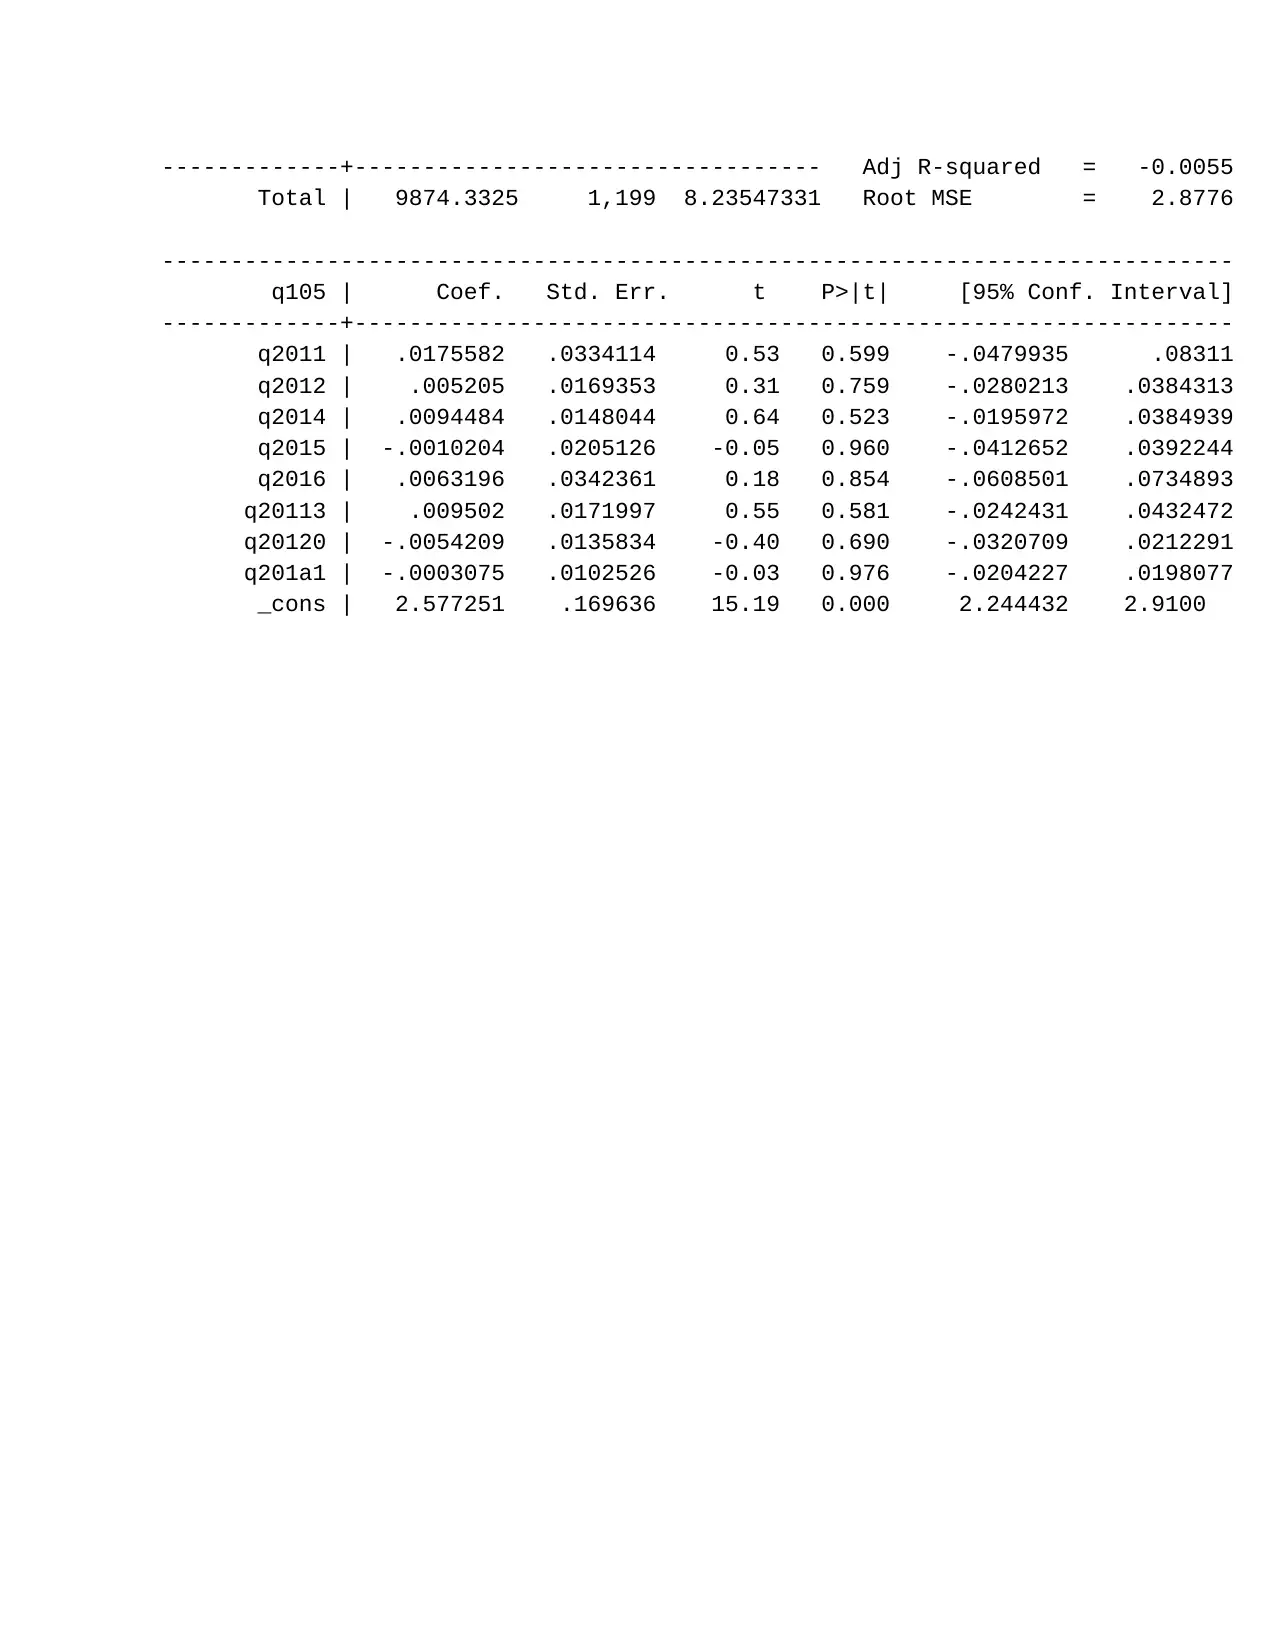
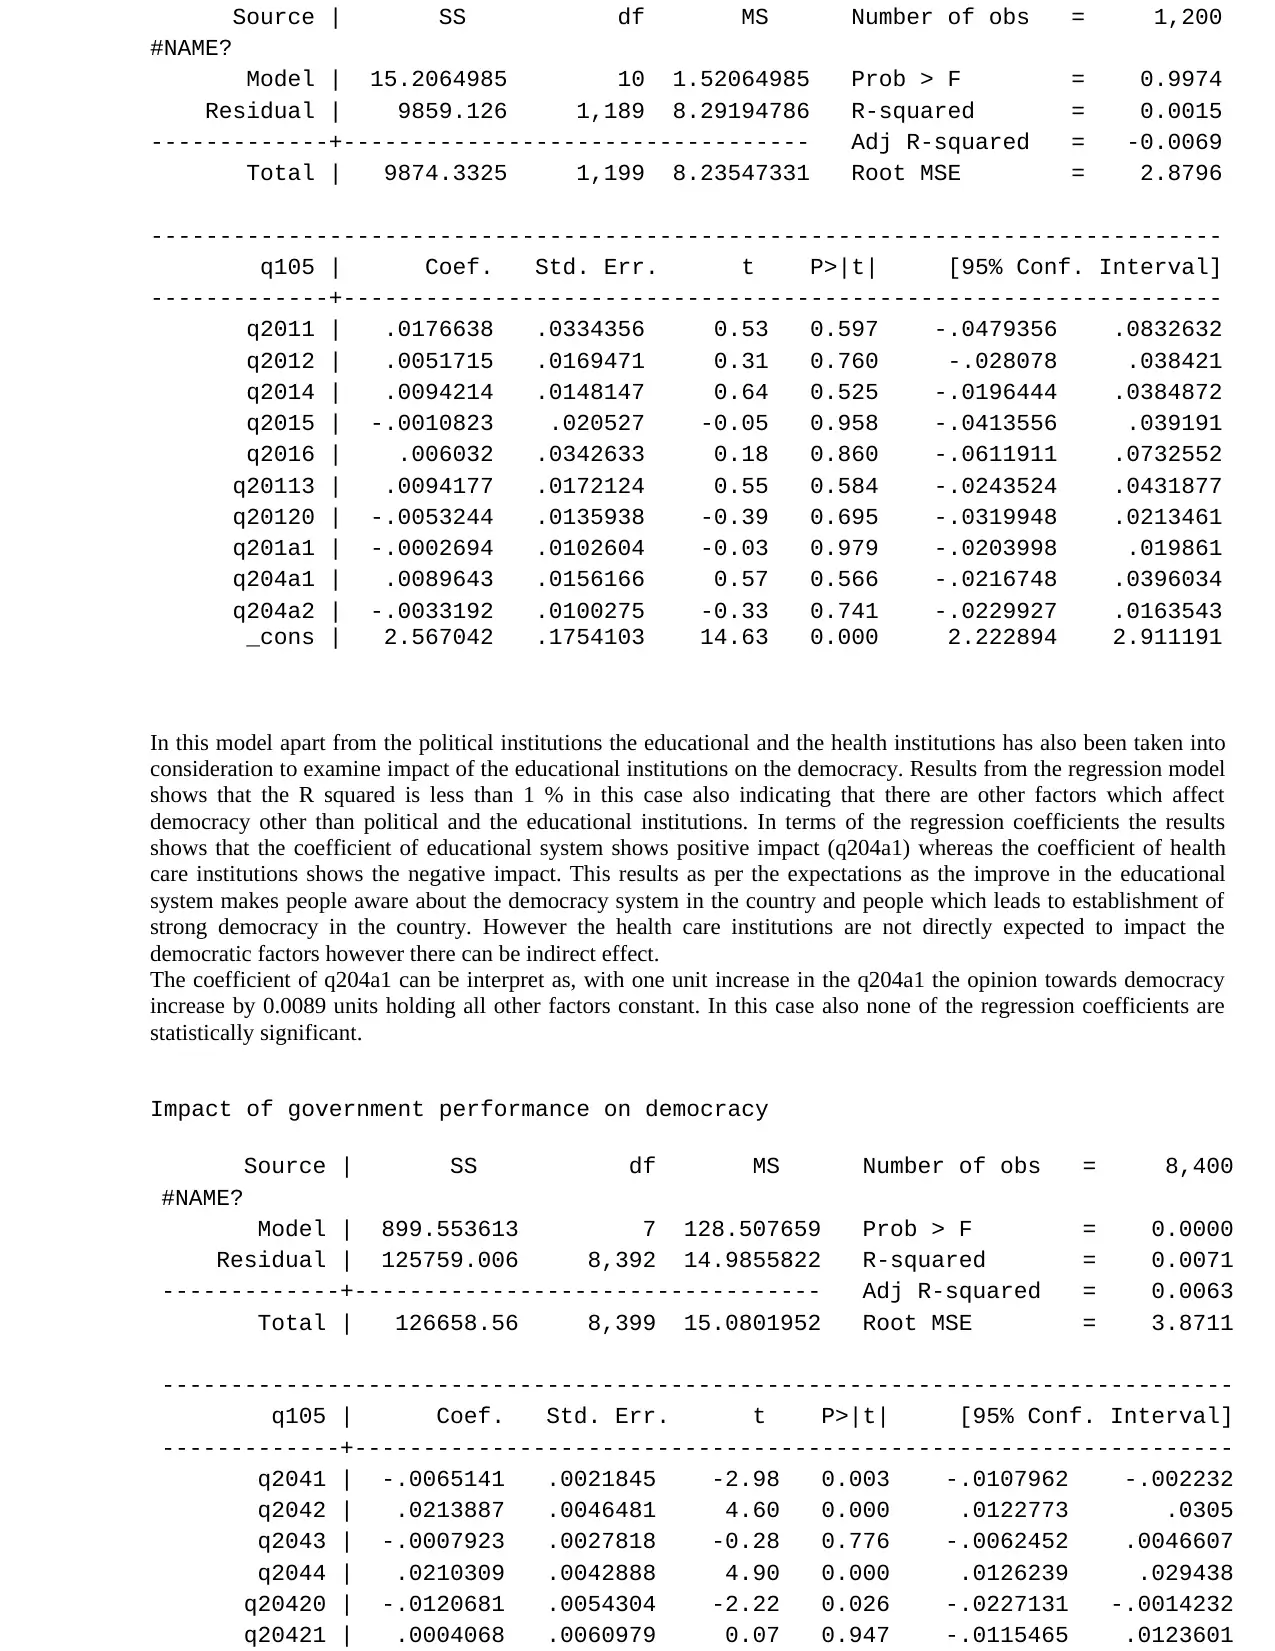
This report investigates the relationship between general and specific trust and their impact on opinions towards democracy, utilizing data from the Arab Barometer survey. The analysis employs regression models to assess the influence of various trust factors, including trust in institutions, political entities, and general interpersonal trust, on democratic viewpoints. The initial regression analysis revealed a weak correlation between general trust and democratic opinions, prompting the inclusion of additional independent variables to enhance the model's explanatory power. Subsequent models explored the effects of specific institutional trust, political institutions, educational systems, and healthcare institutions on democratic attitudes. Despite these additions, the models consistently exhibited low R-squared values, indicating that the included variables explained only a small fraction of the variation in democratic opinions. The report concludes that while certain institutional and political factors may exert some influence, other unmeasured variables likely play a more significant role in shaping opinions towards democracy within the Arab Barometer dataset.

Research question 1)
How does general trust affect opinions towards democracy?
To find the impact first the simple regression analysis was conducted to find the impact of
general trust on democracy. However the model do not perform well in terms of the goodness of
fit. The value of r squared is less than 1 % and the regression coefficient of trust is also not
statistically at 5 % significance level. This means that there are other factors which affect the
opinion towards democracy other than the general trust. In fact 99 % of the variation in
democracy are affected by other factors except general trust.
reg q105 q103
Source | SS df MS Number of obs = 9,000
#NAME?
Model | 532.674976 1 532.674976 Prob > F = 0.0000
Residual | 163391.447 8,998 18.1586405 R-squared = 0.0032
-------------+---------------------------------- Adj R-squared = 0.0031
Total | 163924.122 8,999 18.2158153 Root MSE = 4.2613
------------------------------------------------------------------------------
q105 | Coef. Std. Err. t P>|t| [95% Conf. Interval]
-------------+----------------------------------------------------------------
q103 | .0283114 .0052272 5.42 0.000 .0180648 .038558
_cons | 2.212264 .0469121 47.16 0.000 2.120305 2.304222
On the basis of the above regression, the coefficient q103 can be interpreted as, with one unit increase
in the general trust the opinion toward democracy improves by 0.28 units holding all other factors
constant. Since this regression contain only one variable next regression model has been performed
adding other independent variables.
Further independent variable have been added in the regression to improve the model and the results
are show shown below.
Source | SS df MS Number of obs = 9,000
#NAME?
Model | 950.6415 6 158.44025 Prob > F = 0.0002
Paraphrase This Document
Need a fresh take? Get an instant paraphrase of this document with our AI Paraphraser

Residual | 325044.086 8,993 36.1441217 R-squared = 0.0029
-------------+---------------------------------- Adj R-squared = 0.0023
Total | 325994.728 8,999 36.2256615 Root MSE = 6.012
------------------------------------------------------------------------------
q501 | Coef. Std. Err. t P>|t| [95% Conf. Interval]
-------------+----------------------------------------------------------------
q103a1 | .0469142 .0101426 4.63 0.000 .0270323 .0667961
q103a2 | .006452 .0092871 0.69 0.487 -.0117529 .0246569
q103a3 | .0050308 .0071964 0.70 0.485 -.0090759 .0191374
q103a4 | .003325 .0085908 0.39 0.699 -.0135149 .020165
q103a5 | -.010136 .0088737 -1.14 0.253 -.0275305 .0072585
q103a6 | -.0110066 .011725 -0.94 0.348 -.0339902 .011977
_cons | 2.158537 .0776733 27.79 0.000 2.00628 2.310794
Results shows that the R squared in this case is also low. The R squared is used to explain the variation
explained by the independent variables for the dependent variable. In this case the F statistics is also not
statistically significant. Low R squared indicates that the factors included in the model are not enough to
explain the variation in the dependent variable. So to improve the R squared more factors should be
added to the regression model.
In terms of regression coefficient the first four variables have positive impact on the dependent variable
the first four independent have positive impact whereas on the other hand the variable q103a5 and
q103a6 have negative impact on the dependent variable. The regression coefficient of q103a1 can be
interpreted as, with one unit increase in the q103a1 the opinion towards democracy improves by 0.046
units holding all other factors constant. This factors is statistically significant also as the p value of the
coefficient is less than 0.05. However, all other factors are not statistically significant at 5 % confidence
level. All other regression coefficients can also be interpreted in similar way.
Research question 2:
How does specific trust in each and every individual institution influence opinions towards
democracy?
In this research question the impact of the individual institutional influence on democracy has been
examined using different regression model. It has been wide accepted fact that the institutions in the
country plays a very important role in establishing the democracy.
In this case also the regression analysis has been conducted do find the impact and the results are
shown in the table below
Source | SS df MS Number of obs = 1,200
#NAME?

Model | 12.245746 7 1.74939229 Prob > F = 0.9829
Residual | 9862.08675 1,192 8.27356271 R-squared = 0.0012
-------------+---------------------------------- Adj R-squared = -0.0046
Total | 9874.3325 1,199 8.23547331 Root MSE = 2.8764
------------------------------------------------------------------------------
q105 | Coef. Std. Err. t P>|t| [95% Conf. Interval]
-------------+----------------------------------------------------------------
q2011 | .0175696 .0333953 0.53 0.599 -.0479505 .0830896
q2012 | .0052045 .0169282 0.31 0.759 -.0280078 .0384168
q2014 | .0094551 .0147965 0.64 0.523 -.0195749 .0384851
q2015 | -.0010113 .0205017 -0.05 0.961 -.0412348 .0392122
q2016 | .0063475 .034209 0.19 0.853 -.060769 .0734641
q20113 | .0094596 .0171344 0.55 0.581 -.0241573 .0430766
q20120 | -.0054386 .0135649 -0.40 0.689 -.0320523 .0211751
_cons | 2.576008 .1644343 15.67 0.000 2.253396 2.898621
On the basis of the results from the above regression, it can be said that the R squared is less than 1 %
which indicates that the independent variables included in the data set can explain only less than 1 %
variation in the dependent variable. This shows that there are other variables which affect the
dependent variable other than the variables included in the regression model. In terms of regression
coefficient q2015 and q20120 have negative impact on the dependent variable whereas all other factors
have positive impact on the dependent variable.
The regression coefficient of the q2011 can be interpreted as, with one unit increase in the q2011 the
opinion towards democracy improved by 0.0175 holding all other factors constant. However the
regression coefficient is not statistically significant at 5 %. In fact none of the regression coefficients are
statistically significant. This shows that the institutional factors do have significant impact on the
democracy. This might be because of the sample included in the data set. If different sample size is used
the results from the analysis can be different.
Model 2: Including the political institutions
In the next model apart from the other factors the political institution factors has been included to
examine the impact on the democracy. Political institution plays an important role in establishing the
democracy in the country. Countries with more political and transparency have strong democratic
systems as compared to those which do not have such practices.
Source | SS df MS Number of obs = 1,200
#NAME?
Model | 12.2531948 8 1.53164935 Prob > F = 0.9930
Residual | 9862.07931 1,191 8.28050319 R-squared = 0.0012
⊘ This is a preview!⊘
Do you want full access?
Subscribe today to unlock all pages.

Trusted by 1+ million students worldwide

-------------+---------------------------------- Adj R-squared = -0.0055
Total | 9874.3325 1,199 8.23547331 Root MSE = 2.8776
------------------------------------------------------------------------------
q105 | Coef. Std. Err. t P>|t| [95% Conf. Interval]
-------------+----------------------------------------------------------------
q2011 | .0175582 .0334114 0.53 0.599 -.0479935 .08311
q2012 | .005205 .0169353 0.31 0.759 -.0280213 .0384313
q2014 | .0094484 .0148044 0.64 0.523 -.0195972 .0384939
q2015 | -.0010204 .0205126 -0.05 0.960 -.0412652 .0392244
q2016 | .0063196 .0342361 0.18 0.854 -.0608501 .0734893
q20113 | .009502 .0171997 0.55 0.581 -.0242431 .0432472
q20120 | -.0054209 .0135834 -0.40 0.690 -.0320709 .0212291
q201a1 | -.0003075 .0102526 -0.03 0.976 -.0204227 .0198077
_cons | 2.577251 .169636 15.19 0.000 2.244432 2.9100
Paraphrase This Document
Need a fresh take? Get an instant paraphrase of this document with our AI Paraphraser

Source | SS df MS Number of obs = 1,200
#NAME?
Model | 15.2064985 10 1.52064985 Prob > F = 0.9974
Residual | 9859.126 1,189 8.29194786 R-squared = 0.0015
-------------+---------------------------------- Adj R-squared = -0.0069
Total | 9874.3325 1,199 8.23547331 Root MSE = 2.8796
------------------------------------------------------------------------------
q105 | Coef. Std. Err. t P>|t| [95% Conf. Interval]
-------------+----------------------------------------------------------------
q2011 | .0176638 .0334356 0.53 0.597 -.0479356 .0832632
q2012 | .0051715 .0169471 0.31 0.760 -.028078 .038421
q2014 | .0094214 .0148147 0.64 0.525 -.0196444 .0384872
q2015 | -.0010823 .020527 -0.05 0.958 -.0413556 .039191
q2016 | .006032 .0342633 0.18 0.860 -.0611911 .0732552
q20113 | .0094177 .0172124 0.55 0.584 -.0243524 .0431877
q20120 | -.0053244 .0135938 -0.39 0.695 -.0319948 .0213461
q201a1 | -.0002694 .0102604 -0.03 0.979 -.0203998 .019861
q204a1 | .0089643 .0156166 0.57 0.566 -.0216748 .0396034
q204a2 | -.0033192 .0100275 -0.33 0.741 -.0229927 .0163543
_cons | 2.567042 .1754103 14.63 0.000 2.222894 2.911191
In this model apart from the political institutions the educational and the health institutions has also been taken into
consideration to examine impact of the educational institutions on the democracy. Results from the regression model
shows that the R squared is less than 1 % in this case also indicating that there are other factors which affect
democracy other than political and the educational institutions. In terms of the regression coefficients the results
shows that the coefficient of educational system shows positive impact (q204a1) whereas the coefficient of health
care institutions shows the negative impact. This results as per the expectations as the improve in the educational
system makes people aware about the democracy system in the country and people which leads to establishment of
strong democracy in the country. However the health care institutions are not directly expected to impact the
democratic factors however there can be indirect effect.
The coefficient of q204a1 can be interpret as, with one unit increase in the q204a1 the opinion towards democracy
increase by 0.0089 units holding all other factors constant. In this case also none of the regression coefficients are
statistically significant.
Impact of government performance on democracy
Source | SS df MS Number of obs = 8,400
#NAME?
Model | 899.553613 7 128.507659 Prob > F = 0.0000
Residual | 125759.006 8,392 14.9855822 R-squared = 0.0071
-------------+---------------------------------- Adj R-squared = 0.0063
Total | 126658.56 8,399 15.0801952 Root MSE = 3.8711
------------------------------------------------------------------------------
q105 | Coef. Std. Err. t P>|t| [95% Conf. Interval]
-------------+----------------------------------------------------------------
q2041 | -.0065141 .0021845 -2.98 0.003 -.0107962 -.002232
q2042 | .0213887 .0046481 4.60 0.000 .0122773 .0305
q2043 | -.0007923 .0027818 -0.28 0.776 -.0062452 .0046607
q2044 | .0210309 .0042888 4.90 0.000 .0126239 .029438
q20420 | -.0120681 .0054304 -2.22 0.026 -.0227131 -.0014232
q20421 | .0004068 .0060979 0.07 0.947 -.0115465 .0123601
#NAME?
Model | 15.2064985 10 1.52064985 Prob > F = 0.9974
Residual | 9859.126 1,189 8.29194786 R-squared = 0.0015
-------------+---------------------------------- Adj R-squared = -0.0069
Total | 9874.3325 1,199 8.23547331 Root MSE = 2.8796
------------------------------------------------------------------------------
q105 | Coef. Std. Err. t P>|t| [95% Conf. Interval]
-------------+----------------------------------------------------------------
q2011 | .0176638 .0334356 0.53 0.597 -.0479356 .0832632
q2012 | .0051715 .0169471 0.31 0.760 -.028078 .038421
q2014 | .0094214 .0148147 0.64 0.525 -.0196444 .0384872
q2015 | -.0010823 .020527 -0.05 0.958 -.0413556 .039191
q2016 | .006032 .0342633 0.18 0.860 -.0611911 .0732552
q20113 | .0094177 .0172124 0.55 0.584 -.0243524 .0431877
q20120 | -.0053244 .0135938 -0.39 0.695 -.0319948 .0213461
q201a1 | -.0002694 .0102604 -0.03 0.979 -.0203998 .019861
q204a1 | .0089643 .0156166 0.57 0.566 -.0216748 .0396034
q204a2 | -.0033192 .0100275 -0.33 0.741 -.0229927 .0163543
_cons | 2.567042 .1754103 14.63 0.000 2.222894 2.911191
In this model apart from the political institutions the educational and the health institutions has also been taken into
consideration to examine impact of the educational institutions on the democracy. Results from the regression model
shows that the R squared is less than 1 % in this case also indicating that there are other factors which affect
democracy other than political and the educational institutions. In terms of the regression coefficients the results
shows that the coefficient of educational system shows positive impact (q204a1) whereas the coefficient of health
care institutions shows the negative impact. This results as per the expectations as the improve in the educational
system makes people aware about the democracy system in the country and people which leads to establishment of
strong democracy in the country. However the health care institutions are not directly expected to impact the
democratic factors however there can be indirect effect.
The coefficient of q204a1 can be interpret as, with one unit increase in the q204a1 the opinion towards democracy
increase by 0.0089 units holding all other factors constant. In this case also none of the regression coefficients are
statistically significant.
Impact of government performance on democracy
Source | SS df MS Number of obs = 8,400
#NAME?
Model | 899.553613 7 128.507659 Prob > F = 0.0000
Residual | 125759.006 8,392 14.9855822 R-squared = 0.0071
-------------+---------------------------------- Adj R-squared = 0.0063
Total | 126658.56 8,399 15.0801952 Root MSE = 3.8711
------------------------------------------------------------------------------
q105 | Coef. Std. Err. t P>|t| [95% Conf. Interval]
-------------+----------------------------------------------------------------
q2041 | -.0065141 .0021845 -2.98 0.003 -.0107962 -.002232
q2042 | .0213887 .0046481 4.60 0.000 .0122773 .0305
q2043 | -.0007923 .0027818 -0.28 0.776 -.0062452 .0046607
q2044 | .0210309 .0042888 4.90 0.000 .0126239 .029438
q20420 | -.0120681 .0054304 -2.22 0.026 -.0227131 -.0014232
q20421 | .0004068 .0060979 0.07 0.947 -.0115465 .0123601

Results from the regression analysis shows that the R squared is also less than 1 indicating that the
variation explained by the independent variable on dependent variable very low. Similarly the F statistics
is also not significant indicating that the cumulative impact of independent variable on dependent
variable is not significant. In terms of regression coefficient none of the variables have statistically
significant. The coefficient of q2011 can be interpreted as, with one unit increase in q2011, the opinion
towards democracy improved by 0.017 units holding all other factors constant.
Model 3: Including educational and Health institution
In the last model the explanatory variables related to the educational institutions has also been included
in the regression model. Results from the analysis shows that despite adding more variables in the
regression model, the R squared do not improve and is still less than 1 %. However the F statistics is
statistically significant as the p value is less than 0.05, indicates that the cumulative impact of the
independent variables on dependent variable is significant. In terms of regression coefficient results
show that educational variables show positive impact on the democracy as the regression coefficient are
positive. However most of the factors related to general trust and specific trust shows negative impact
as the regression coefficients for most of those variables are negative. In the previous model the specific
trust variables showed positive impact.
⊘ This is a preview!⊘
Do you want full access?
Subscribe today to unlock all pages.

Trusted by 1+ million students worldwide
1 out of 6
Related Documents

Your All-in-One AI-Powered Toolkit for Academic Success.
 +13062052269
info@desklib.com
Available 24*7 on WhatsApp / Email
Unlock your academic potential
Copyright © 2020–2025 A2Z Services. All Rights Reserved. Developed and managed by ZUCOL.