ACC508 - Report: Analysis of ARB Corporation Limited Capital Structure
VerifiedAdded on 2021/06/17
|12
|1792
|105
Report
AI Summary
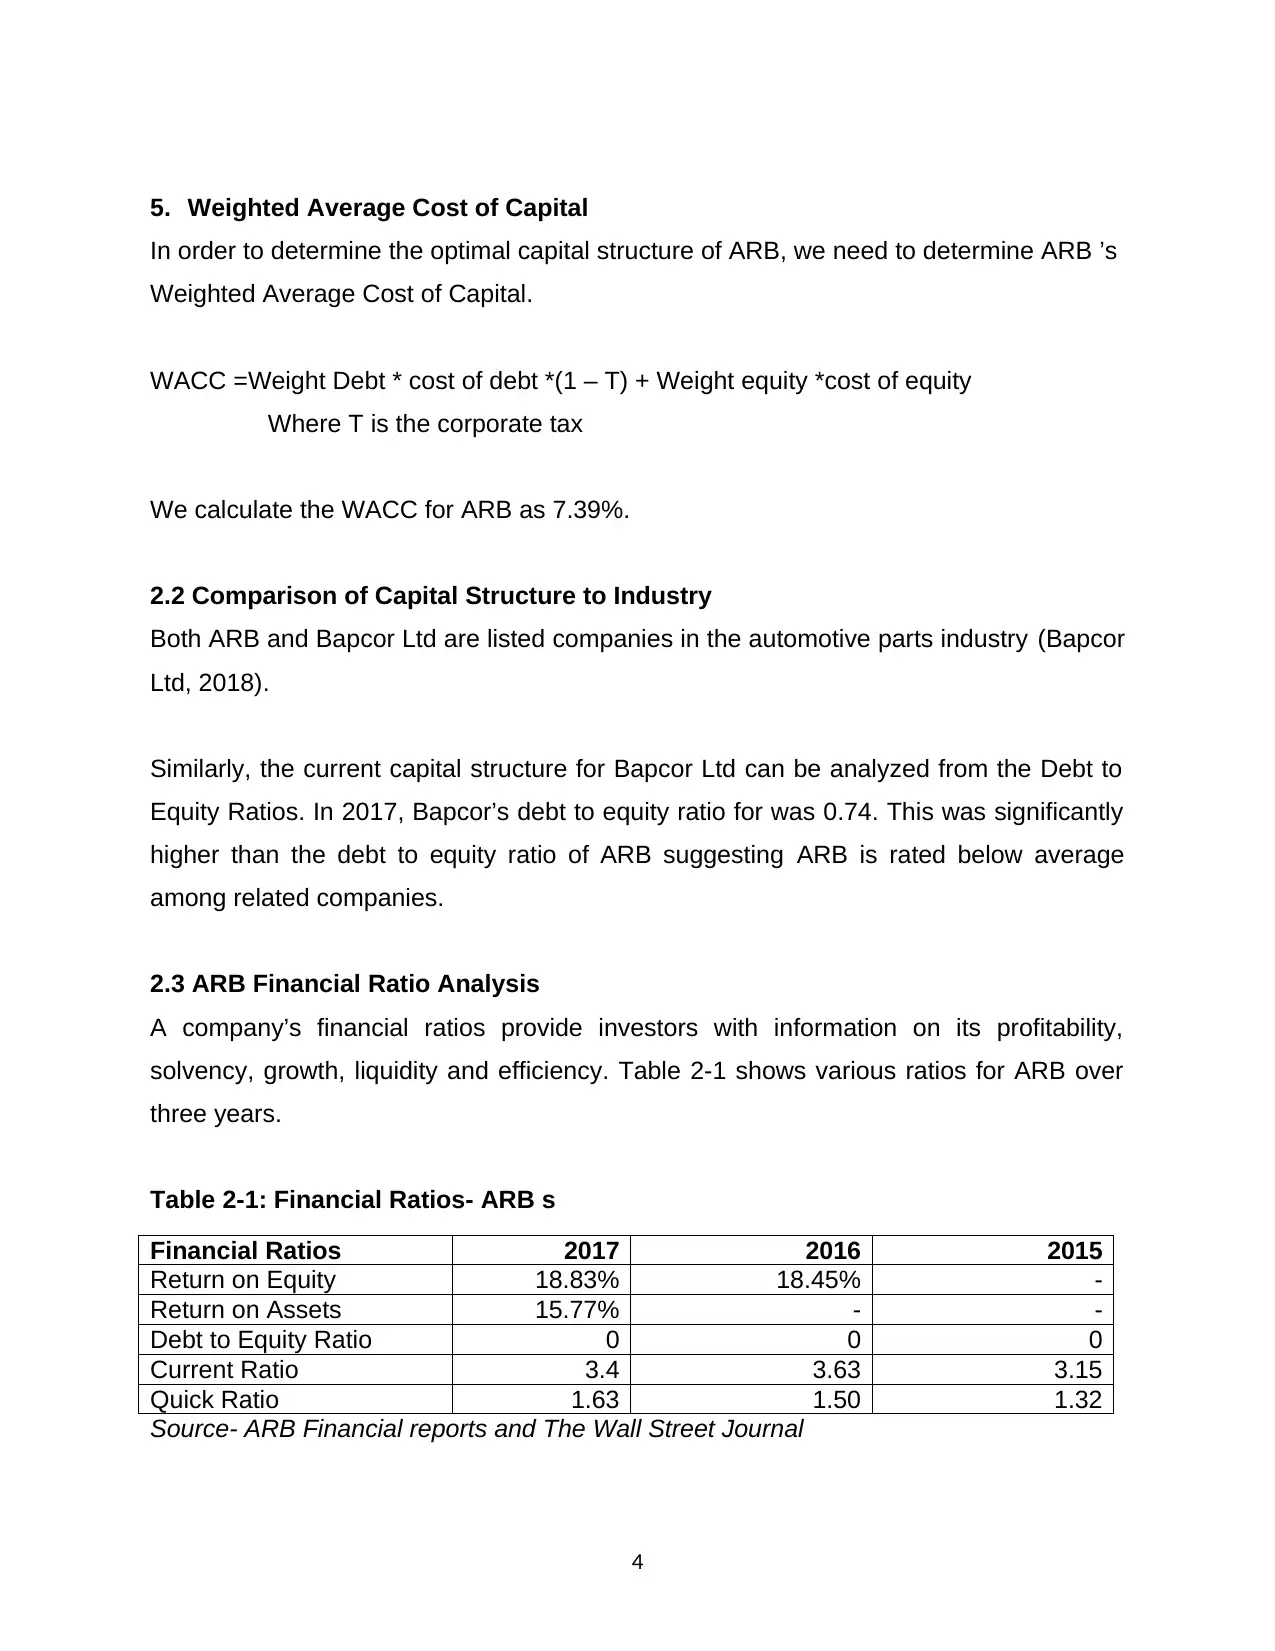
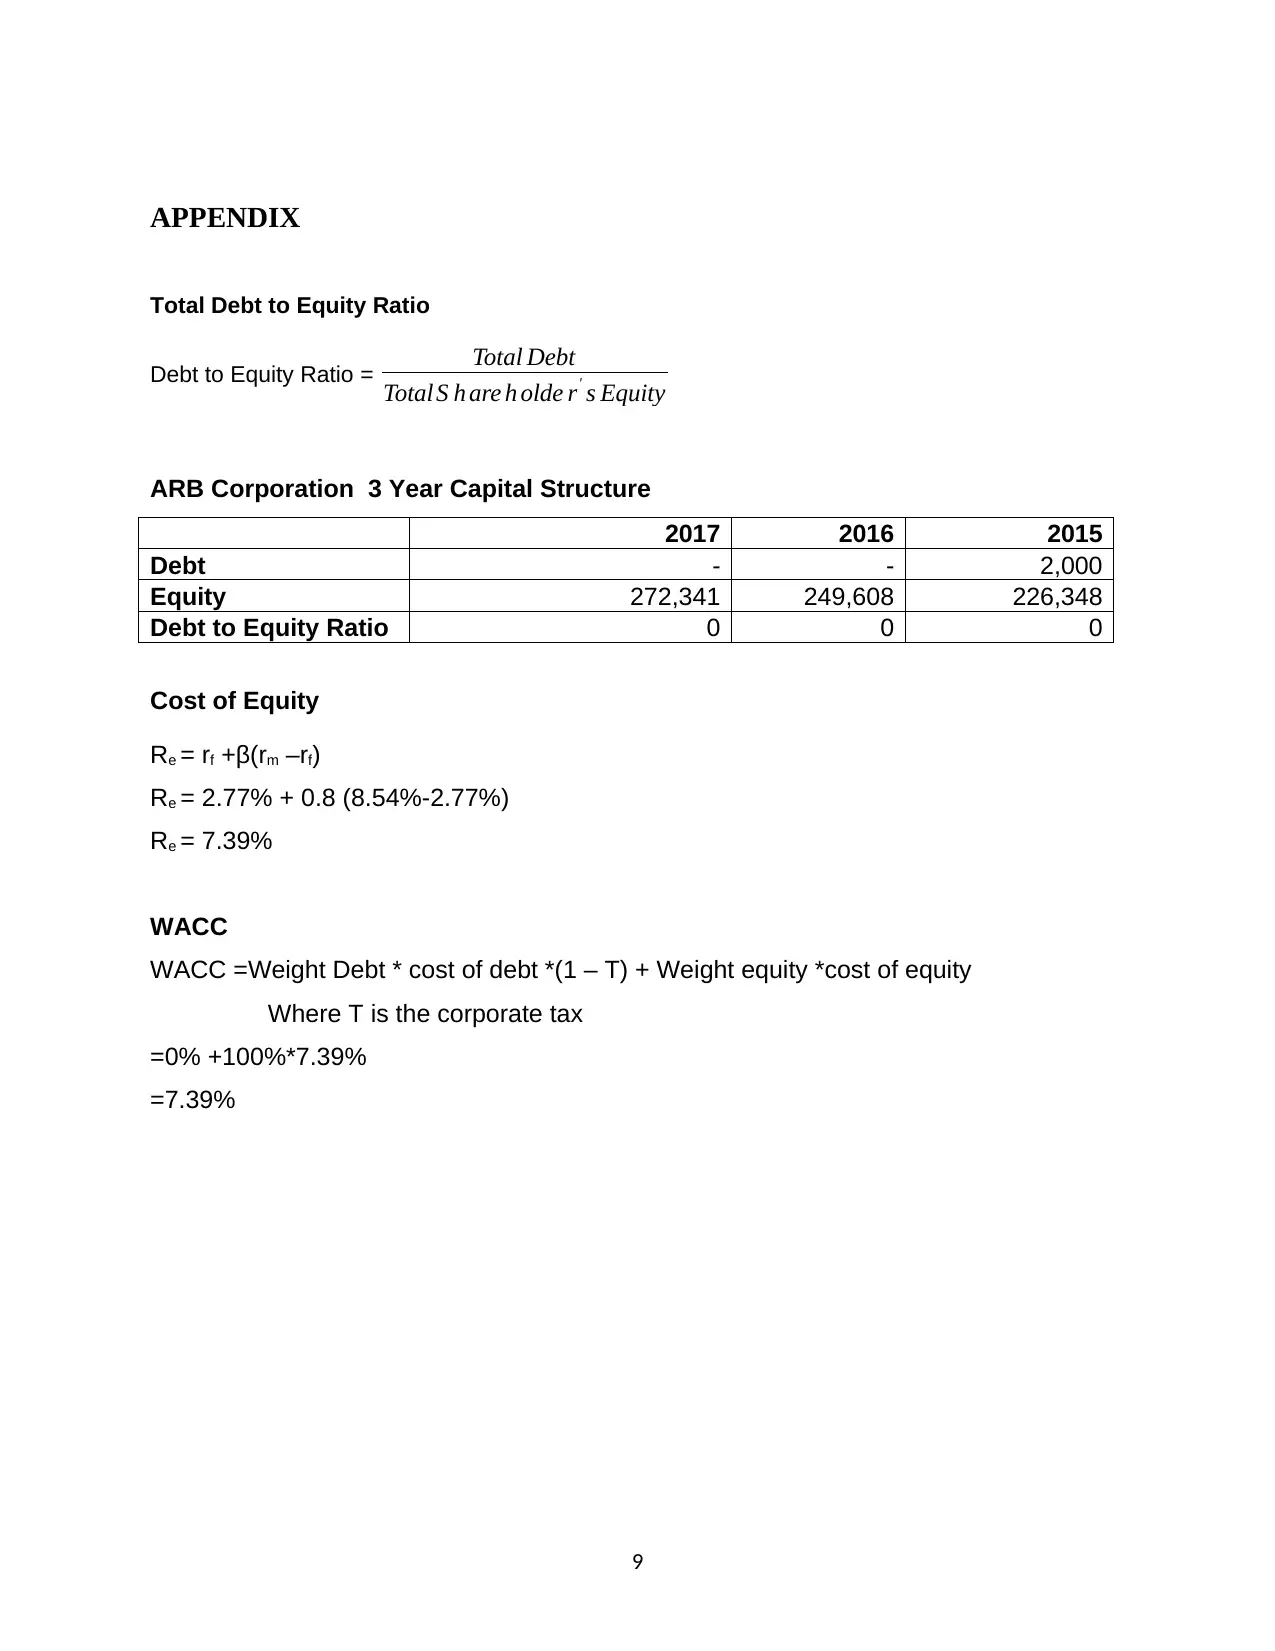
This report provides a comprehensive analysis of ARB Corporation Limited's (ARB.AX) capital structure, focusing on its debt-to-equity ratio, Weighted Average Cost of Capital (WACC), and key financial ratios. The report investigates ARB's financial performance from 2015 to 2017, evaluating its liquidity, solvency, and profitability. It calculates the cost of equity, cost of debt, and WACC to determine the optimal capital structure for maximizing shareholder value. The analysis compares ARB's capital structure with industry peers and concludes that ARB has been successful in maximizing shareholder wealth by maintaining an optimal capital structure of 0% debt and 100% equity, which is supported by its strong financial ratios, including a high return on equity and no liquidity or solvency risks. The report recommends that ARB continue to focus on minimizing its cost of capital to maximize long-term value creation.

Report on ARB Corporation Limited Capital Structure
Paraphrase This Document
Need a fresh take? Get an instant paraphrase of this document with our AI Paraphraser

EXECUTIVE SUMMARY
A capital structure refers to a company’s sources of finance. Financing can range from
equity to debt, however, in most cases it will usually be a combination of both. The
sources of debt include trade credit, short term debt loans and long term debt. The
sources of equity include retained profits and issuance of shares.
Analyzing the capital structure of a company can provide a lot of valuable information to
investors and creditors regarding its value creation. For example, a company with a
heavy reliance to debt would be considered more aggressive and hence more risky than
a company that is financed via equity. That being said, this company may experience a
higher growth rate.
The goal of many companies is to maximize their shareholder value. One of the ways to
maximize shareholder value is to minimize its cost of debt and equity. The optimal
capital structure of a firm is the mix of equity and debt that minimizes a firm’s cost of
capital.

TABLE OF CONTENTS
EXECUTIVE SUMMARY.................................................................................................................................ii
TABLE OF CONTENTS..................................................................................................................................iii
CHAPTER 1 : INTRODUCTION.......................................................................................................................1
CHAPTER 2 : ANALYSIS OF CAPITAL STRUCTURE.........................................................................................2
CHAPTER 3 : CONCLUSION- SHAREHOLDER VALUE.....................................................................................7
REFERENCES................................................................................................................................................8
APPENDIX....................................................................................................................................................9
⊘ This is a preview!⊘
Do you want full access?
Subscribe today to unlock all pages.

Trusted by 1+ million students worldwide

CHAPTER 1: INTRODUCTION
The purpose of this report is to provide information on the capital structure of ARB
Corporation Limited (ARB.AX) which is listed in the ASX and advice whether the firm
has been successful in maximizing wealth generation for its shareholders.
The financial statements of ARB were used to investigate its current capital structure,
optimal capital structure and key financial ratios. Based on this information, the report
then concludes on ARB’s value creation,
1
Paraphrase This Document
Need a fresh take? Get an instant paraphrase of this document with our AI Paraphraser

CHAPTER 2: ANALYSIS OF CAPITAL STRUCTURE
In order to analyze whether ARB is maximizing its shareholder wealth, the following
information needs to be analyzed based on the company’s financial reports (Lee, Liang,
& Miglo, 2014).
Determine ARB’s debt to equity ratio.
Perform comparison of debt/equity ratio with other similar companies in the motor
vehicle assembly industry.
Determine ARB’s optimal capital structure
Determine ARB’s Weighted Average Cost of Capital.
Compare ARB’s capital structure over past three years.
Total Debt to Equity Ratio
The total debt to equity ratio measures the relationship between equity capital and debt.
A high ratio suggests that a company has taken more debt and consequently, is more
aggressive with a higher risk (Investopedia, 2018).
In 2017, ARB’s debt to equity was nil as the company did not take any debt.
Weighted Average Cost of Capital
The WACC (also known as Weighted Average Cost of Capital) is the expected return on
the securities for a company.
WACC = Weight Debt * cost of debt *(1 – corporate tax) + Weight equity *cost of equity
The components of the WACC are as follows:-
Cost of equity
Cost of debt
Corporate tax rate
Weight of Equity
2

Weight of Debt
1. Cost of Equity
The cost of equity, Re can be determined from Capital Asset Pricing Model
Re = rf +β(rm –rf)
Where rf = Risk free rate, β= Beta, (rm –rf)= Risk premium
In 2017, assuming the firm has a Beta of 0.89 and the capital return on the market was
8.54%, then the cost of equity for ARB was 7.39% (see appendix).
2. Cost of Debt
To calculate the cost of debt we need to divide the total debt by the interest expense. In
2017, the cost of debt for ARB was nil given it had no debt.
3. Corporate Tax
As stated in their 2017 audited financial statements, it can be assumed that the
applicable corporate tax rate is 30%.
4. Weigh of Debt and Equity
To determine the Weights of Equity and Debt, we require the market value of Equity (E)
and the book value of Debt (D).
The market value of Equity is the current share price, P0, multiplied by the number of
shares outstanding. These data is available from Yahoo! Finance (Yahoo Finance,
2018).
The book value of Debt (D) can be obtained from the Balance Sheet. In 2017, D was nil.
Weight of Debt, Wd= D/D+E = 0%
Weight of Equity, We= E/D+E = 100%
3
⊘ This is a preview!⊘
Do you want full access?
Subscribe today to unlock all pages.

Trusted by 1+ million students worldwide

5. Weighted Average Cost of Capital
In order to determine the optimal capital structure of ARB, we need to determine ARB ’s
Weighted Average Cost of Capital.
WACC =Weight Debt * cost of debt *(1 – T) + Weight equity *cost of equity
Where T is the corporate tax
We calculate the WACC for ARB as 7.39%.
2.2 Comparison of Capital Structure to Industry
Both ARB and Bapcor Ltd are listed companies in the automotive parts industry (Bapcor
Ltd, 2018).
Similarly, the current capital structure for Bapcor Ltd can be analyzed from the Debt to
Equity Ratios. In 2017, Bapcor’s debt to equity ratio for was 0.74. This was significantly
higher than the debt to equity ratio of ARB suggesting ARB is rated below average
among related companies.
2.3 ARB Financial Ratio Analysis
A company’s financial ratios provide investors with information on its profitability,
solvency, growth, liquidity and efficiency. Table 2-1 shows various ratios for ARB over
three years.
Table 2-1: Financial Ratios- ARB s
Financial Ratios 2017 2016 2015
Return on Equity 18.83% 18.45% -
Return on Assets 15.77% - -
Debt to Equity Ratio 0 0 0
Current Ratio 3.4 3.63 3.15
Quick Ratio 1.63 1.50 1.32
Source- ARB Financial reports and The Wall Street Journal
4
Paraphrase This Document
Need a fresh take? Get an instant paraphrase of this document with our AI Paraphraser

Liquidity
These ratios determine the liquidity risk for the company i.e their ability to pay current
liabilities. They include current ratio and quick ratio (Subramanya & Wild, 2009). In
2017, ARB had a current ratio of 3.4 and a quick ratio of 1.63. A ratio above 1 suggests
greater assurance that ARB’s current liabilities can be paid using its current assets, thus
the company does not have a liquidity risk problem
Solvency
Solvency Ratios determine if a company a company can meets its long term liabilities.
They include time interest earned and debt to equity ratio. In 2017 and 2016, the debt to
equity ratio has been nil suggesting they have little debt and thus low risk.
Profitability
These ratios measure whether a company is profitable. They include return on asset
and return on equity (Subramanya & Wild, 2009). In 2017, ARB had a return on asset
of 15.77% and return on equity of 18.83%. Since the ratio is high and is increasing each
year then ARB is doing well.
2.3 ARB’s Capital Structure over Past Three Years
We note for year 2016 and 2015, the capital structure was 0%debt/100%equity and
0%debt/100%equity respectively. This suggests that the company has maintained its
capital structure for the past three years.
2.4 Creation of Shareholder Wealth and Minimizing Cost of Capital
Since ARB ’s current structure is at its optimal capital structure of 0% debt and 100%
equity, the company has been creating value for three years. Furthermore, it is evident
the company has performed well in the short term in terms of growth and profitability as
evidenced by their financial ratios.
One of the ways a firm can increase its share price, and hence create value for
shareholder’s is by minimizing its cost of capital. Thus it is important that the firm targets
5

an optimal capital structure. An alternative capital structure which also minimizes the
cost of capital is via asset based lending.
6
cost of capital is via asset based lending.
6
⊘ This is a preview!⊘
Do you want full access?
Subscribe today to unlock all pages.

Trusted by 1+ million students worldwide

CHAPTER 3: CONCLUSION- SHAREHOLDER VALUE
Shareholder wealth maximization involves increasing the share price. One of the ways
to create value in a firm is by utilizing an optimal capital structure.
In the case for ARB ’s, we can see that indeed the company is at its optimum capital
structure of 0% debt and 100% equity. Furthermore, their key ratios indicate that the
company is making profits, its ROE is greater than the WACC and they don’t seem to
have any liquidity/solvency risk.
In conclusion, ARB does appear to be creating maximum value for its shareholder’s as
evidenced from its high ROE. It should continue to aim to minimize its cost of capital so
that the firm’s value is maximized in the long run. Some of the ways ARB can minimize
its WACC include lowering its interest rates and managing its operational risks.
7
Paraphrase This Document
Need a fresh take? Get an instant paraphrase of this document with our AI Paraphraser

REFERENCES
Bapcor Ltd. (2018). About Us. Retrieved from Bapcor Ltd: https://www.bapcor.com.au
Investopedia. (2018). Debt/Equity Ratio. Retrieved from Investopedia: http://www.investopedia.com
Lee, Z., Liang, S., & Miglo, A. (2014). Capital Structure of Internet Companies: Case Study. Retrieved from
http://faculty.nipissingu.ca/antonm/files/2014/06
Subramanya, K., & Wild, J. (2009). Financial Statement Analysis. New York: McGraw-Hill Irwin.
Yahoo Finance. (2018). ARB CORPORATION LIMITED. Retrieved from Yahoo Finance:
https://au.finance.yahoo.com
8

APPENDIX
Total Debt to Equity Ratio
Debt to Equity Ratio = Total Debt
Total S h are h olde r' s Equity
ARB Corporation 3 Year Capital Structure
2017 2016 2015
Debt - - 2,000
Equity 272,341 249,608 226,348
Debt to Equity Ratio 0 0 0
Cost of Equity
Re = rf +β(rm –rf)
Re = 2.77% + 0.8 (8.54%-2.77%)
Re = 7.39%
WACC
WACC =Weight Debt * cost of debt *(1 – T) + Weight equity *cost of equity
Where T is the corporate tax
=0% +100%*7.39%
=7.39%
9
⊘ This is a preview!⊘
Do you want full access?
Subscribe today to unlock all pages.

Trusted by 1+ million students worldwide
1 out of 12
Related Documents

Your All-in-One AI-Powered Toolkit for Academic Success.
+13062052269
info@desklib.com
Available 24*7 on WhatsApp / Email
Unlock your academic potential
Copyright © 2020–2025 A2Z Services. All Rights Reserved. Developed and managed by ZUCOL.