Groupe Ariel S.A. Case: Parity Conditions and Cross-Border Valuation
VerifiedAdded on 2023/05/29
|19
|3621
|65
Case Study
AI Summary
This case study analyzes the financial feasibility of Groupe Ariel S.A.'s expansion project in Mexico, focusing on the valuation of a recycling equipment investment. The analysis involves calculating the Net Present Value (NPV) of the project using incremental cash flows in both pesos and Euros, considering factors like inflation rates in Mexico and France, exchange rate fluctuations, and the company's hurdle rate. The student's solution presents two different approaches to calculate the NPV: one converting the net cash flow from Peso to Euro and the other converting each cash flow. The case study highlights the importance of understanding parity conditions and their impact on cross-border valuations, comparing the results of the two methods and providing insights into which approach is most appropriate for making sound financial decisions. The analysis also includes detailed calculations of hurdle rates, discount factors, and present values, providing a comprehensive understanding of the project's financial viability. The document showcases a student's application of financial principles to a real-world business scenario, demonstrating their ability to evaluate investment proposals in an international context.
International Finance Management
Case Analysis
“Groupe Ariel S.A.: Parity Conditions and Cross-Border Valuation”
Groupe Ariel is a worldwide manufacturer of many equipment like printer,
copies, fax, machines, and other equipment producing document. Groupe
Ariel also provides various consulting services to outside people. The
company after sales service revenue forms a big portion and near to almost
18 percent of the total revenue. In 2008 the company did witness low
profitability and sales due to worldwide recession and it similar situation
was prevalent all over the industry, but the main advantage point of the
company is its growth comparison to several emerging market like that of
Russia, china and India. The company had been a global firm for years but
did not grow violently into the emerging market. The company captured
the international market through its subsidiaries which generally ran
medium sized factories in which generally printers, copiers and other
products were manufactured to suit the local need of the people around.
The company conducted its business in 28 different countries around the
globe with operations such as manufacturing, small research labs, as well
as engaged in sales and other activities. The Company subsidiaries had
recorded half of the Ariel sales and had earned slightly less than 40 percent
of the pre-tax income.
Ariel always competed in a strong market and mostly competitors of the
company is the multinational company and few have even developed
there after sales service higher the level compared to Ariel business.
Paraphrase This Document
Need a fresh take? Get an instant paraphrase of this document with our AI Paraphraser
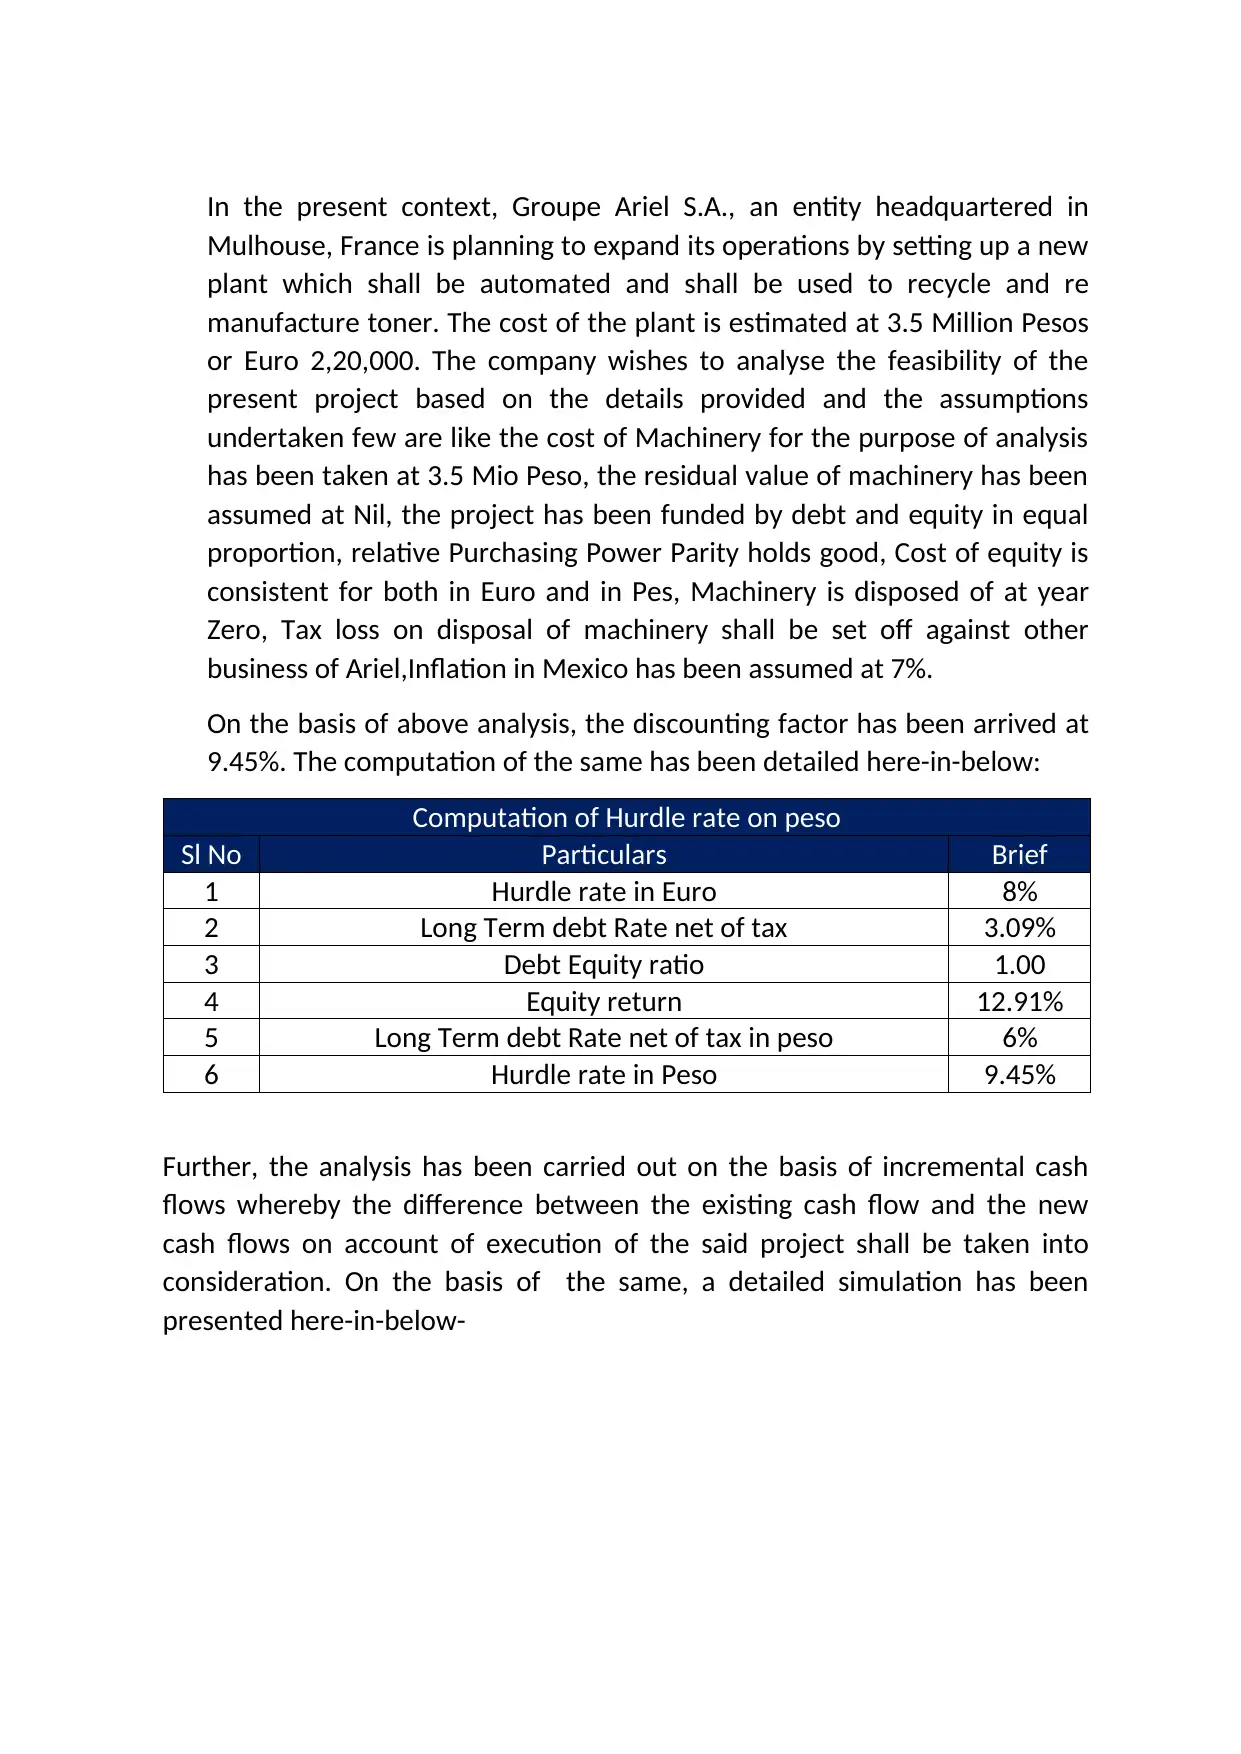
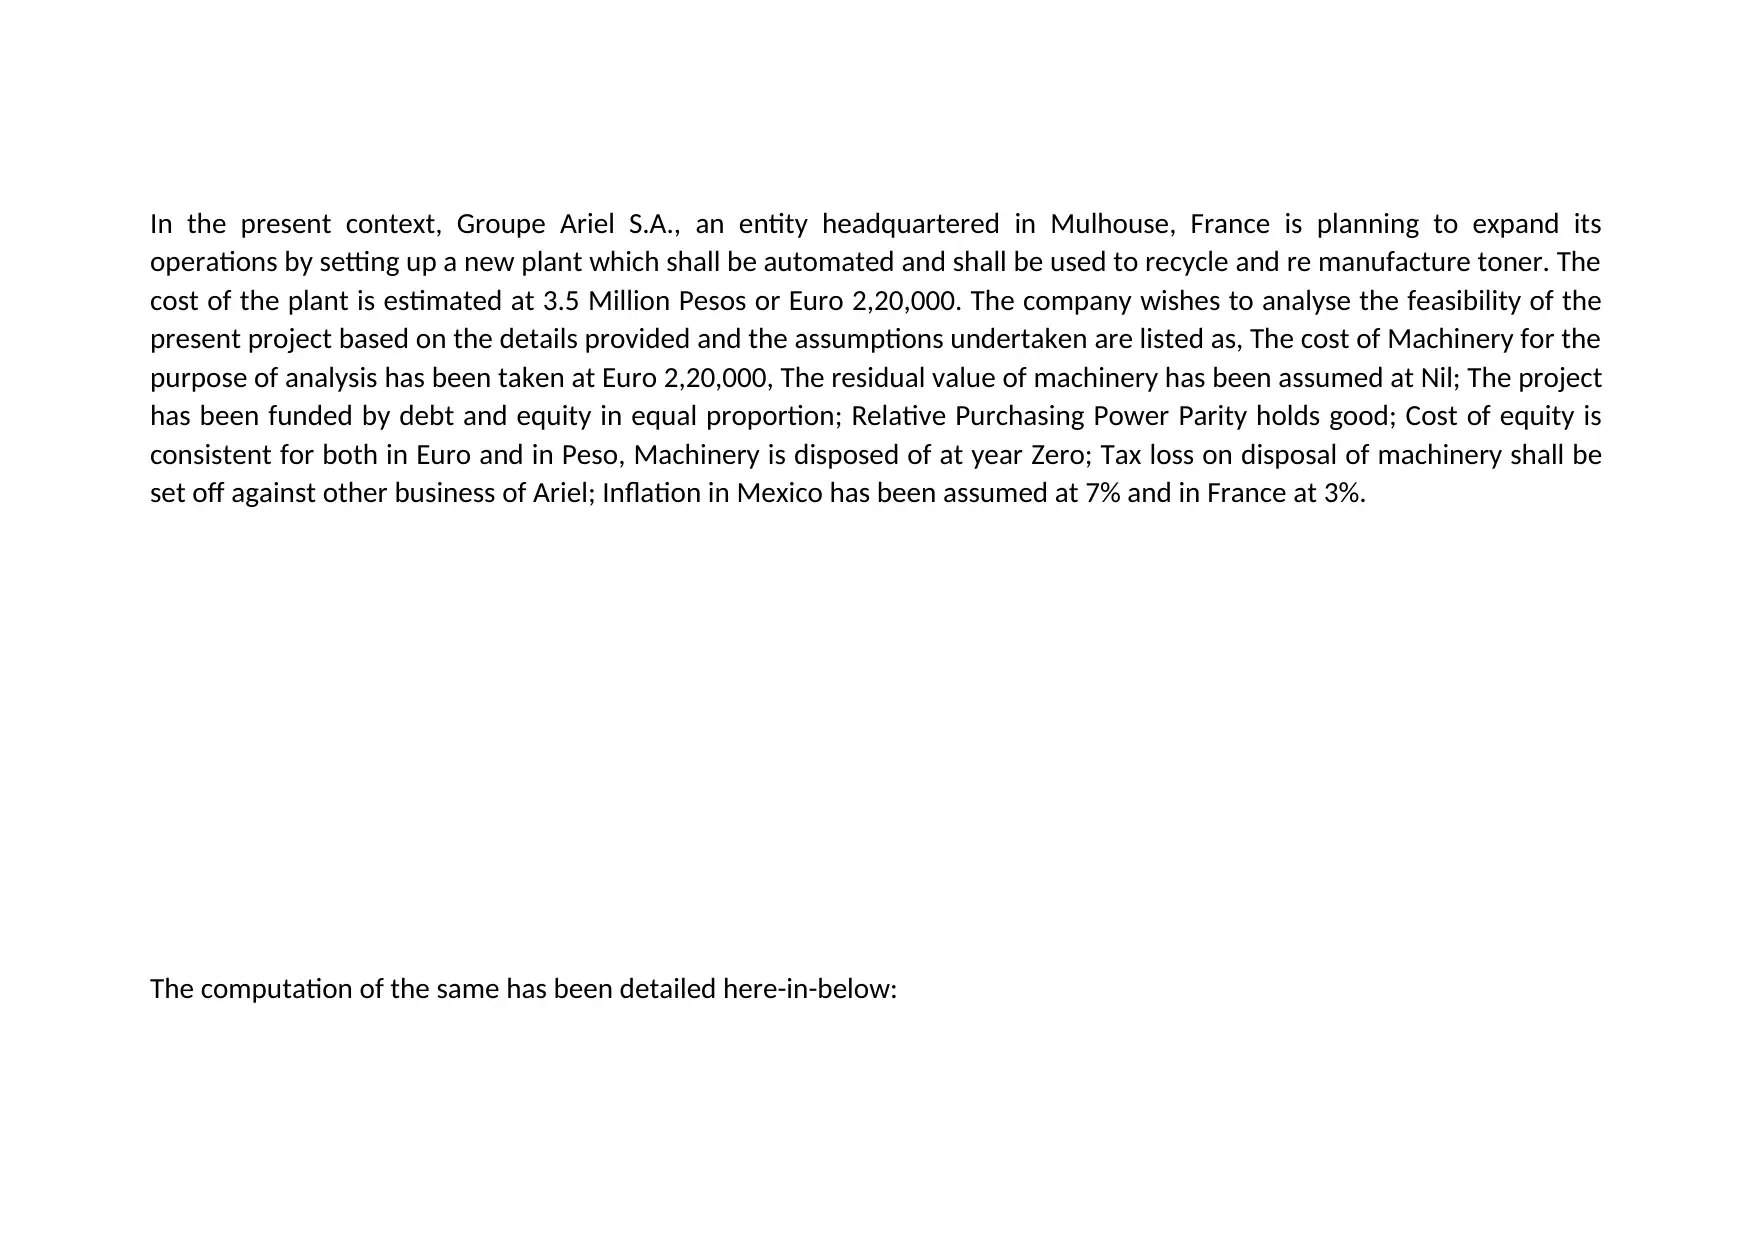
In the present context, Groupe Ariel S.A., an entity headquartered in
Mulhouse, France is planning to expand its operations by setting up a new
plant which shall be automated and shall be used to recycle and re
manufacture toner. The cost of the plant is estimated at 3.5 Million Pesos
or Euro 2,20,000. The company wishes to analyse the feasibility of the
present project based on the details provided and the assumptions
undertaken few are like the cost of Machinery for the purpose of analysis
has been taken at 3.5 Mio Peso, the residual value of machinery has been
assumed at Nil, the project has been funded by debt and equity in equal
proportion, relative Purchasing Power Parity holds good, Cost of equity is
consistent for both in Euro and in Pes, Machinery is disposed of at year
Zero, Tax loss on disposal of machinery shall be set off against other
business of Ariel,Inflation in Mexico has been assumed at 7%.
On the basis of above analysis, the discounting factor has been arrived at
9.45%. The computation of the same has been detailed here-in-below:
Computation of Hurdle rate on peso
Sl No Particulars Brief
1 Hurdle rate in Euro 8%
2 Long Term debt Rate net of tax 3.09%
3 Debt Equity ratio 1.00
4 Equity return 12.91%
5 Long Term debt Rate net of tax in peso 6%
6 Hurdle rate in Peso 9.45%
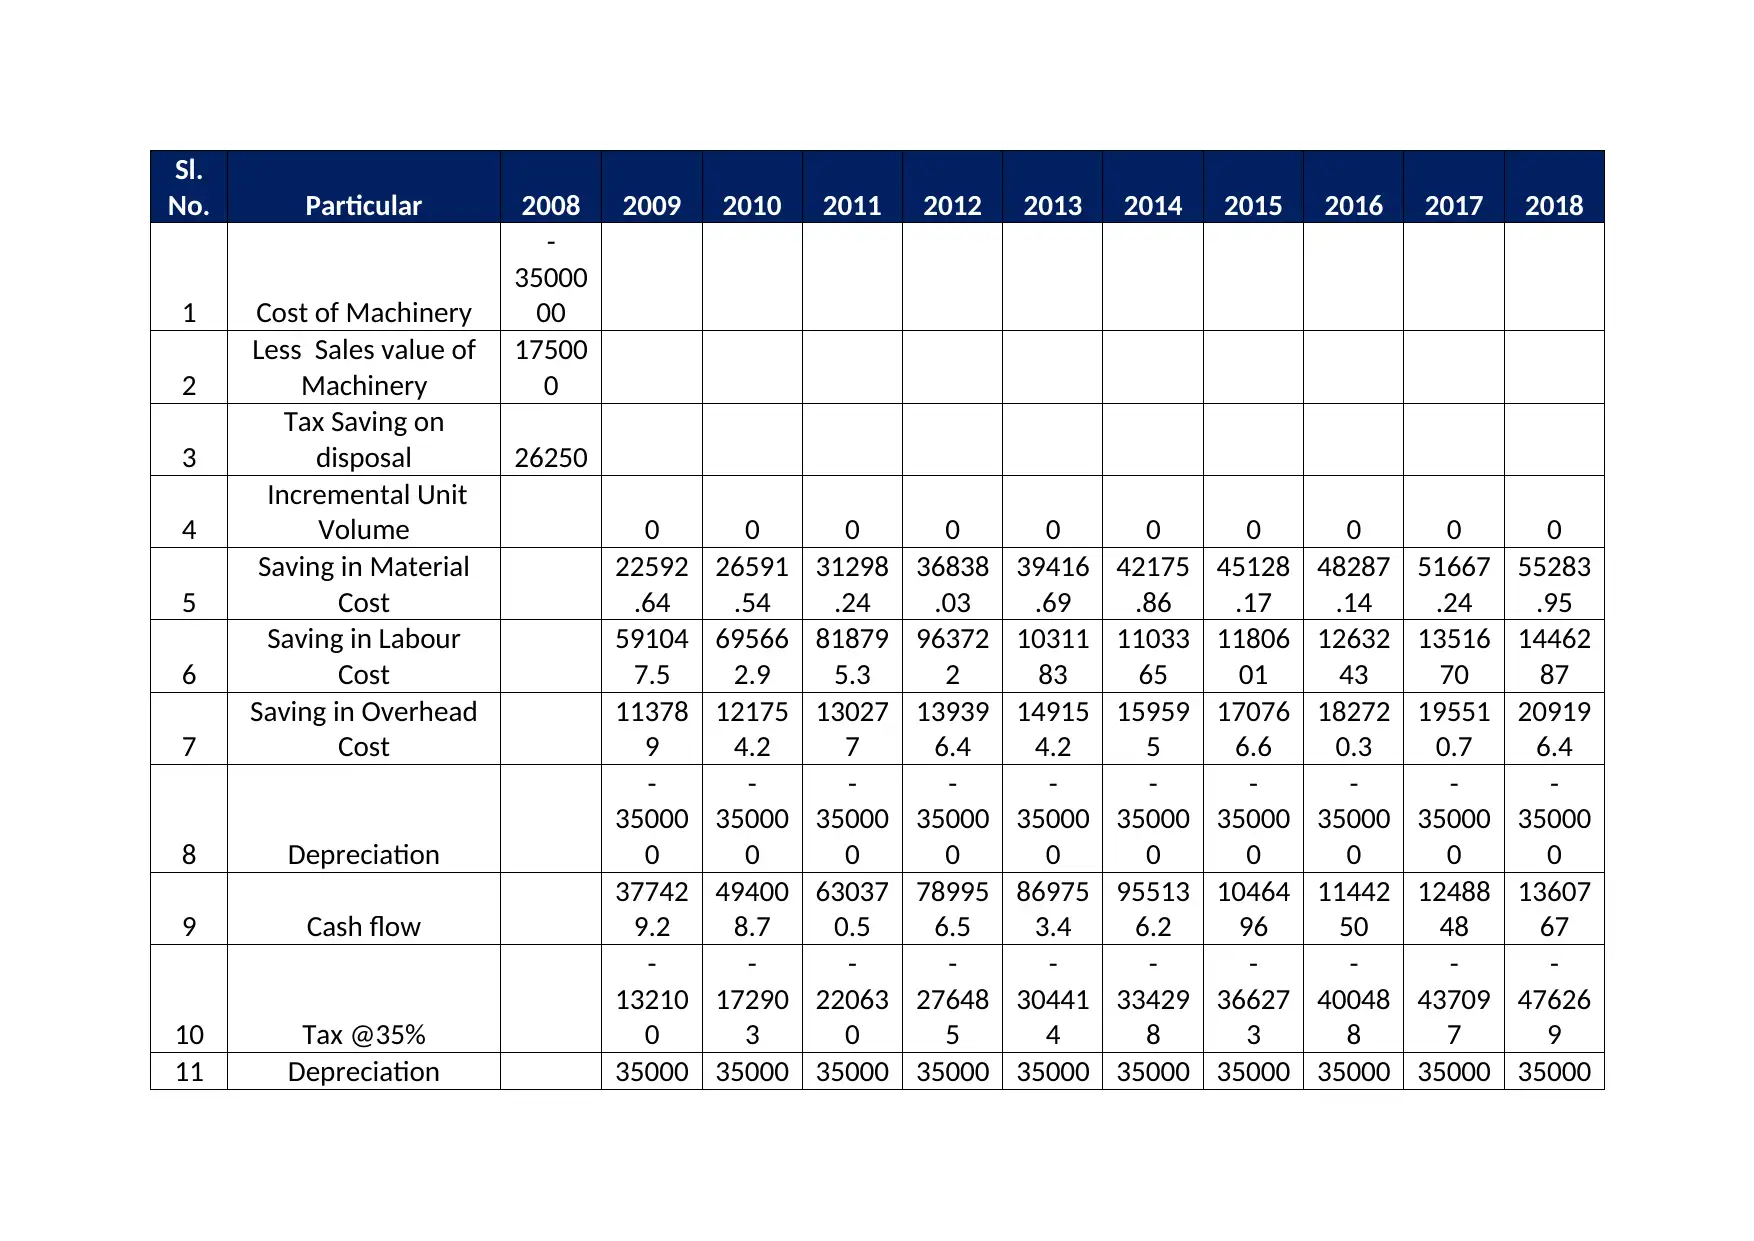
Further, the analysis has been carried out on the basis of incremental cash
flows whereby the difference between the existing cash flow and the new
cash flows on account of execution of the said project shall be taken into
consideration. On the basis of the same, a detailed simulation has been
presented here-in-below-
Mulhouse, France is planning to expand its operations by setting up a new
plant which shall be automated and shall be used to recycle and re
manufacture toner. The cost of the plant is estimated at 3.5 Million Pesos
or Euro 2,20,000. The company wishes to analyse the feasibility of the
present project based on the details provided and the assumptions
undertaken few are like the cost of Machinery for the purpose of analysis
has been taken at 3.5 Mio Peso, the residual value of machinery has been
assumed at Nil, the project has been funded by debt and equity in equal
proportion, relative Purchasing Power Parity holds good, Cost of equity is
consistent for both in Euro and in Pes, Machinery is disposed of at year
Zero, Tax loss on disposal of machinery shall be set off against other
business of Ariel,Inflation in Mexico has been assumed at 7%.
On the basis of above analysis, the discounting factor has been arrived at
9.45%. The computation of the same has been detailed here-in-below:
Computation of Hurdle rate on peso
Sl No Particulars Brief
1 Hurdle rate in Euro 8%
2 Long Term debt Rate net of tax 3.09%
3 Debt Equity ratio 1.00
4 Equity return 12.91%
5 Long Term debt Rate net of tax in peso 6%
6 Hurdle rate in Peso 9.45%
Further, the analysis has been carried out on the basis of incremental cash
flows whereby the difference between the existing cash flow and the new
cash flows on account of execution of the said project shall be taken into
consideration. On the basis of the same, a detailed simulation has been
presented here-in-below-
Sl.
No. Particular 2008 2009 2010 2011 2012 2013 2014 2015 2016 2017 2018
1 Cost of Machinery
-
35000
00
2
Less Sales value of
Machinery
17500
0
3
Tax Saving on
disposal 26250
4
Incremental Unit
Volume 0 0 0 0 0 0 0 0 0 0
5
Saving in Material
Cost
22592
.64
26591
.54
31298
.24
36838
.03
39416
.69
42175
.86
45128
.17
48287
.14
51667
.24
55283
.95
6
Saving in Labour
Cost
59104
7.5
69566
2.9
81879
5.3
96372
2
10311
83
11033
65
11806
01
12632
43
13516
70
14462
87
7
Saving in Overhead
Cost
11378
9
12175
4.2
13027
7
13939
6.4
14915
4.2
15959
5
17076
6.6
18272
0.3
19551
0.7
20919
6.4
8 Depreciation
-
35000
0
-
35000
0
-
35000
0
-
35000
0
-
35000
0
-
35000
0
-
35000
0
-
35000
0
-
35000
0
-
35000
0
9 Cash flow
37742
9.2
49400
8.7
63037
0.5
78995
6.5
86975
3.4
95513
6.2
10464
96
11442
50
12488
48
13607
67
10 Tax @35%
-
13210
0
-
17290
3
-
22063
0
-
27648
5
-
30441
4
-
33429
8
-
36627
3
-
40048
8
-
43709
7
-
47626
9
11 Depreciation 35000 35000 35000 35000 35000 35000 35000 35000 35000 35000
⊘ This is a preview!⊘
Do you want full access?
Subscribe today to unlock all pages.
Trusted by 1+ million students worldwide
0 0 0 0 0 0 0 0 0 0
12 Net Cash flow
-
32987
50
59532
9
67110
5.7
75974
0.8
86347
1.7
91533
9.7
97083
8.5
10302
22
10937
63
11617
51
12344
99
13
Discounting factor
@9.45% 1
0.913
663
0.834
781
0.762
709
0.696
859
0.636
694
0.581
724
0.531
5
0.485
612
0.443
686
0.405
38
14 Present Cash flow
-
32987
50
54393
0.3
56022
6.1
57946
0.9
60171
8
58279
1.8
56476
0.5
54756
3.4
53114
4.7
51545
3
50044
0.9
15 Net Present Value
22287
40
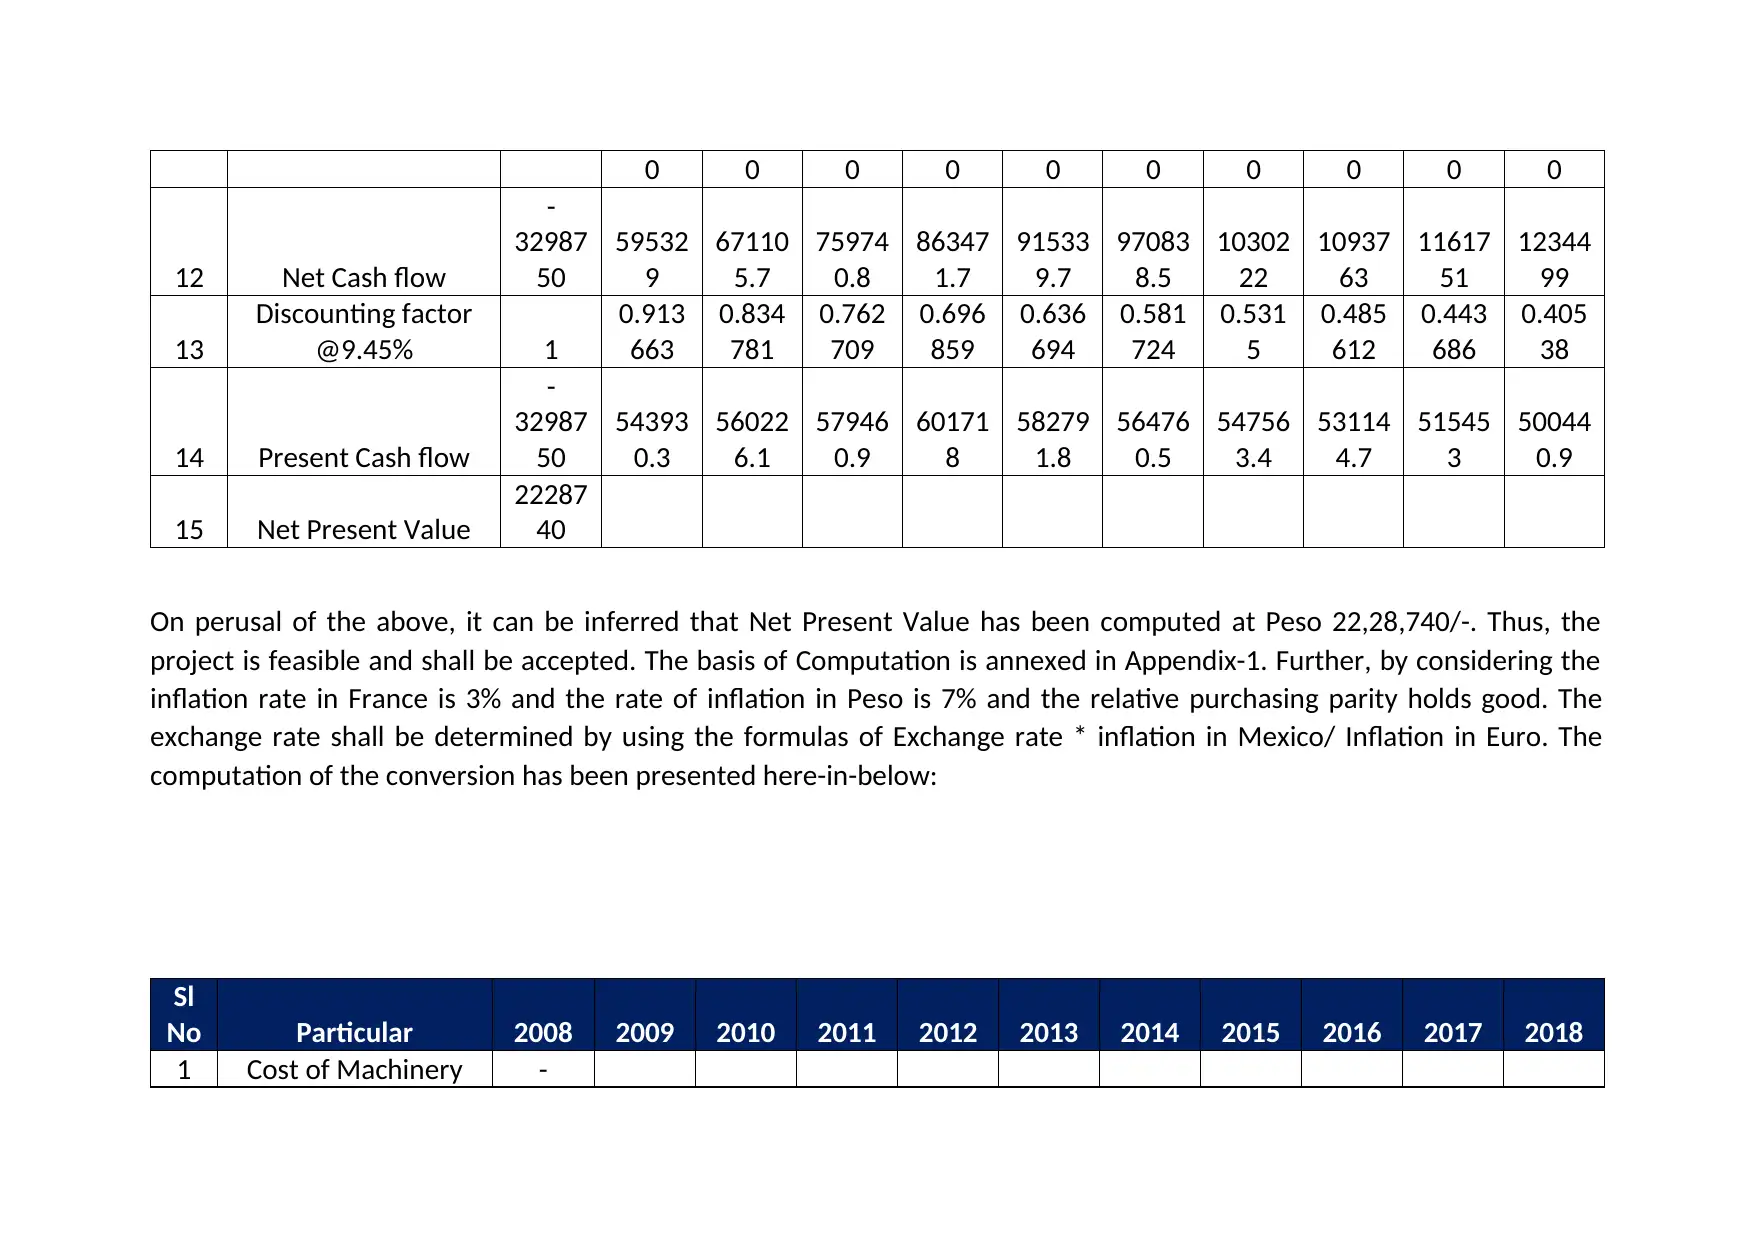
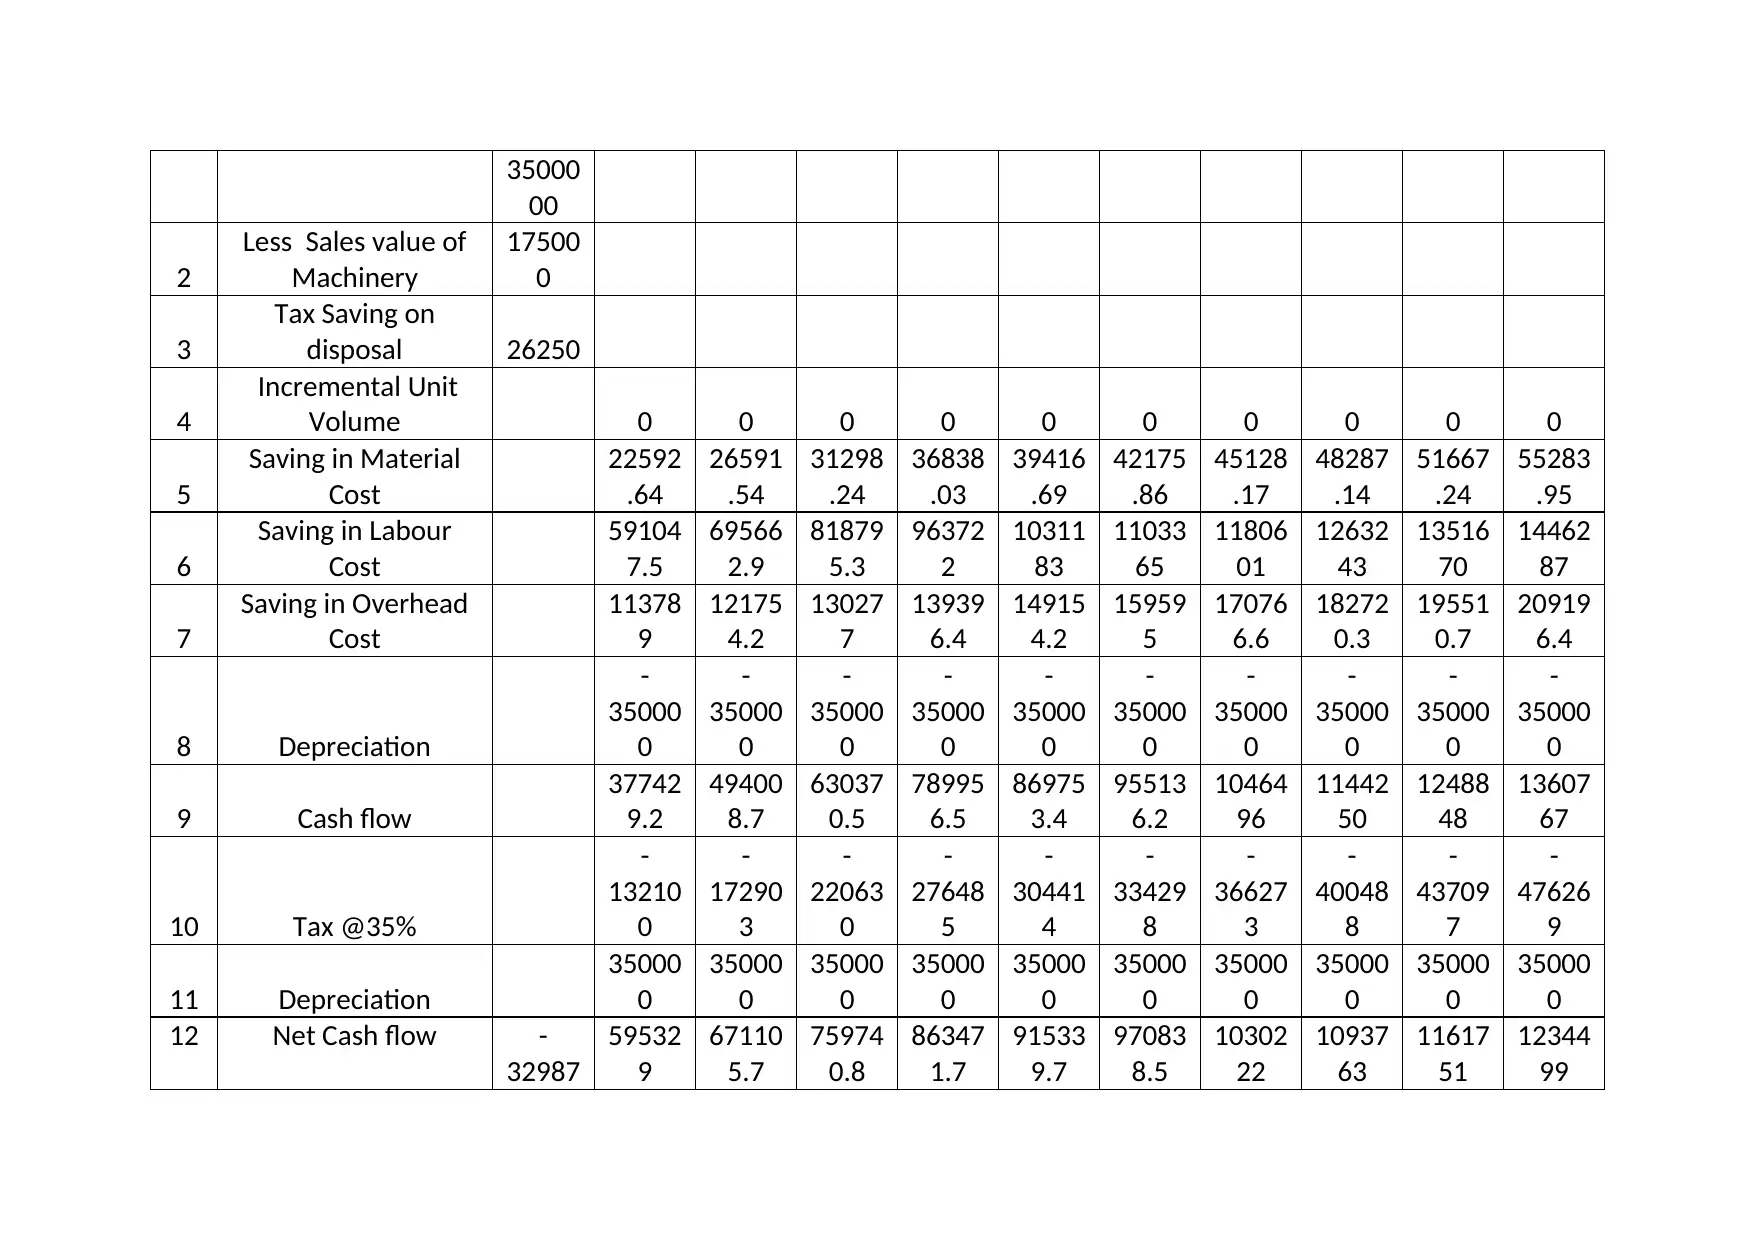
On perusal of the above, it can be inferred that Net Present Value has been computed at Peso 22,28,740/-. Thus, the
project is feasible and shall be accepted. The basis of Computation is annexed in Appendix-1. Further, by considering the
inflation rate in France is 3% and the rate of inflation in Peso is 7% and the relative purchasing parity holds good. The
exchange rate shall be determined by using the formulas of Exchange rate * inflation in Mexico/ Inflation in Euro. The
computation of the conversion has been presented here-in-below:
Sl
No Particular 2008 2009 2010 2011 2012 2013 2014 2015 2016 2017 2018
1 Cost of Machinery -
12 Net Cash flow
-
32987
50
59532
9
67110
5.7
75974
0.8
86347
1.7
91533
9.7
97083
8.5
10302
22
10937
63
11617
51
12344
99
13
Discounting factor
@9.45% 1
0.913
663
0.834
781
0.762
709
0.696
859
0.636
694
0.581
724
0.531
5
0.485
612
0.443
686
0.405
38
14 Present Cash flow
-
32987
50
54393
0.3
56022
6.1
57946
0.9
60171
8
58279
1.8
56476
0.5
54756
3.4
53114
4.7
51545
3
50044
0.9
15 Net Present Value
22287
40
On perusal of the above, it can be inferred that Net Present Value has been computed at Peso 22,28,740/-. Thus, the
project is feasible and shall be accepted. The basis of Computation is annexed in Appendix-1. Further, by considering the
inflation rate in France is 3% and the rate of inflation in Peso is 7% and the relative purchasing parity holds good. The
exchange rate shall be determined by using the formulas of Exchange rate * inflation in Mexico/ Inflation in Euro. The
computation of the conversion has been presented here-in-below:
Sl
No Particular 2008 2009 2010 2011 2012 2013 2014 2015 2016 2017 2018
1 Cost of Machinery -
Paraphrase This Document
Need a fresh take? Get an instant paraphrase of this document with our AI Paraphraser
35000
00
2
Less Sales value of
Machinery
17500
0
3
Tax Saving on
disposal 26250
4
Incremental Unit
Volume 0 0 0 0 0 0 0 0 0 0
5
Saving in Material
Cost
22592
.64
26591
.54
31298
.24
36838
.03
39416
.69
42175
.86
45128
.17
48287
.14
51667
.24
55283
.95
6
Saving in Labour
Cost
59104
7.5
69566
2.9
81879
5.3
96372
2
10311
83
11033
65
11806
01
12632
43
13516
70
14462
87
7
Saving in Overhead
Cost
11378
9
12175
4.2
13027
7
13939
6.4
14915
4.2
15959
5
17076
6.6
18272
0.3
19551
0.7
20919
6.4
8 Depreciation
-
35000
0
-
35000
0
-
35000
0
-
35000
0
-
35000
0
-
35000
0
-
35000
0
-
35000
0
-
35000
0
-
35000
0
9 Cash flow
37742
9.2
49400
8.7
63037
0.5
78995
6.5
86975
3.4
95513
6.2
10464
96
11442
50
12488
48
13607
67
10 Tax @35%
-
13210
0
-
17290
3
-
22063
0
-
27648
5
-
30441
4
-
33429
8
-
36627
3
-
40048
8
-
43709
7
-
47626
9
11 Depreciation
35000
0
35000
0
35000
0
35000
0
35000
0
35000
0
35000
0
35000
0
35000
0
35000
0
12 Net Cash flow -
32987
59532
9
67110
5.7
75974
0.8
86347
1.7
91533
9.7
97083
8.5
10302
22
10937
63
11617
51
12344
99
50
13
Discounting factor
@9.45% 1
0.913
663
0.834
781
0.762
709
0.696
859
0.636
694
0.581
724
0.531
5
0.485
612
0.443
686
0.405
38
14 Present Cash flow
-
32987
50
54393
0.3
56022
6.1
57946
0.9
60171
8
58279
1.8
56476
0.5
54756
3.4
53114
4.7
51545
3
50044
0.9
15 Net Present Value
22287
40
16
Net Cash flow in
Peso
-
32987
50
59532
9
67110
5.7
75974
0.8
86347
1.7
91533
9.7
97083
8.5
10302
22
10937
63
11617
51
12344
99
17 Peso/ Euro 15.99
16.61
097
17.25
606
17.92
62
18.62
236
19.34
556
20.09
684
20.87
73
21.68
807
22.53
032
23.40
529
18
Discounting factor
@9.45% 1
0.913
659
0.834
773
0.762
698
0.696
846
0.636
68
0.581
708
0.531
483
0.485
595
0.443
668
0.405
361
19 Present Cash flow
-
20630
1
32745
.09
32465
.18
32324
.37 32311
30124
.67
28101
.18
26226
.85
24489
.29
22877
.25
21380
.56
20 Net Present Value
76744
.62
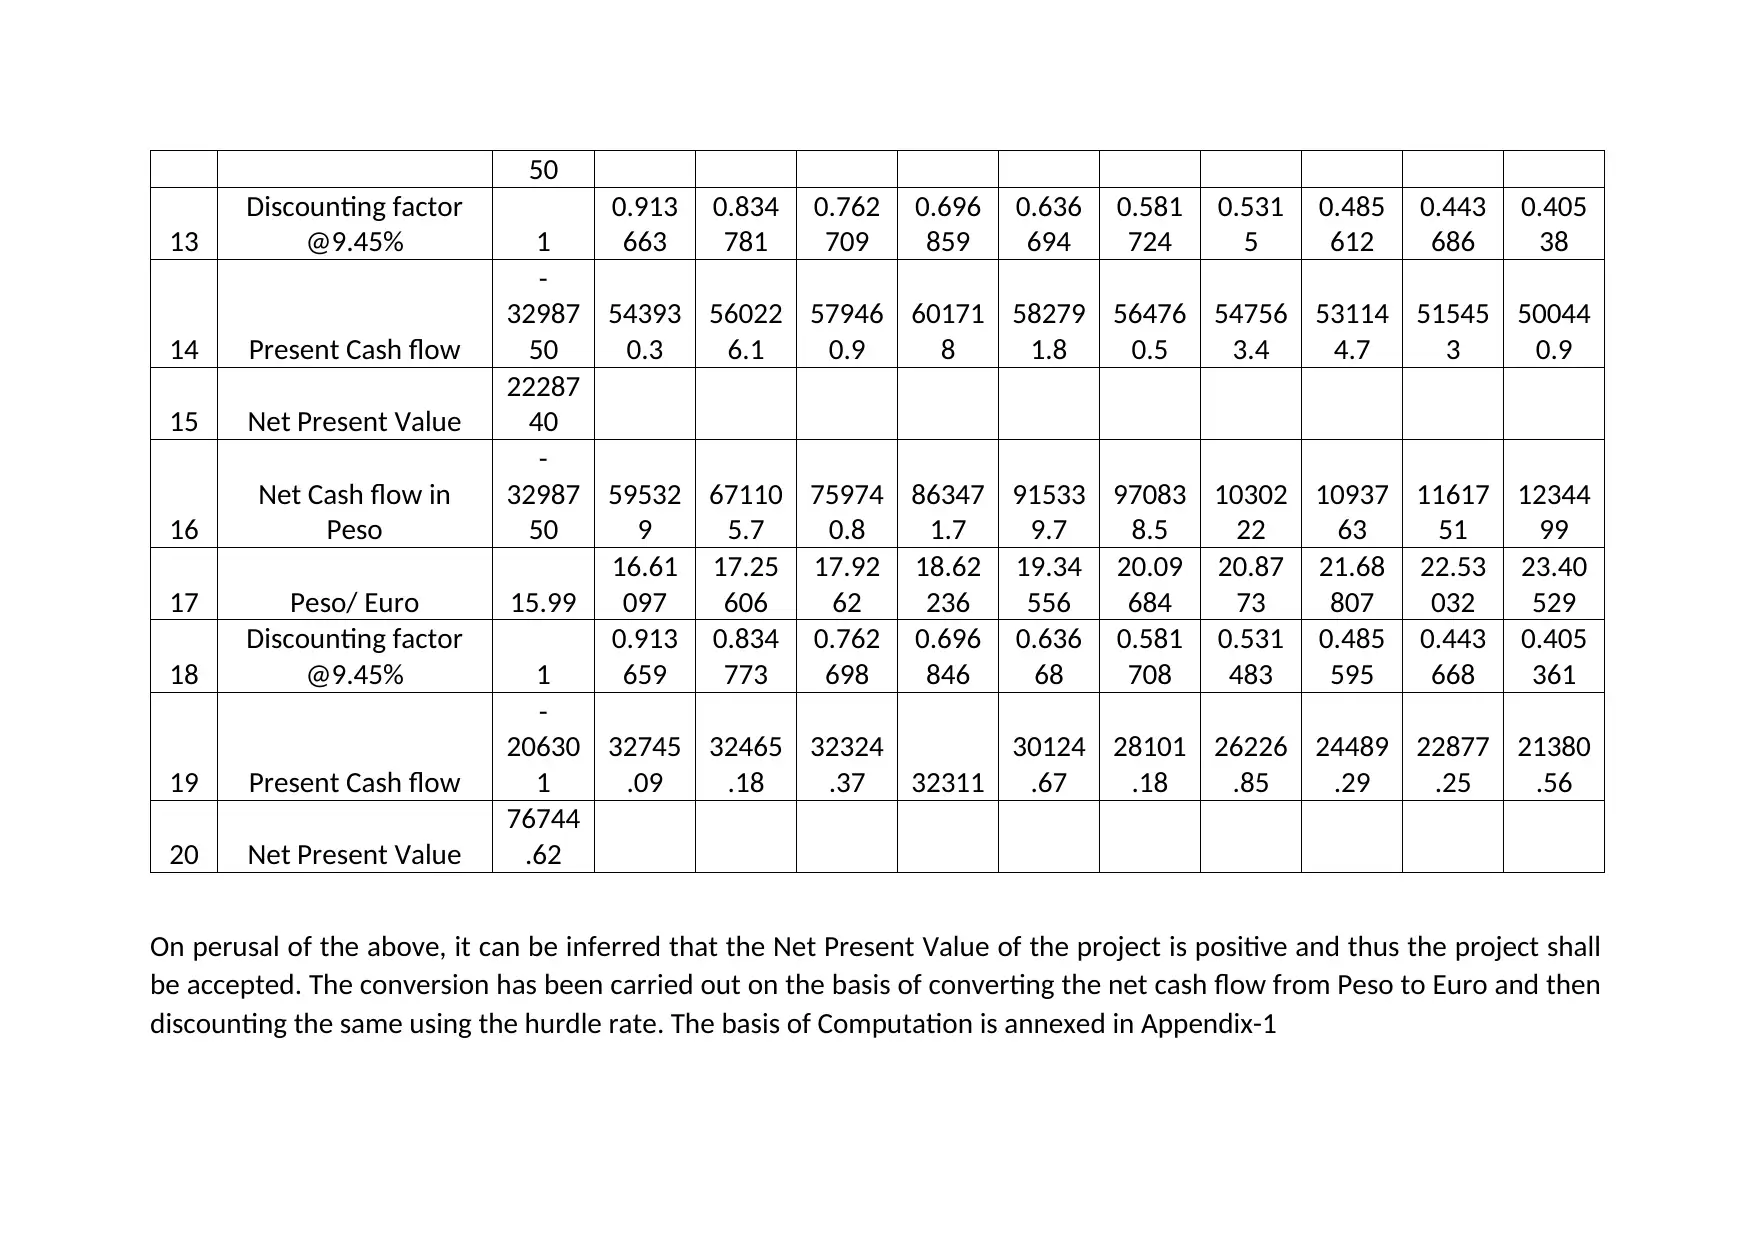
On perusal of the above, it can be inferred that the Net Present Value of the project is positive and thus the project shall
be accepted. The conversion has been carried out on the basis of converting the net cash flow from Peso to Euro and then
discounting the same using the hurdle rate. The basis of Computation is annexed in Appendix-1
13
Discounting factor
@9.45% 1
0.913
663
0.834
781
0.762
709
0.696
859
0.636
694
0.581
724
0.531
5
0.485
612
0.443
686
0.405
38
14 Present Cash flow
-
32987
50
54393
0.3
56022
6.1
57946
0.9
60171
8
58279
1.8
56476
0.5
54756
3.4
53114
4.7
51545
3
50044
0.9
15 Net Present Value
22287
40
16
Net Cash flow in
Peso
-
32987
50
59532
9
67110
5.7
75974
0.8
86347
1.7
91533
9.7
97083
8.5
10302
22
10937
63
11617
51
12344
99
17 Peso/ Euro 15.99
16.61
097
17.25
606
17.92
62
18.62
236
19.34
556
20.09
684
20.87
73
21.68
807
22.53
032
23.40
529
18
Discounting factor
@9.45% 1
0.913
659
0.834
773
0.762
698
0.696
846
0.636
68
0.581
708
0.531
483
0.485
595
0.443
668
0.405
361
19 Present Cash flow
-
20630
1
32745
.09
32465
.18
32324
.37 32311
30124
.67
28101
.18
26226
.85
24489
.29
22877
.25
21380
.56
20 Net Present Value
76744
.62
On perusal of the above, it can be inferred that the Net Present Value of the project is positive and thus the project shall
be accepted. The conversion has been carried out on the basis of converting the net cash flow from Peso to Euro and then
discounting the same using the hurdle rate. The basis of Computation is annexed in Appendix-1
⊘ This is a preview!⊘
Do you want full access?
Subscribe today to unlock all pages.
Trusted by 1+ million students worldwide
In the present context, Groupe Ariel S.A., an entity headquartered in Mulhouse, France is planning to expand its
operations by setting up a new plant which shall be automated and shall be used to recycle and re manufacture toner. The
cost of the plant is estimated at 3.5 Million Pesos or Euro 2,20,000. The company wishes to analyse the feasibility of the
present project based on the details provided and the assumptions undertaken are listed as, The cost of Machinery for the
purpose of analysis has been taken at Euro 2,20,000, The residual value of machinery has been assumed at Nil; The project
has been funded by debt and equity in equal proportion; Relative Purchasing Power Parity holds good; Cost of equity is
consistent for both in Euro and in Peso, Machinery is disposed of at year Zero; Tax loss on disposal of machinery shall be
set off against other business of Ariel; Inflation in Mexico has been assumed at 7% and in France at 3%.
The computation of the same has been detailed here-in-below:
Paraphrase This Document
Need a fresh take? Get an instant paraphrase of this document with our AI Paraphraser
Sl
No Particular 2008 2009 2010 2011 2012 2013 2014 2015 2016 2017 2018
1 Cost of Machinery
-
22000
0
2
Less Sales value of
Machinery
10944
.34
3
Tax Saving on
disposal
1641.
651
4
Incremental Unit
Volume 0 0 0 0 0 0 0 0 0 0
5
Saving in Material
Cost
1360.
104
1540.
997
1745.
95
1978.
161
2037.
506
2098.
631
2161.
59
2226.
438
2293.
231
2362.
028
6 Saving in Labour Cost
35581
.76
40314
.13
45675
.91
51750
.81
53303
.33
54902
.43
56549
.5
58245
.99
59993
.37
61793
.17
7
Saving in Overhead
Cost
6850.
232
7055.
739
7267.
411
7485.
433
7709.
996
7941.
296
8179.
535
8424.
921
8677.
669
8937.
999
8 Depreciation
-
22000
-
22000
-
22000
-
22000
-
22000
-
22000
-
22000
-
22000
-
22000
-
22000
9 Cash flow
21792
.09
26910
.87
32689
.27
39214
.4
41050
.83
42942
.36
44890
.63
46897
.35
48964
.27
51093
.19
10 Tax @35%
-
7627.
23
-
9418.
8
-
11441
.2
-
13725
-
14367
.8
-
15029
.8
-
15711
.7
-
16414
.1
-
17137
.5
-
17882
.6
11 Depreciation 22000 22000 22000 22000 22000 22000 22000 22000 22000 22000
Sl
No Particular 2008 2009 2010 2011 2012 2013 2014 2015 2016 2017 2018
12 Net Cash flow
-
20741
4
36164
.86
39492
.06
43248
.03
47489
.36
48683
.04
49912
.53
51178
.91
52483
.28
53826
.77
55210
.58
13
Discounting factor
@8% 1
0.925
926
0.857
339
0.793
832
0.735
03
0.680
583
0.630
17
0.583
49
0.540
269
0.500
249
0.463
193
14 Present Cash flow
-
20741
4
33485
.98
33858
.08
34331
.68
34906
.1
33132
.86
31453
.36
29862
.4
28355
.08
26926
.79
25573
.18
15 Net Present Value
10447
1.5
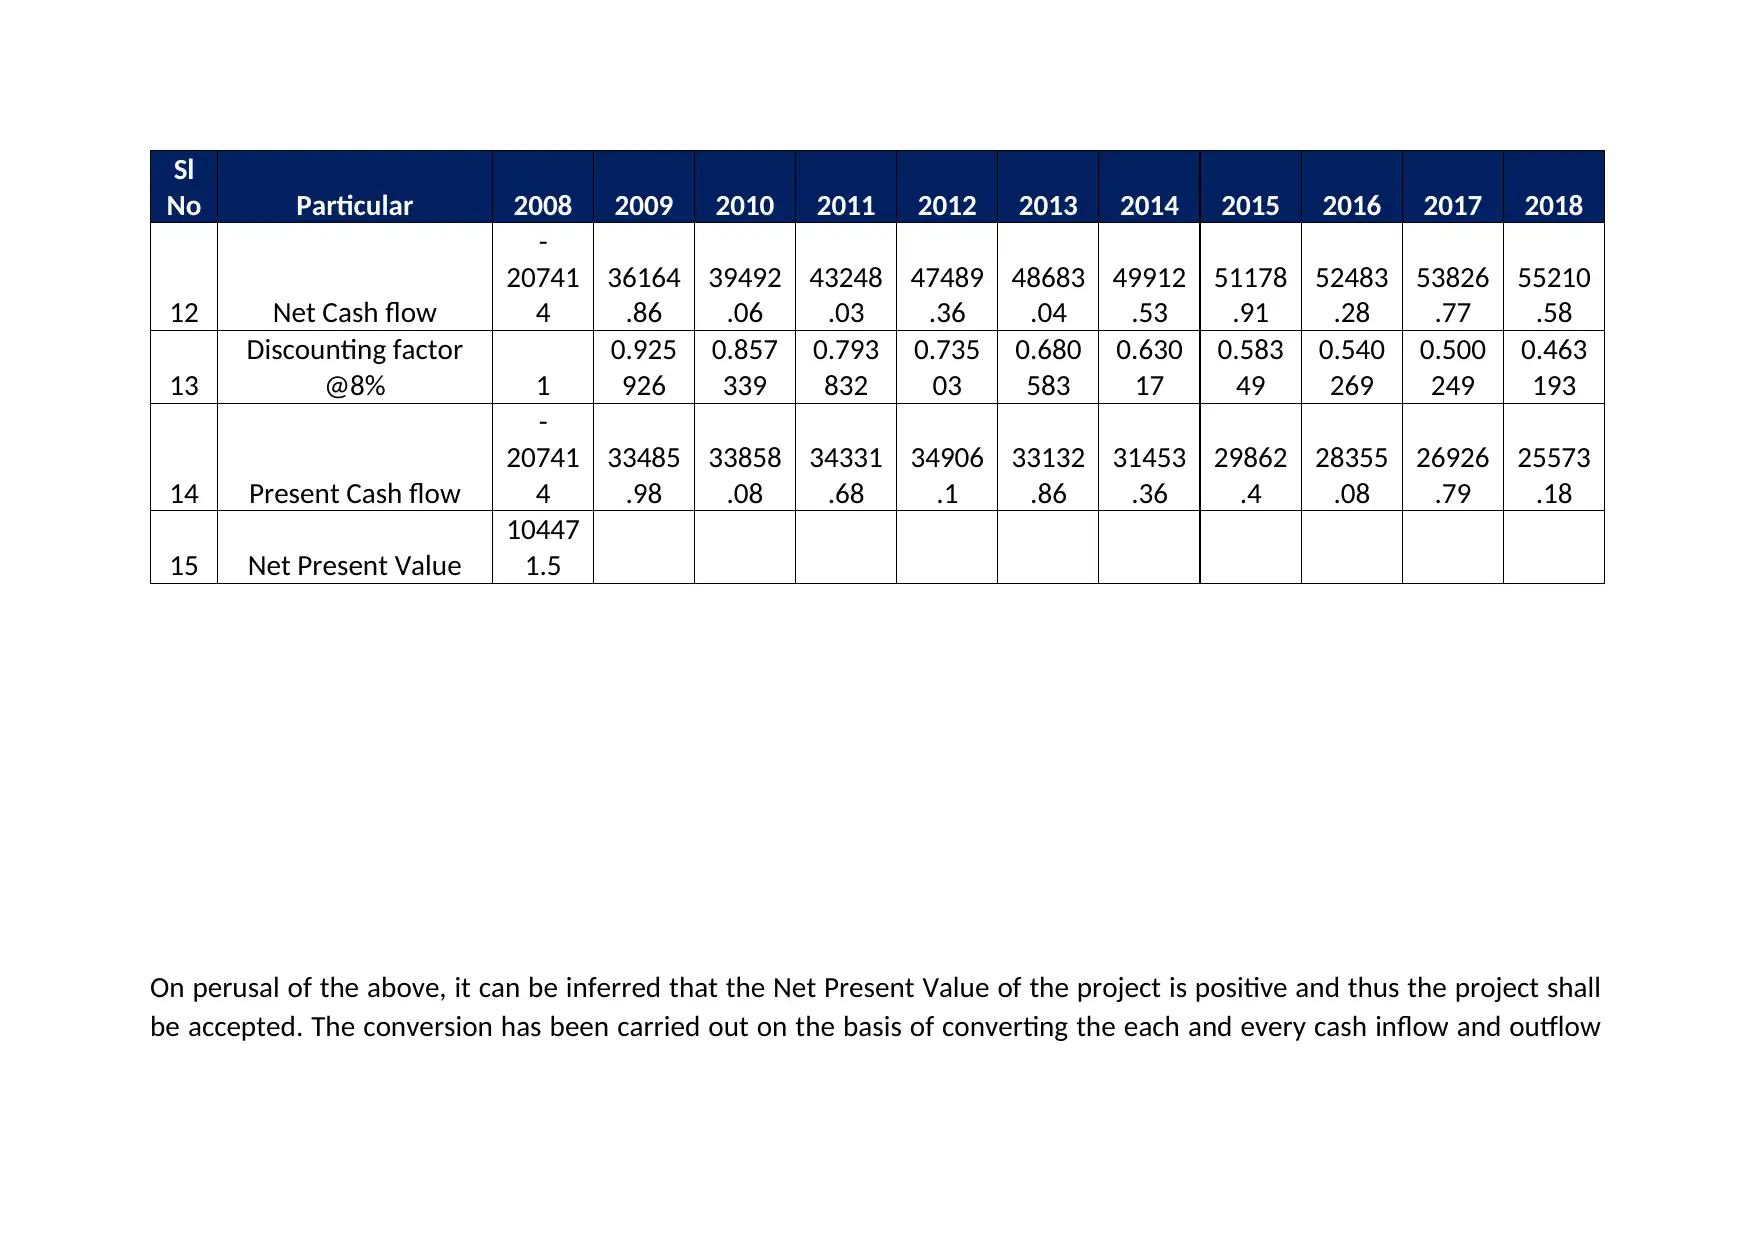
On perusal of the above, it can be inferred that the Net Present Value of the project is positive and thus the project shall
be accepted. The conversion has been carried out on the basis of converting the each and every cash inflow and outflow
No Particular 2008 2009 2010 2011 2012 2013 2014 2015 2016 2017 2018
12 Net Cash flow
-
20741
4
36164
.86
39492
.06
43248
.03
47489
.36
48683
.04
49912
.53
51178
.91
52483
.28
53826
.77
55210
.58
13
Discounting factor
@8% 1
0.925
926
0.857
339
0.793
832
0.735
03
0.680
583
0.630
17
0.583
49
0.540
269
0.500
249
0.463
193
14 Present Cash flow
-
20741
4
33485
.98
33858
.08
34331
.68
34906
.1
33132
.86
31453
.36
29862
.4
28355
.08
26926
.79
25573
.18
15 Net Present Value
10447
1.5
On perusal of the above, it can be inferred that the Net Present Value of the project is positive and thus the project shall
be accepted. The conversion has been carried out on the basis of converting the each and every cash inflow and outflow
⊘ This is a preview!⊘
Do you want full access?
Subscribe today to unlock all pages.
Trusted by 1+ million students worldwide
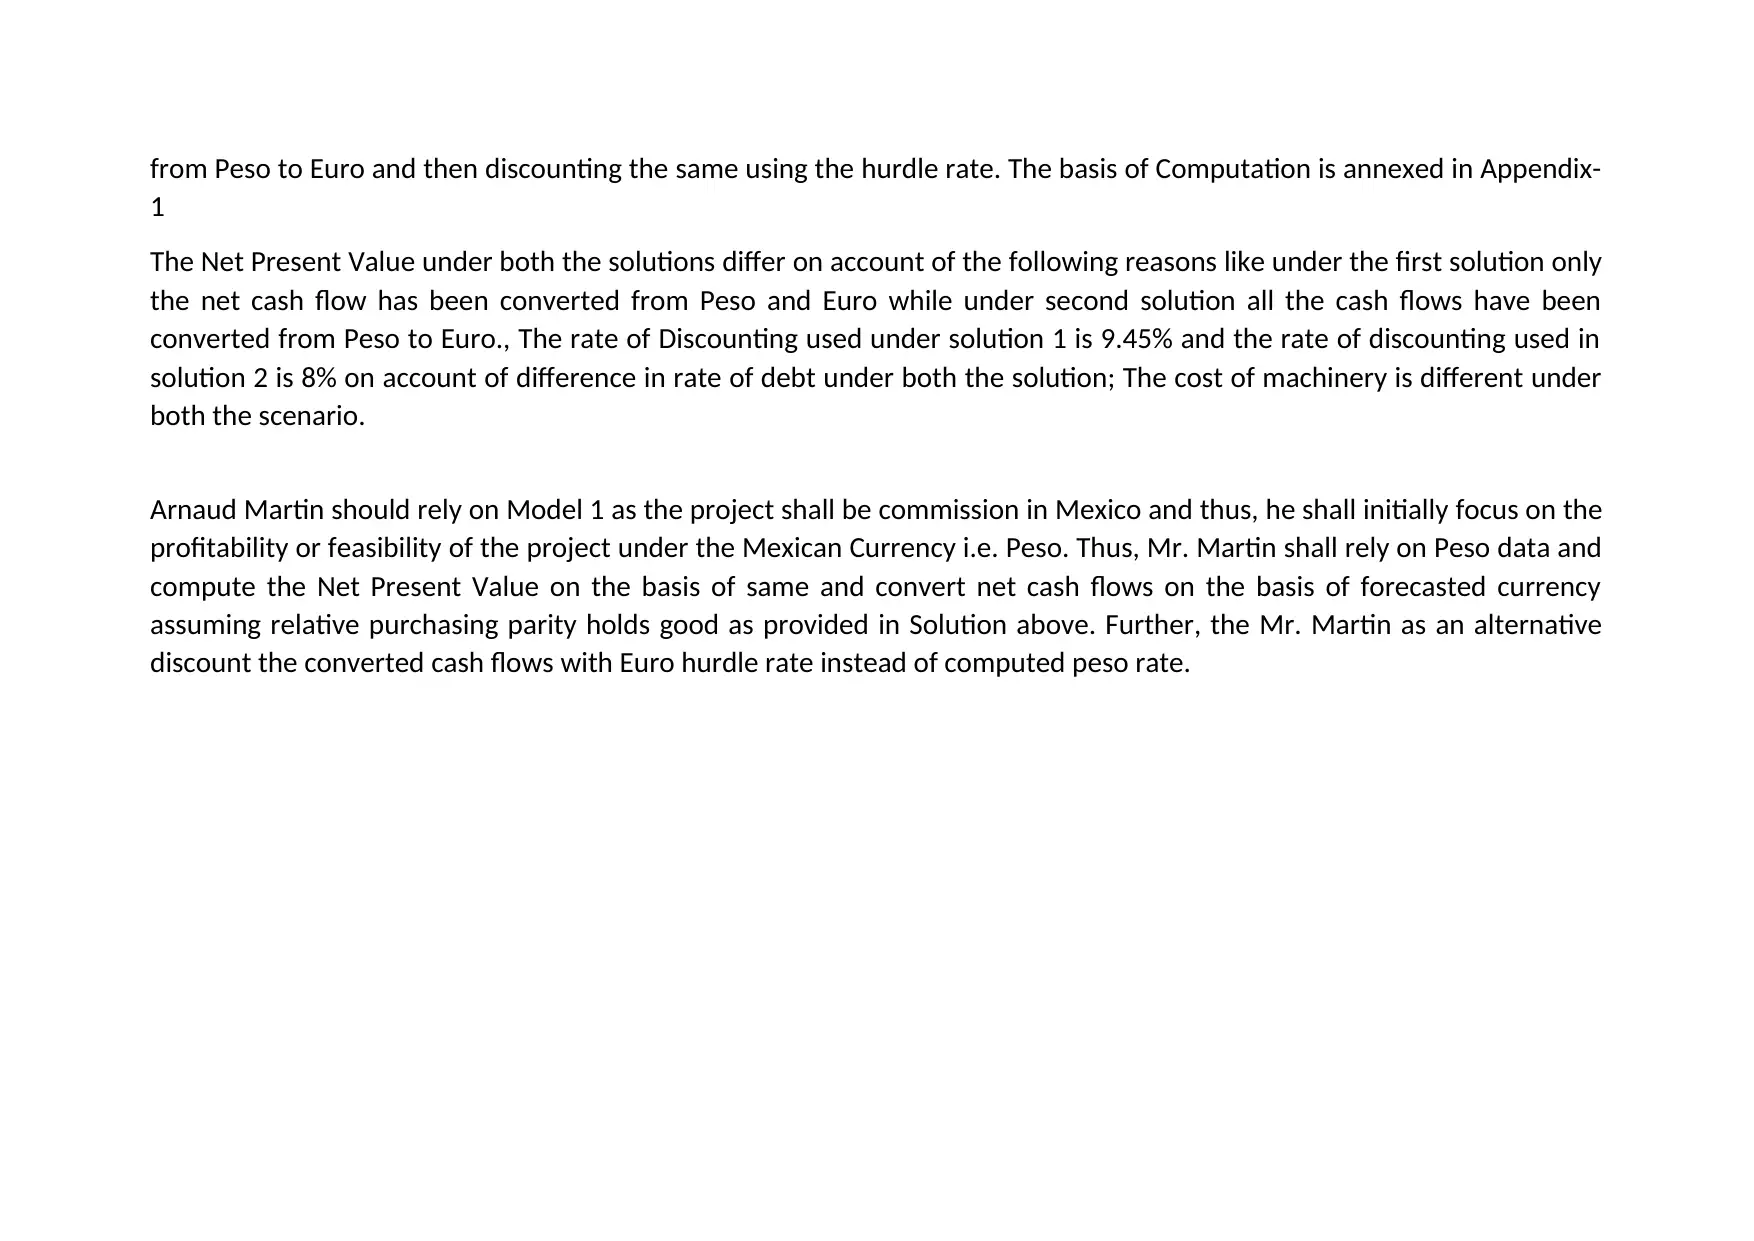
from Peso to Euro and then discounting the same using the hurdle rate. The basis of Computation is annexed in Appendix-
1
The Net Present Value under both the solutions differ on account of the following reasons like under the first solution only
the net cash flow has been converted from Peso and Euro while under second solution all the cash flows have been
converted from Peso to Euro., The rate of Discounting used under solution 1 is 9.45% and the rate of discounting used in
solution 2 is 8% on account of difference in rate of debt under both the solution; The cost of machinery is different under
both the scenario.
Arnaud Martin should rely on Model 1 as the project shall be commission in Mexico and thus, he shall initially focus on the
profitability or feasibility of the project under the Mexican Currency i.e. Peso. Thus, Mr. Martin shall rely on Peso data and
compute the Net Present Value on the basis of same and convert net cash flows on the basis of forecasted currency
assuming relative purchasing parity holds good as provided in Solution above. Further, the Mr. Martin as an alternative
discount the converted cash flows with Euro hurdle rate instead of computed peso rate.
Paraphrase This Document
Need a fresh take? Get an instant paraphrase of this document with our AI Paraphraser
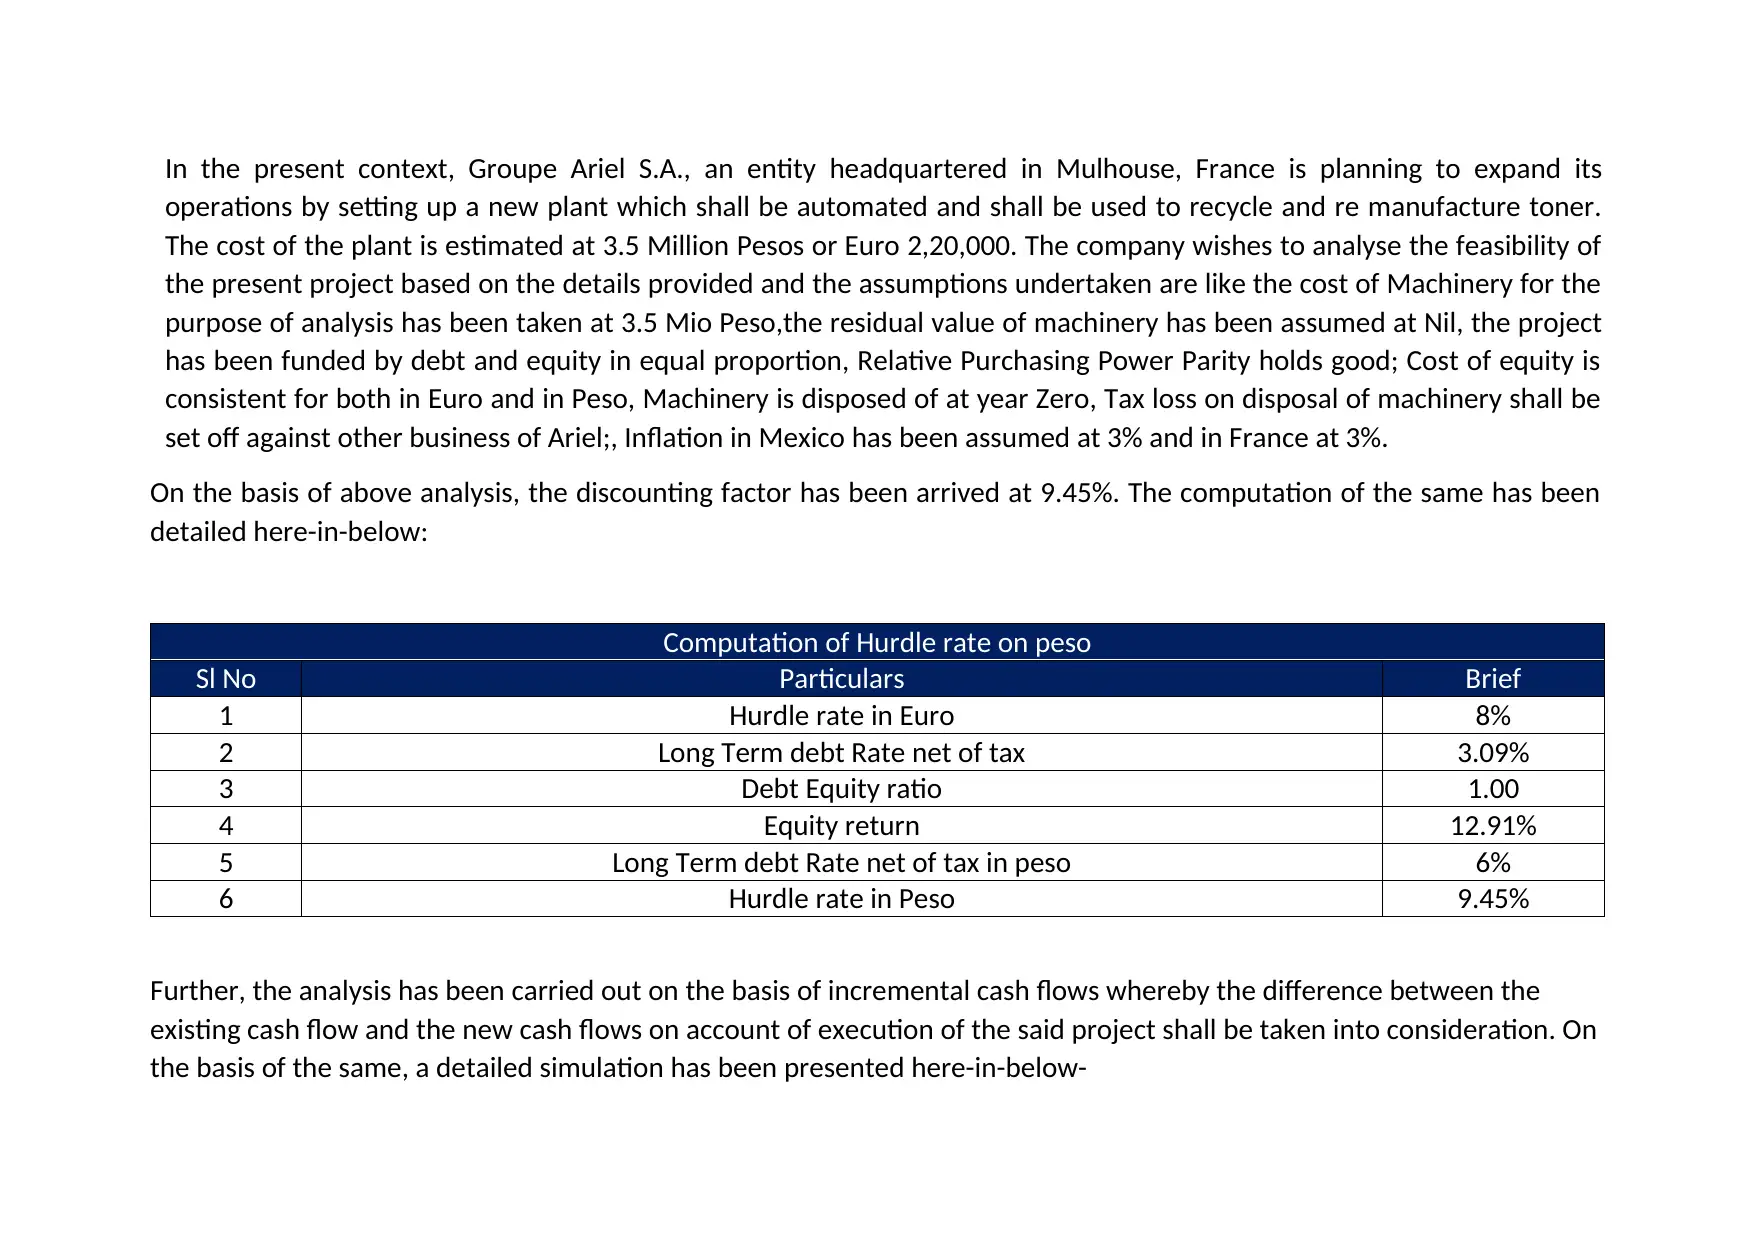
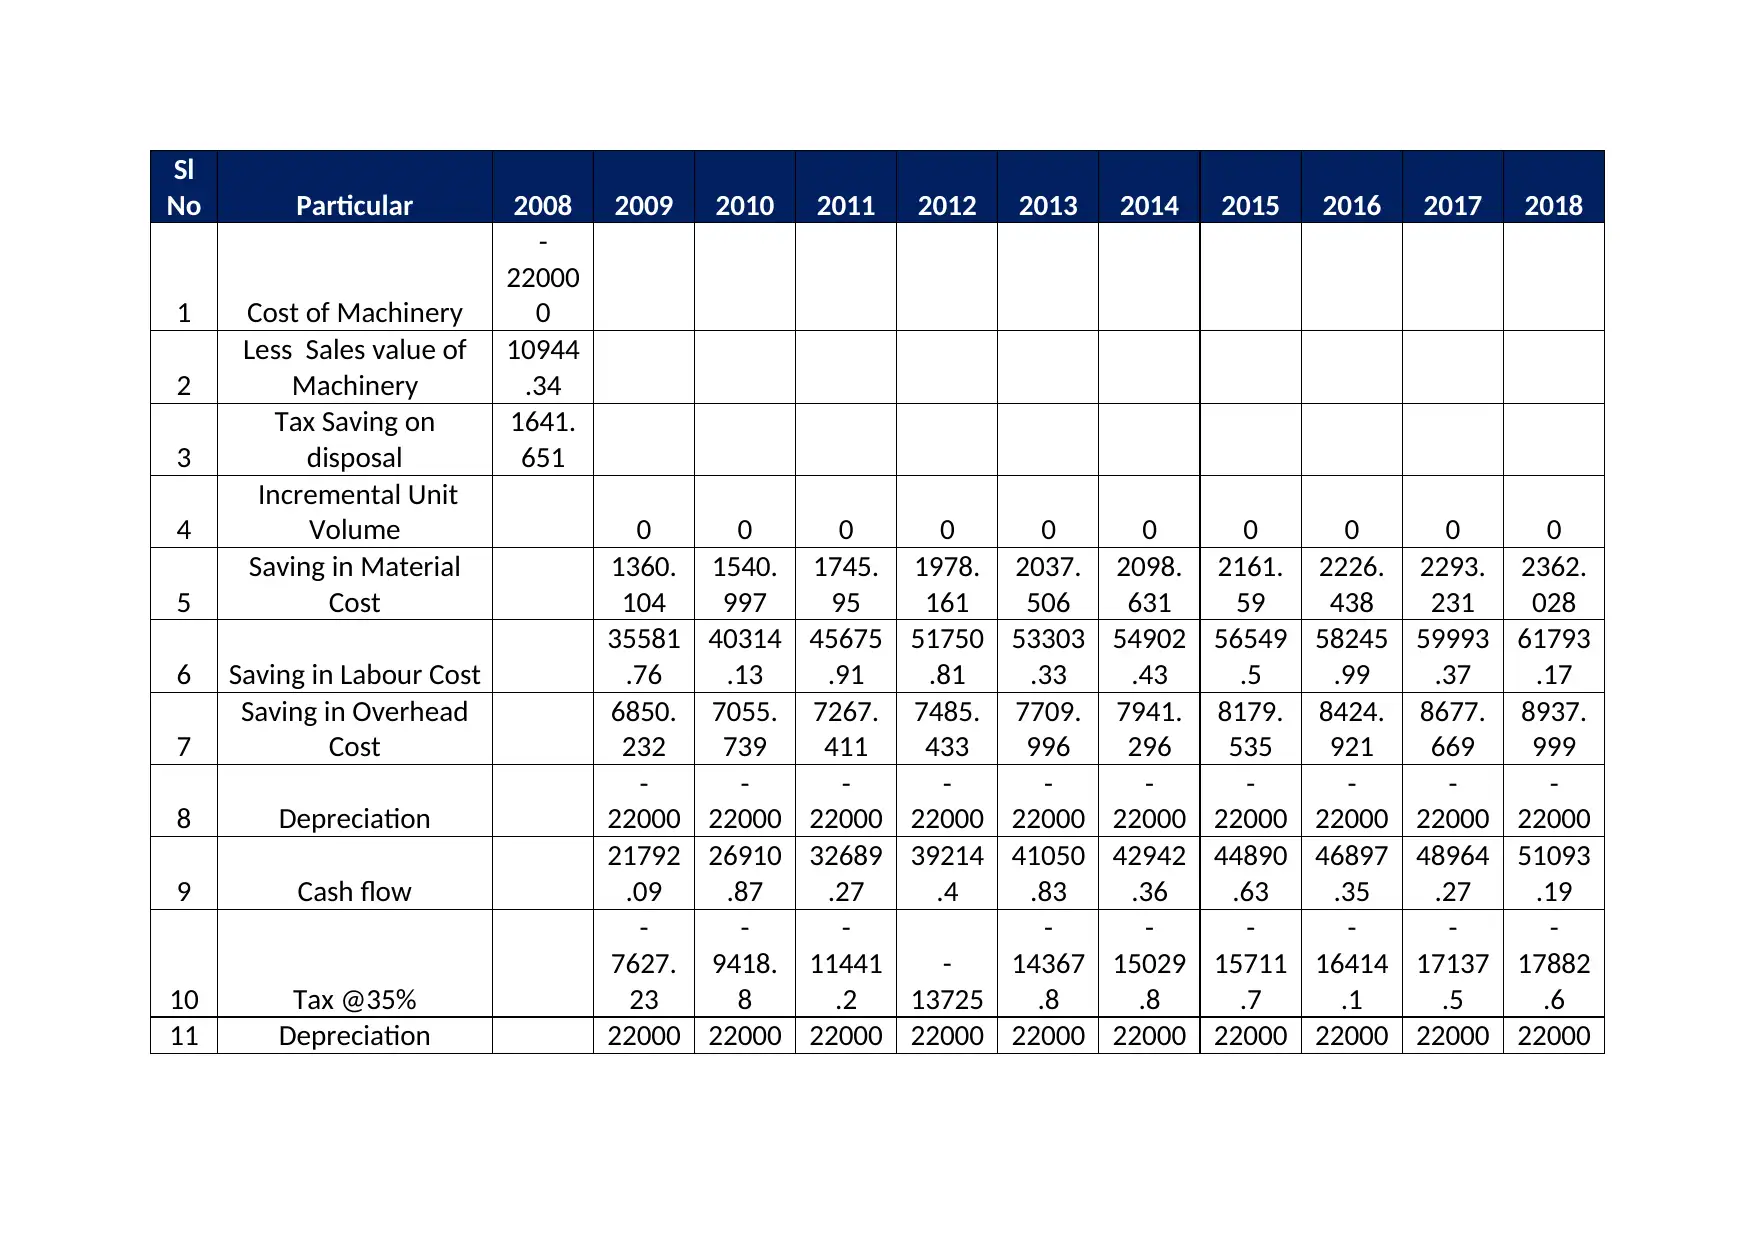
In the present context, Groupe Ariel S.A., an entity headquartered in Mulhouse, France is planning to expand its
operations by setting up a new plant which shall be automated and shall be used to recycle and re manufacture toner.
The cost of the plant is estimated at 3.5 Million Pesos or Euro 2,20,000. The company wishes to analyse the feasibility of
the present project based on the details provided and the assumptions undertaken are like the cost of Machinery for the
purpose of analysis has been taken at 3.5 Mio Peso,the residual value of machinery has been assumed at Nil, the project
has been funded by debt and equity in equal proportion, Relative Purchasing Power Parity holds good; Cost of equity is
consistent for both in Euro and in Peso, Machinery is disposed of at year Zero, Tax loss on disposal of machinery shall be
set off against other business of Ariel;, Inflation in Mexico has been assumed at 3% and in France at 3%.
On the basis of above analysis, the discounting factor has been arrived at 9.45%. The computation of the same has been
detailed here-in-below:
Computation of Hurdle rate on peso
Sl No Particulars Brief
1 Hurdle rate in Euro 8%
2 Long Term debt Rate net of tax 3.09%
3 Debt Equity ratio 1.00
4 Equity return 12.91%
5 Long Term debt Rate net of tax in peso 6%
6 Hurdle rate in Peso 9.45%
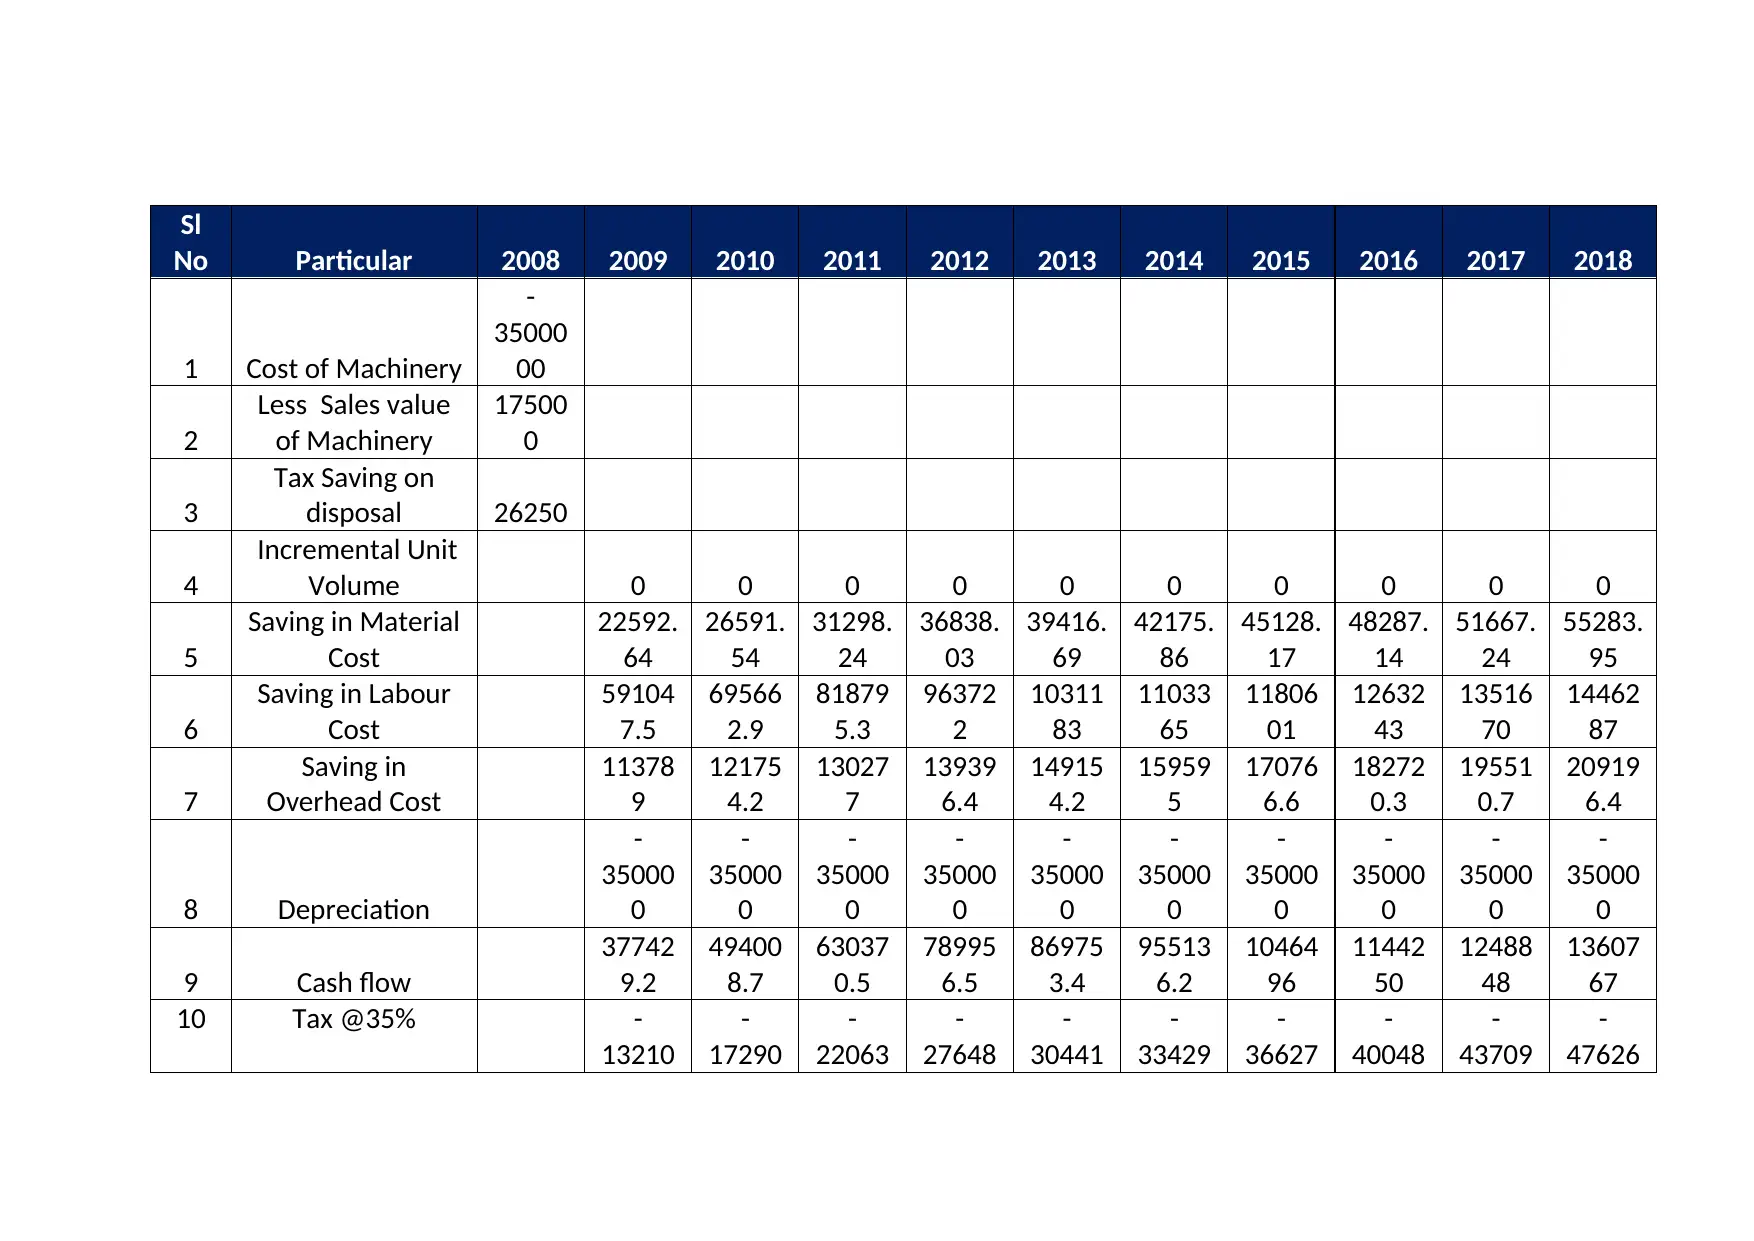
Further, the analysis has been carried out on the basis of incremental cash flows whereby the difference between the
existing cash flow and the new cash flows on account of execution of the said project shall be taken into consideration. On
the basis of the same, a detailed simulation has been presented here-in-below-
operations by setting up a new plant which shall be automated and shall be used to recycle and re manufacture toner.
The cost of the plant is estimated at 3.5 Million Pesos or Euro 2,20,000. The company wishes to analyse the feasibility of
the present project based on the details provided and the assumptions undertaken are like the cost of Machinery for the
purpose of analysis has been taken at 3.5 Mio Peso,the residual value of machinery has been assumed at Nil, the project
has been funded by debt and equity in equal proportion, Relative Purchasing Power Parity holds good; Cost of equity is
consistent for both in Euro and in Peso, Machinery is disposed of at year Zero, Tax loss on disposal of machinery shall be
set off against other business of Ariel;, Inflation in Mexico has been assumed at 3% and in France at 3%.
On the basis of above analysis, the discounting factor has been arrived at 9.45%. The computation of the same has been
detailed here-in-below:
Computation of Hurdle rate on peso
Sl No Particulars Brief
1 Hurdle rate in Euro 8%
2 Long Term debt Rate net of tax 3.09%
3 Debt Equity ratio 1.00
4 Equity return 12.91%
5 Long Term debt Rate net of tax in peso 6%
6 Hurdle rate in Peso 9.45%
Further, the analysis has been carried out on the basis of incremental cash flows whereby the difference between the
existing cash flow and the new cash flows on account of execution of the said project shall be taken into consideration. On
the basis of the same, a detailed simulation has been presented here-in-below-
Sl
No Particular 2008 2009 2010 2011 2012 2013 2014 2015 2016 2017 2018
1 Cost of Machinery
-
35000
00
2
Less Sales value
of Machinery
17500
0
3
Tax Saving on
disposal 26250
4
Incremental Unit
Volume 0 0 0 0 0 0 0 0 0 0
5
Saving in Material
Cost
22592.
64
26591.
54
31298.
24
36838.
03
39416.
69
42175.
86
45128.
17
48287.
14
51667.
24
55283.
95
6
Saving in Labour
Cost
59104
7.5
69566
2.9
81879
5.3
96372
2
10311
83
11033
65
11806
01
12632
43
13516
70
14462
87
7
Saving in
Overhead Cost
11378
9
12175
4.2
13027
7
13939
6.4
14915
4.2
15959
5
17076
6.6
18272
0.3
19551
0.7
20919
6.4
8 Depreciation
-
35000
0
-
35000
0
-
35000
0
-
35000
0
-
35000
0
-
35000
0
-
35000
0
-
35000
0
-
35000
0
-
35000
0
9 Cash flow
37742
9.2
49400
8.7
63037
0.5
78995
6.5
86975
3.4
95513
6.2
10464
96
11442
50
12488
48
13607
67
10 Tax @35% -
13210
-
17290
-
22063
-
27648
-
30441
-
33429
-
36627
-
40048
-
43709
-
47626
⊘ This is a preview!⊘
Do you want full access?
Subscribe today to unlock all pages.
Trusted by 1+ million students worldwide
1 out of 19

Your All-in-One AI-Powered Toolkit for Academic Success.
+13062052269
info@desklib.com
Available 24*7 on WhatsApp / Email
![[object Object]](/_next/static/media/star-bottom.7253800d.svg)
Unlock your academic potential
Copyright © 2020–2026 A2Z Services. All Rights Reserved. Developed and managed by ZUCOL.