Corporate Financial Management: ALL Stock Performance Analysis Report
VerifiedAdded on 2022/10/09
|10
|1183
|85
Report
AI Summary
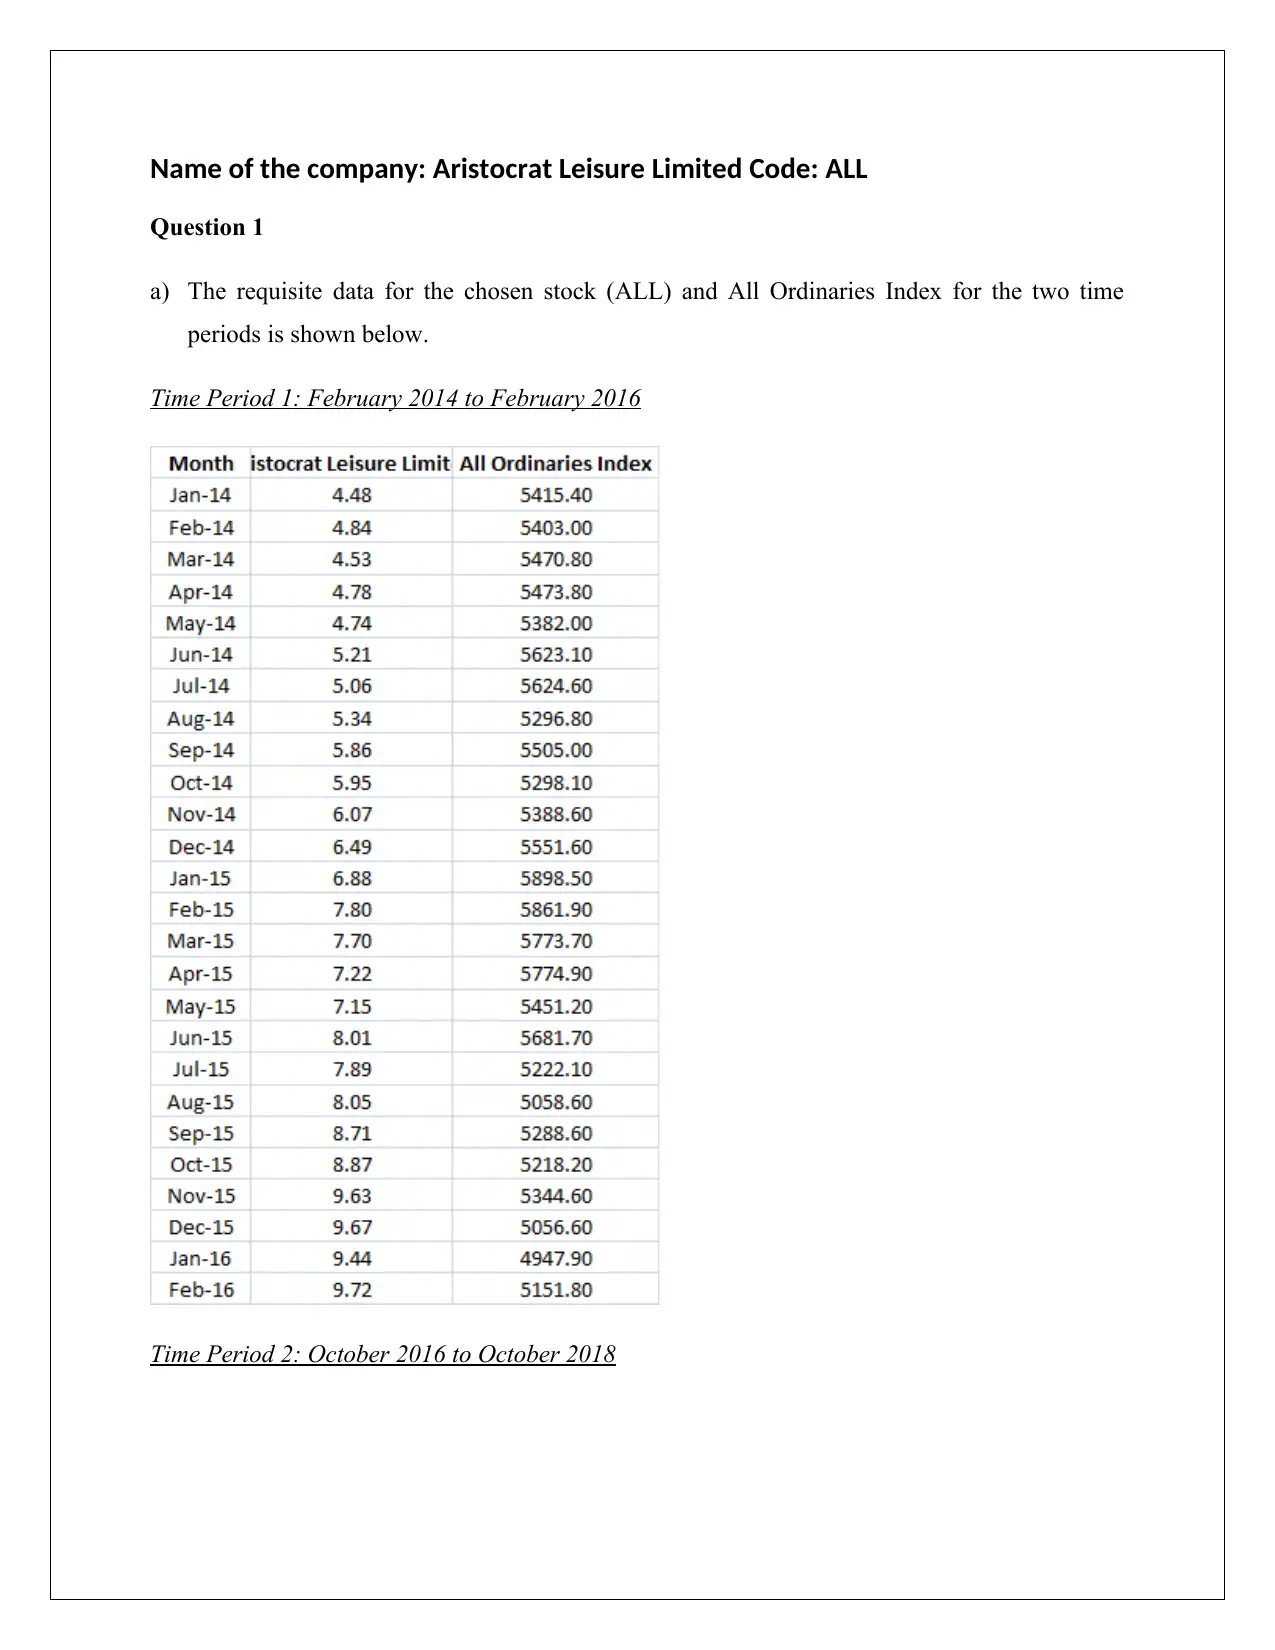
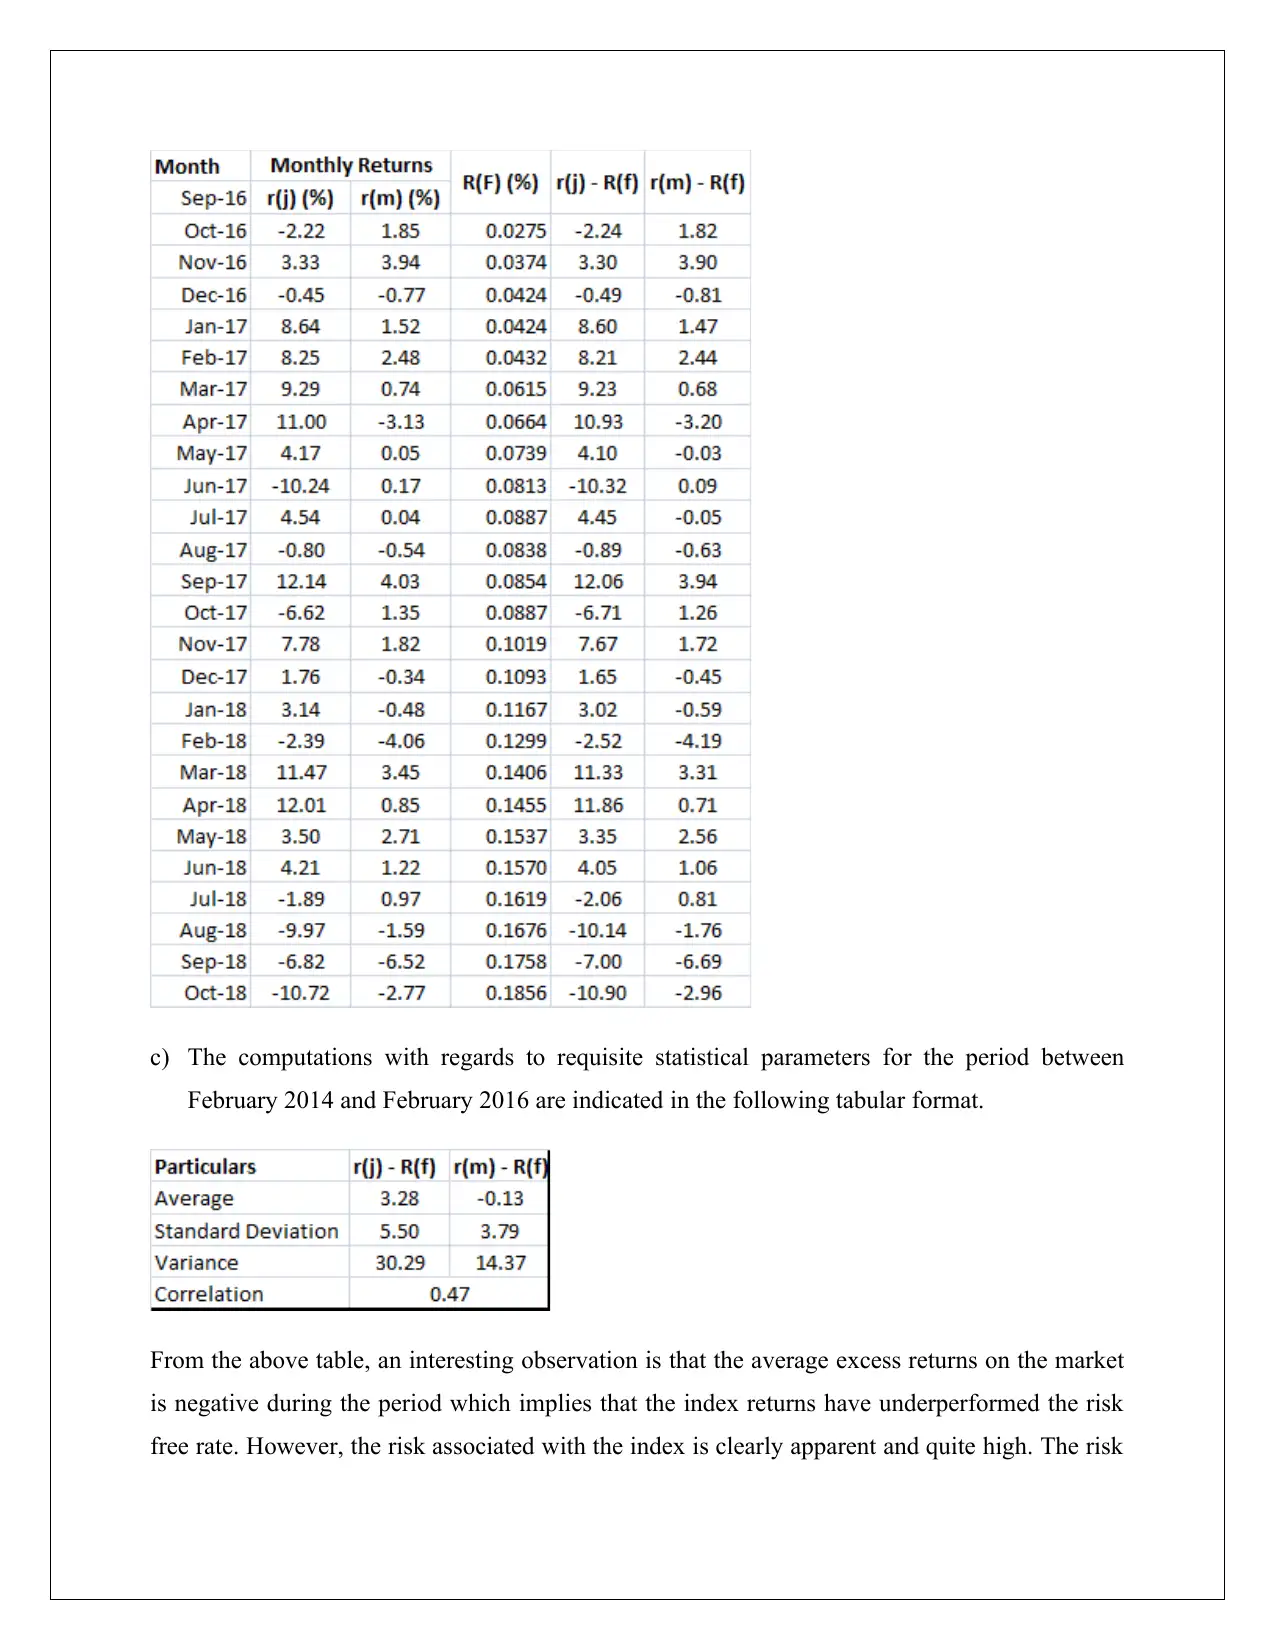
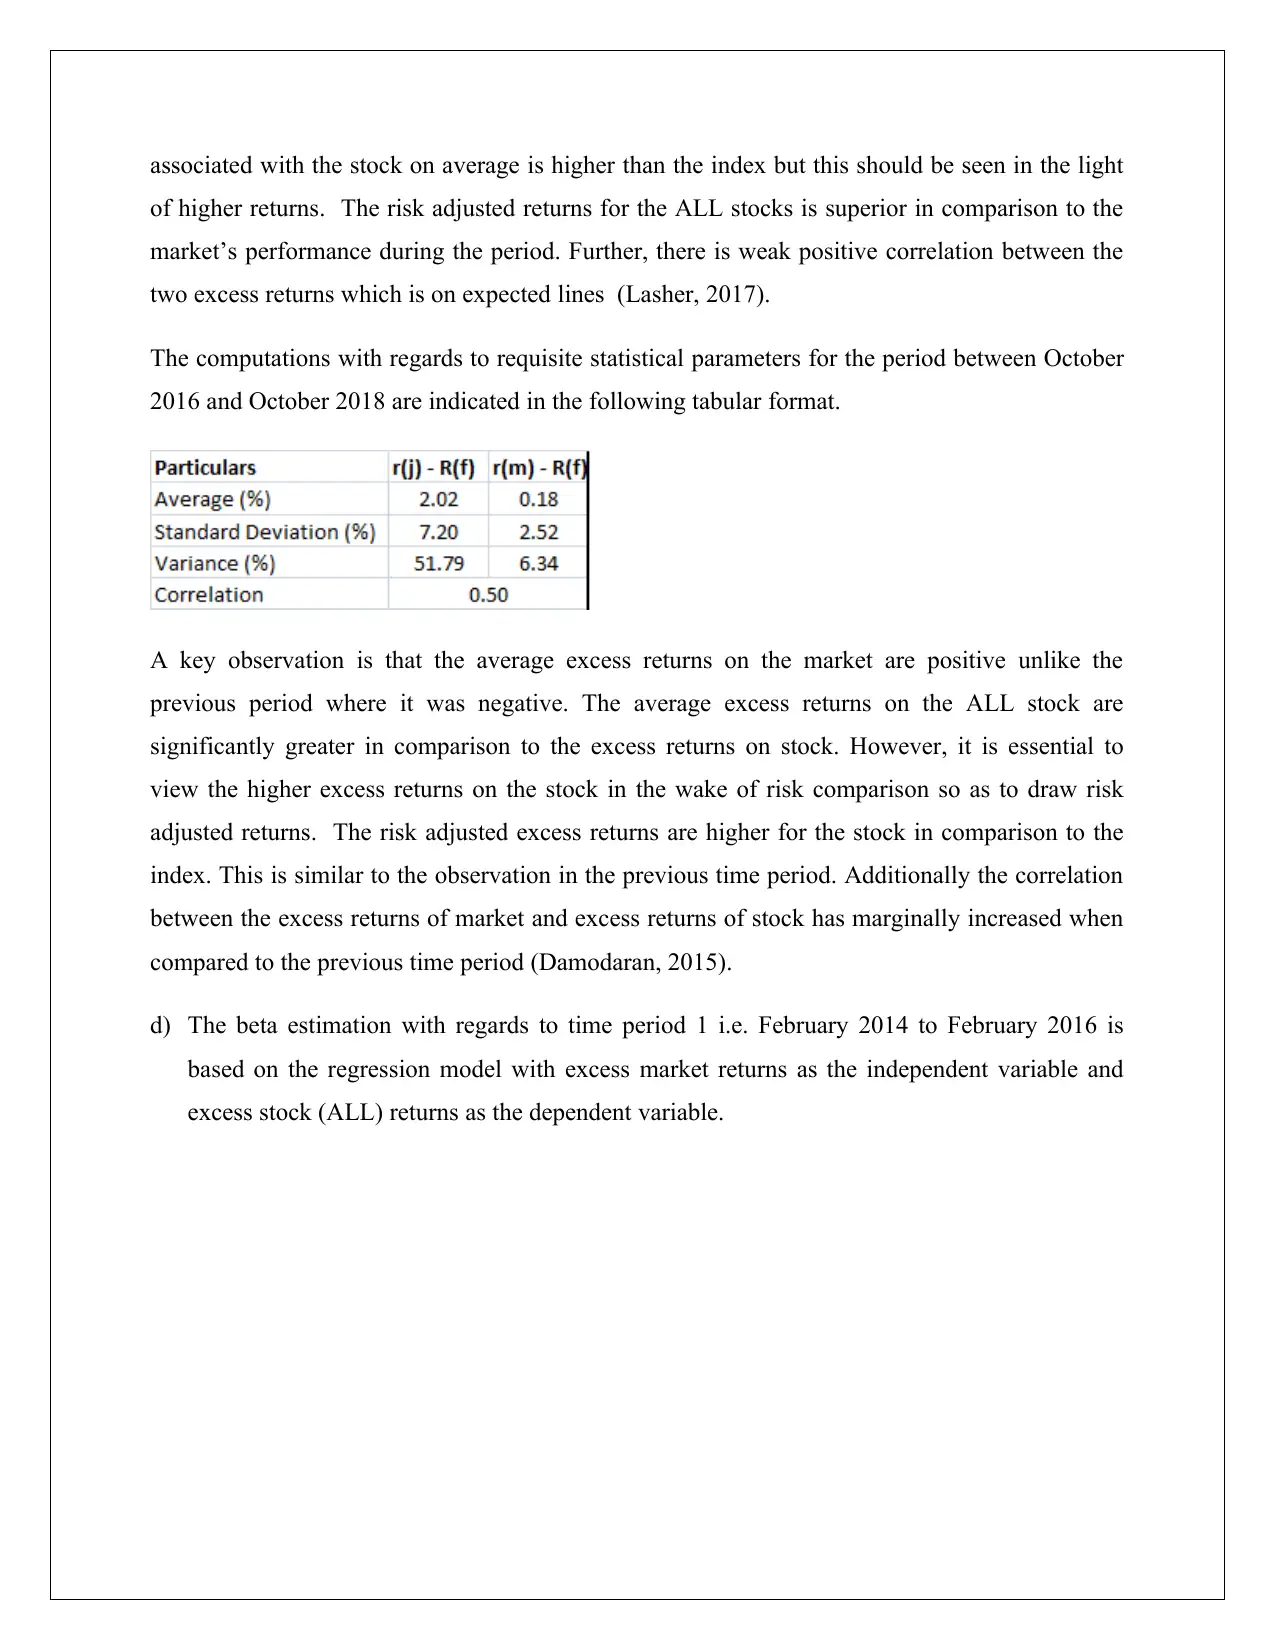
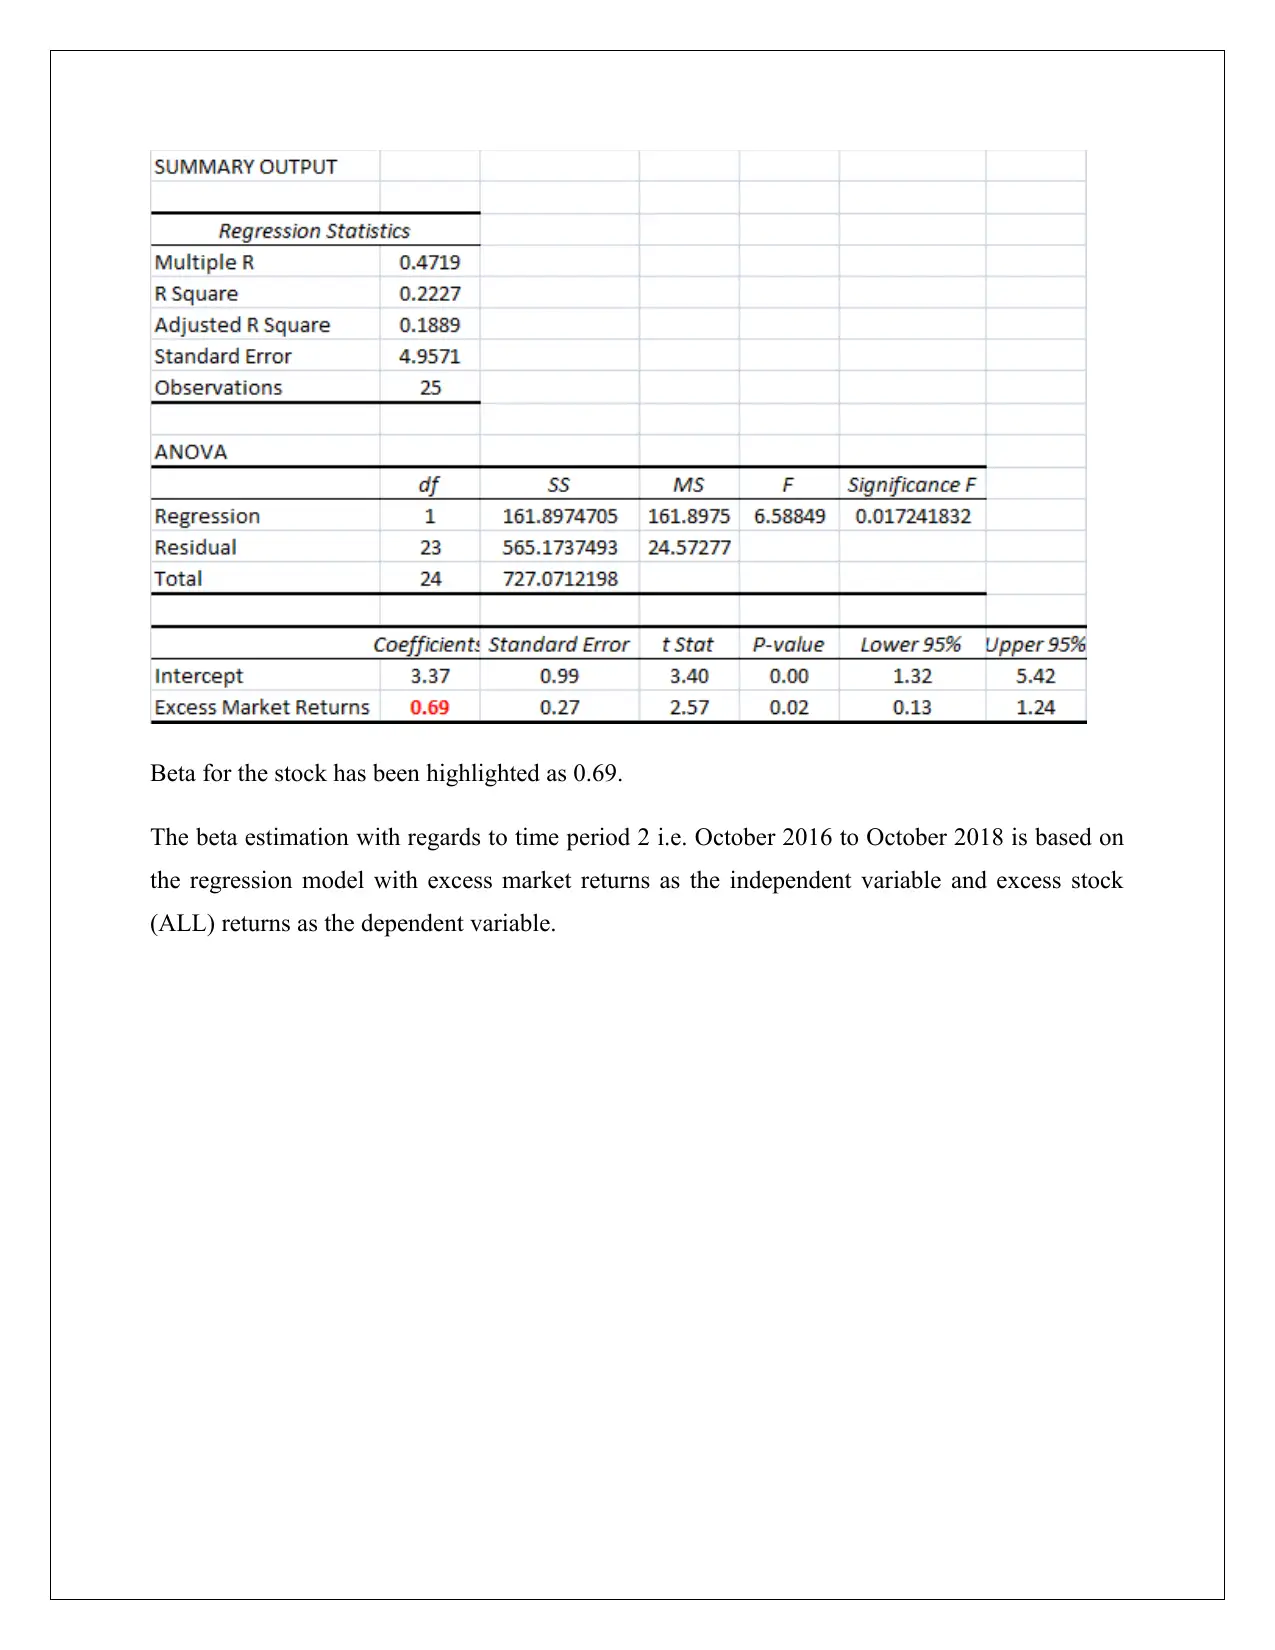
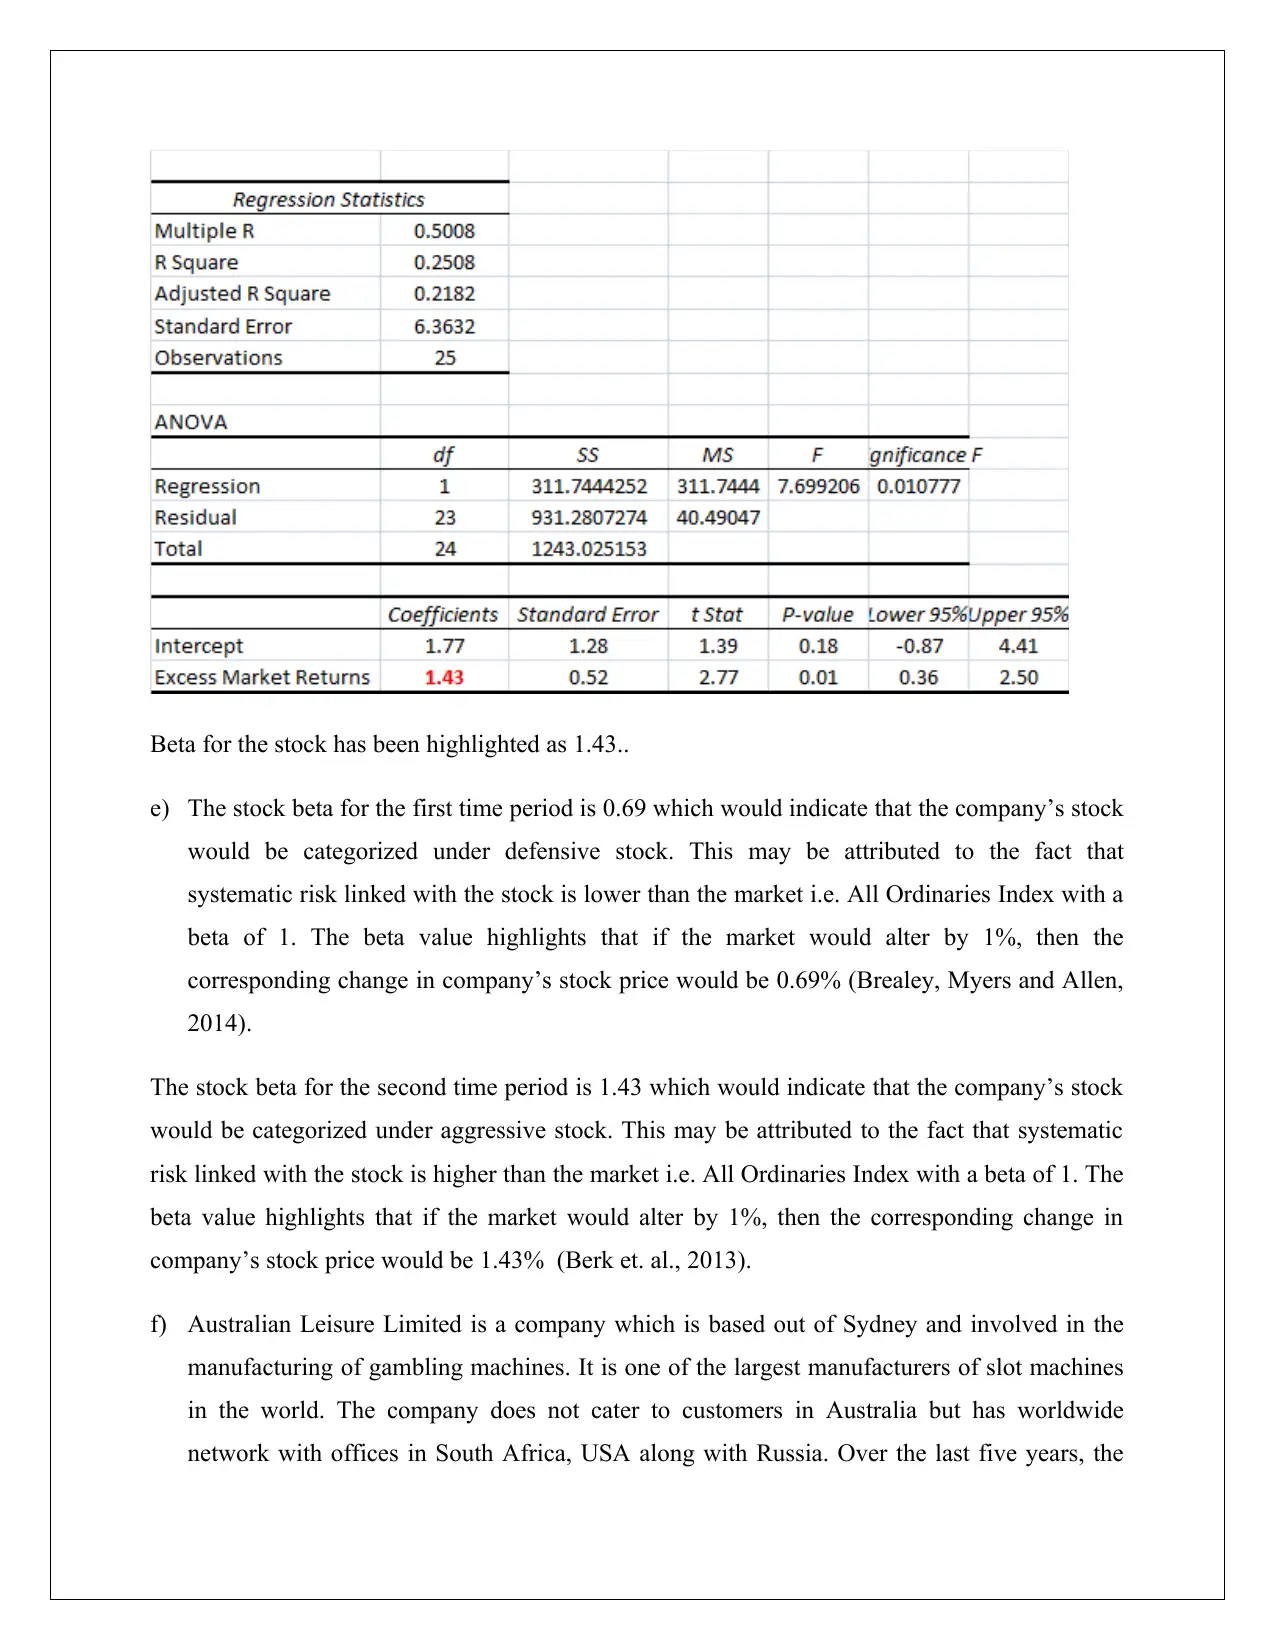
This report presents a financial analysis of Aristocrat Leisure Limited (ALL) stock, examining its performance over two distinct time periods: February 2014 to February 2016 and October 2016 to October 2018. The analysis includes the calculation of monthly stock returns, excess returns, and statistical parameters such as mean, standard deviation, variance, and correlation coefficients for both the stock and the All Ordinaries Index. The report also estimates the beta for the stock in both periods, categorizing the stock as defensive in the first period and aggressive in the second. The report discusses the implications of these beta values and the limitations of the Capital Asset Pricing Model (CAPM) in accurately capturing risk, especially the presence of unsystematic risk. The findings highlight the importance of considering multi-factor models for a more precise estimation of expected stock returns, due to the shortcomings of CAPM assumptions. The report concludes with references to support the analysis.

FINANCE
STOCK : ARISTOCRAT LEISURE LIMITED
STUDENT ID
[Pick the date]
STOCK : ARISTOCRAT LEISURE LIMITED
STUDENT ID
[Pick the date]
Paraphrase This Document
Need a fresh take? Get an instant paraphrase of this document with our AI Paraphraser

Name of the company: Aristocrat Leisure Limited Code: ALL
Question 1
a) The requisite data for the chosen stock (ALL) and All Ordinaries Index for the two time
periods is shown below.
Time Period 1: February 2014 to February 2016
Time Period 2: October 2016 to October 2018
Question 1
a) The requisite data for the chosen stock (ALL) and All Ordinaries Index for the two time
periods is shown below.
Time Period 1: February 2014 to February 2016
Time Period 2: October 2016 to October 2018

b) Based on the data collected above, the monthly stock returns have been calculated for both
the All Ordinaries Index and the selected stock i.e. ALL. Further, using the relevant period
risk free rate, excess returns on market and the chosen stock has been computed for the given
two time periods.
Time Period 1: February 2014 to February 2016
the All Ordinaries Index and the selected stock i.e. ALL. Further, using the relevant period
risk free rate, excess returns on market and the chosen stock has been computed for the given
two time periods.
Time Period 1: February 2014 to February 2016
⊘ This is a preview!⊘
Do you want full access?
Subscribe today to unlock all pages.

Trusted by 1+ million students worldwide

Time sub period 2 – October 2016 - October 2018
Paraphrase This Document
Need a fresh take? Get an instant paraphrase of this document with our AI Paraphraser

c) The computations with regards to requisite statistical parameters for the period between
February 2014 and February 2016 are indicated in the following tabular format.
From the above table, an interesting observation is that the average excess returns on the market
is negative during the period which implies that the index returns have underperformed the risk
free rate. However, the risk associated with the index is clearly apparent and quite high. The risk

associated with the stock on average is higher than the index but this should be seen in the light
of higher returns. The risk adjusted returns for the ALL stocks is superior in comparison to the
market’s performance during the period. Further, there is weak positive correlation between the
two excess returns which is on expected lines (Lasher, 2017).
The computations with regards to requisite statistical parameters for the period between October
2016 and October 2018 are indicated in the following tabular format.
A key observation is that the average excess returns on the market are positive unlike the
previous period where it was negative. The average excess returns on the ALL stock are
significantly greater in comparison to the excess returns on stock. However, it is essential to
view the higher excess returns on the stock in the wake of risk comparison so as to draw risk
adjusted returns. The risk adjusted excess returns are higher for the stock in comparison to the
index. This is similar to the observation in the previous time period. Additionally the correlation
between the excess returns of market and excess returns of stock has marginally increased when
compared to the previous time period (Damodaran, 2015).
d) The beta estimation with regards to time period 1 i.e. February 2014 to February 2016 is
based on the regression model with excess market returns as the independent variable and
excess stock (ALL) returns as the dependent variable.
⊘ This is a preview!⊘
Do you want full access?
Subscribe today to unlock all pages.

Trusted by 1+ million students worldwide

Beta for the stock has been highlighted as 0.69.
The beta estimation with regards to time period 2 i.e. October 2016 to October 2018 is based on
the regression model with excess market returns as the independent variable and excess stock
(ALL) returns as the dependent variable.
The beta estimation with regards to time period 2 i.e. October 2016 to October 2018 is based on
the regression model with excess market returns as the independent variable and excess stock
(ALL) returns as the dependent variable.
Paraphrase This Document
Need a fresh take? Get an instant paraphrase of this document with our AI Paraphraser

Beta for the stock has been highlighted as 1.43..
e) The stock beta for the first time period is 0.69 which would indicate that the company’s stock
would be categorized under defensive stock. This may be attributed to the fact that
systematic risk linked with the stock is lower than the market i.e. All Ordinaries Index with a
beta of 1. The beta value highlights that if the market would alter by 1%, then the
corresponding change in company’s stock price would be 0.69% (Brealey, Myers and Allen,
2014).
The stock beta for the second time period is 1.43 which would indicate that the company’s stock
would be categorized under aggressive stock. This may be attributed to the fact that systematic
risk linked with the stock is higher than the market i.e. All Ordinaries Index with a beta of 1. The
beta value highlights that if the market would alter by 1%, then the corresponding change in
company’s stock price would be 1.43% (Berk et. al., 2013).
f) Australian Leisure Limited is a company which is based out of Sydney and involved in the
manufacturing of gambling machines. It is one of the largest manufacturers of slot machines
in the world. The company does not cater to customers in Australia but has worldwide
network with offices in South Africa, USA along with Russia. Over the last five years, the

company has made a host of acquisitions especially with regards to mobile gaming in order
to expand the product portfolio along with geographical spread which has led to improved
financial performance of the company. The current market capitalization of this company as
on September 27 2019 is AUD 19.33 billion (ALL, 2019).
g) The beta value of the same stock over the two time periods is significantly different from one
another. A possible explanation of this aberration is the assumption in CAPM that the
investor has made investment in a diversified portfolio. Hence, it is assumed under CAPM
approach that there is no unsystematic risk exposure for the investor as only risk is
systematic risk which is captured by beta. However, this assumption is false and hence a
significant unsystematic risk exposure is there which is not captured by CAPM approach
(Damodaran, 2015).
It is observed that the correlation between the market returns and stock returns is hovering
around 0.5 for both the periods. It implies that beta as a risk parameter is not accurate or else
the correlation between the market and stock returns would have been much higher. As a
result, instead of CAPM it may be recommended that multi-factor models ought to be
deployed which more accurately estimates the expected returns on the stock. Owing to the
shortcoming of the CAPM model such as unrealistic assumptions and failure of beta to
capture risk completely, the beta values tend to significantly differ (Lasher,2017).
⊘ This is a preview!⊘
Do you want full access?
Subscribe today to unlock all pages.

Trusted by 1+ million students worldwide

References
ALL 2019, The Aristocrat Story, viewed 27 September 2019 < https://www.aristocrat.com/about/
>
Berk, J, DeMarzo, P, Harford, J, Ford, G, Mollica, V & Finch, N 2013, Fundamentals of
corporate finance,4th edn, Pearson Higher Education, London
Brealey, RA, Myers, SC & Allen, F 2014, Principles of corporate finance. 2nd edn, McGraw-
Hill, New York
Damodaran, A 2015 Applied corporate finance: A user’s manual. 3rd edn, John Wiley & Sons,
New York
Lasher, WR 2017, Practical Financial Management. 5th edn, South- Western College, London
1 out of 10
Related Documents
Your All-in-One AI-Powered Toolkit for Academic Success.
+13062052269
info@desklib.com
Available 24*7 on WhatsApp / Email
Unlock your academic potential
Copyright © 2020–2025 A2Z Services. All Rights Reserved. Developed and managed by ZUCOL.


