Financial Performance Analysis: Aristocrat Leisure Limited Report
VerifiedAdded on 2023/01/18
|7
|1302
|46
Report
AI Summary
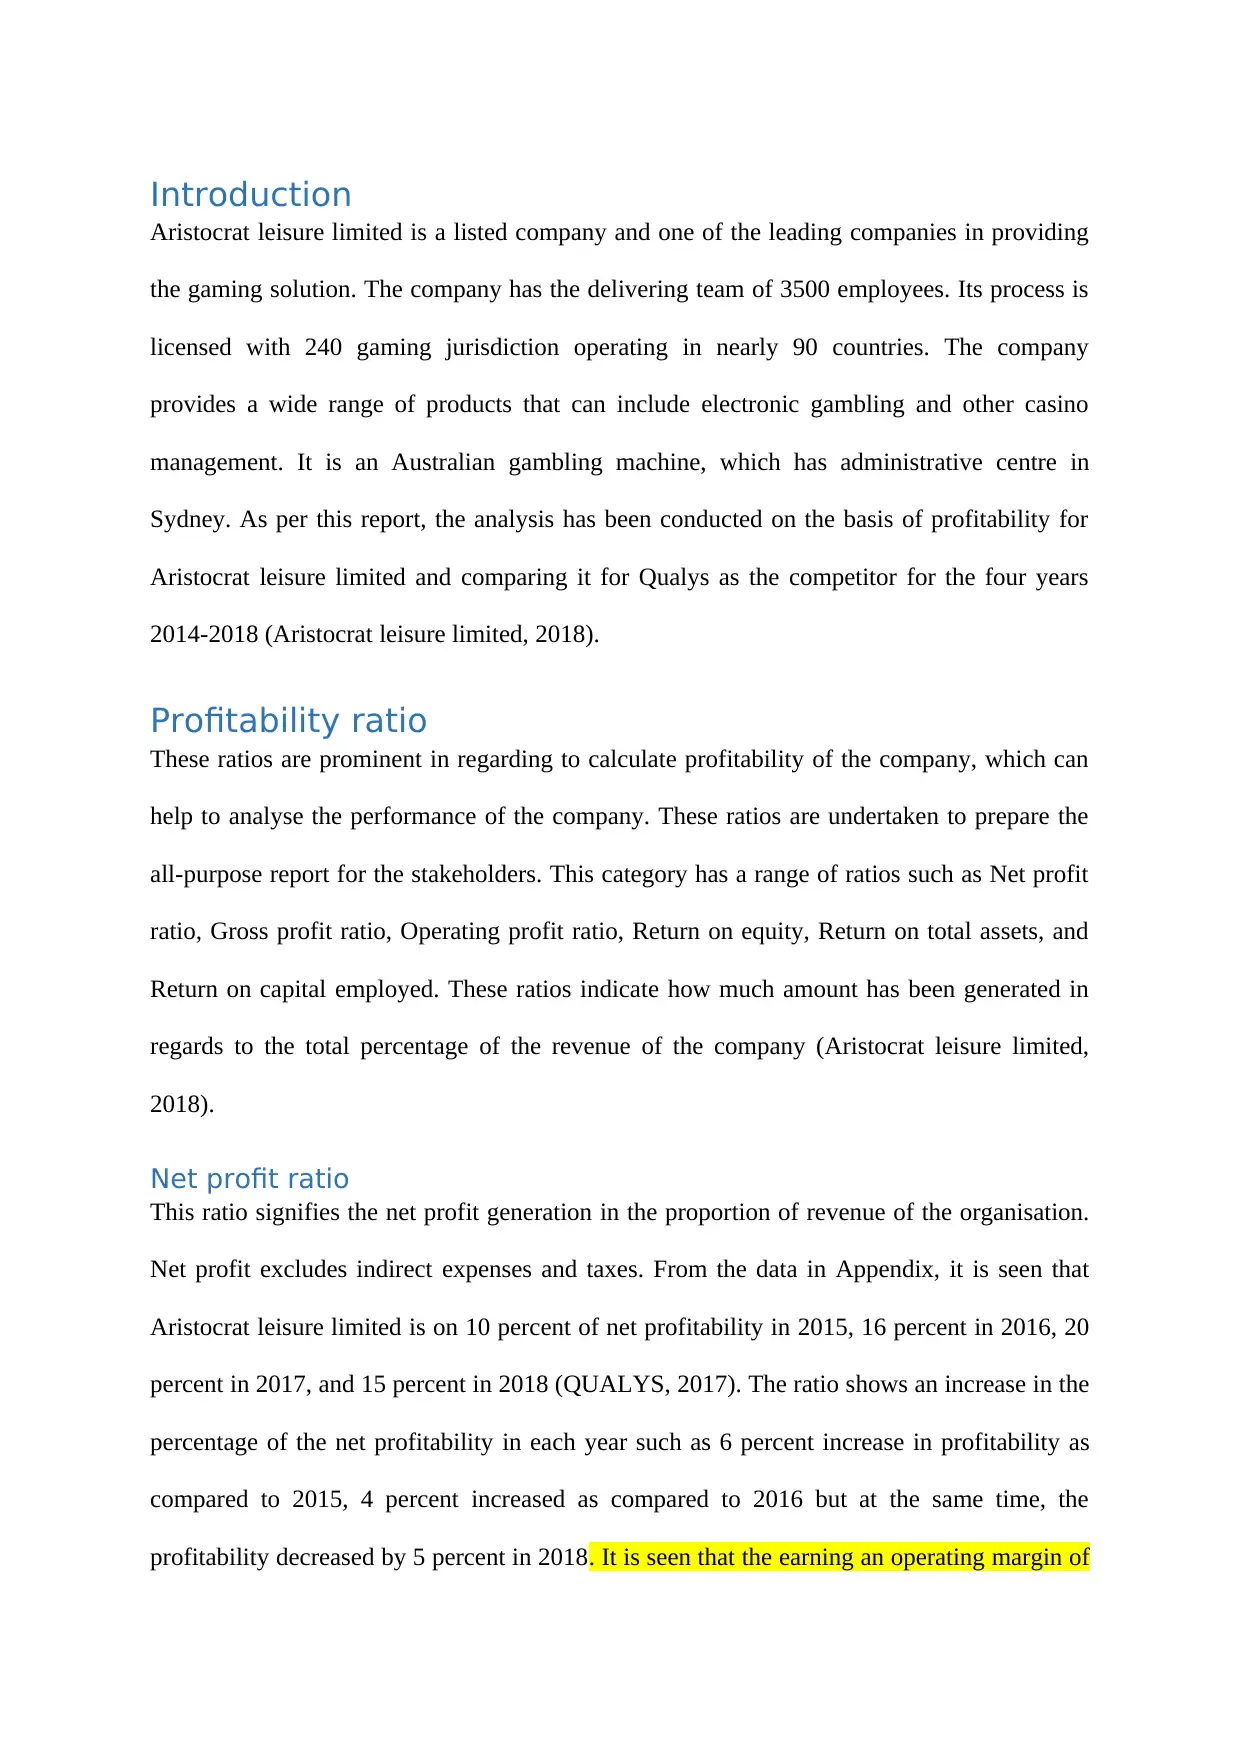
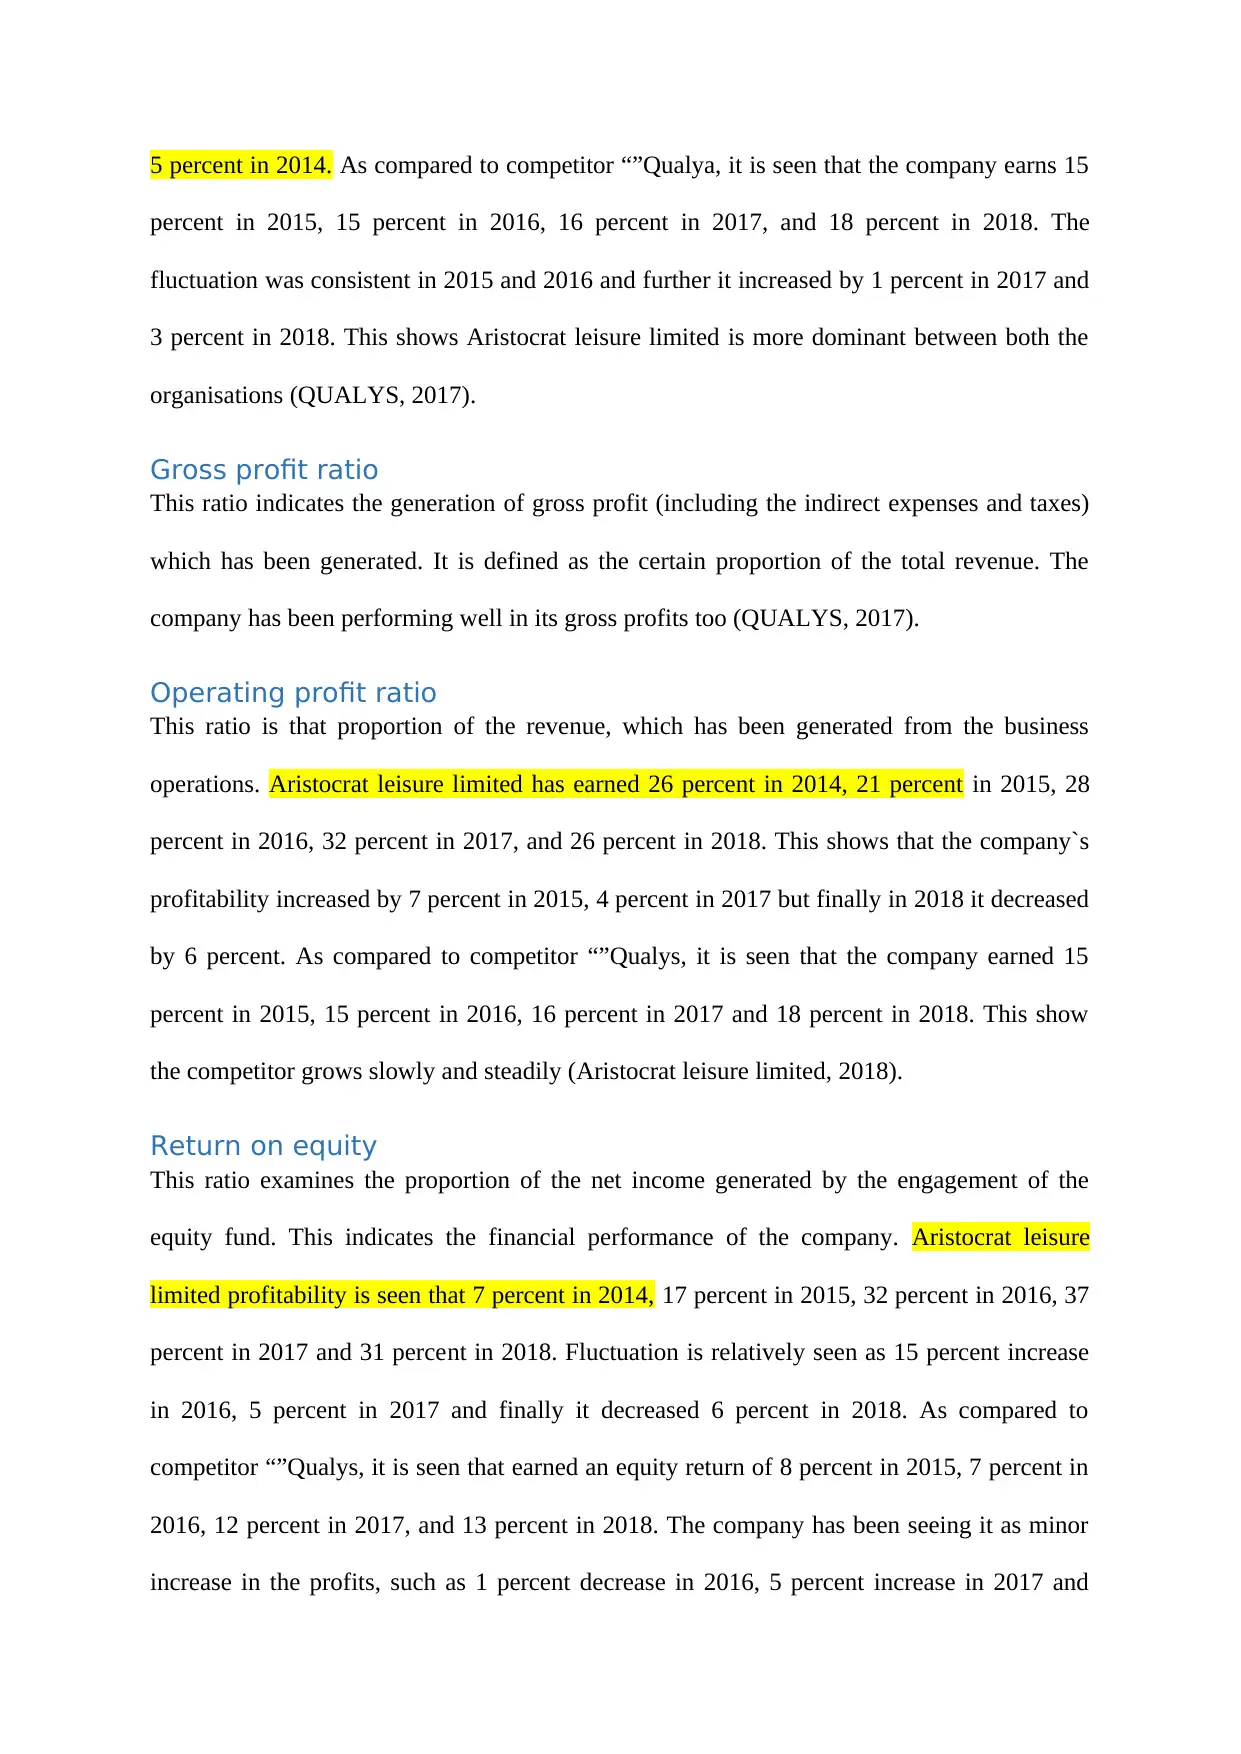
This report provides a detailed profitability analysis of Aristocrat Leisure Limited, a leading gaming solutions provider, from 2014 to 2018. The analysis focuses on key financial ratios, including net profit ratio, gross profit ratio, operating profit ratio, return on equity, return on total assets, and return on capital employed. The report compares Aristocrat's performance with its competitor, Qualys, highlighting trends and fluctuations in profitability metrics over the four-year period. The study reveals insights into Aristocrat's financial health, identifying periods of growth and decline, and ultimately concludes that Aristocrat Leisure Limited presents a more profitable investment opportunity compared to Qualys based on the analyzed financial data. The report references annual reports from both companies to support its findings.

FINANCE
Paraphrase This Document
Need a fresh take? Get an instant paraphrase of this document with our AI Paraphraser

Contents
Introduction...........................................................................................................................................2
Profitability ratio....................................................................................................................................2
Net profit ratio...................................................................................................................................2
Gross profit ratio...............................................................................................................................3
Operating profit ratio........................................................................................................................3
Return on equity................................................................................................................................3
Return on total assets........................................................................................................................4
Return on capital employed..............................................................................................................4
Conclusion.............................................................................................................................................4
References.............................................................................................................................................5

Introduction
Aristocrat leisure limited is a listed company and one of the leading companies in providing
the gaming solution. The company has the delivering team of 3500 employees. Its process is
licensed with 240 gaming jurisdiction operating in nearly 90 countries. The company
provides a wide range of products that can include electronic gambling and other casino
management. It is an Australian gambling machine, which has administrative centre in
Sydney. As per this report, the analysis has been conducted on the basis of profitability for
Aristocrat leisure limited and comparing it for Qualys as the competitor for the four years
2014-2018 (Aristocrat leisure limited, 2018).
Profitability ratio
These ratios are prominent in regarding to calculate profitability of the company, which can
help to analyse the performance of the company. These ratios are undertaken to prepare the
all-purpose report for the stakeholders. This category has a range of ratios such as Net profit
ratio, Gross profit ratio, Operating profit ratio, Return on equity, Return on total assets, and
Return on capital employed. These ratios indicate how much amount has been generated in
regards to the total percentage of the revenue of the company (Aristocrat leisure limited,
2018).
Net profit ratio
This ratio signifies the net profit generation in the proportion of revenue of the organisation.
Net profit excludes indirect expenses and taxes. From the data in Appendix, it is seen that
Aristocrat leisure limited is on 10 percent of net profitability in 2015, 16 percent in 2016, 20
percent in 2017, and 15 percent in 2018 (QUALYS, 2017). The ratio shows an increase in the
percentage of the net profitability in each year such as 6 percent increase in profitability as
compared to 2015, 4 percent increased as compared to 2016 but at the same time, the
profitability decreased by 5 percent in 2018. It is seen that the earning an operating margin of
⊘ This is a preview!⊘
Do you want full access?
Subscribe today to unlock all pages.

Trusted by 1+ million students worldwide

5 percent in 2014. As compared to competitor “”Qualya, it is seen that the company earns 15
percent in 2015, 15 percent in 2016, 16 percent in 2017, and 18 percent in 2018. The
fluctuation was consistent in 2015 and 2016 and further it increased by 1 percent in 2017 and
3 percent in 2018. This shows Aristocrat leisure limited is more dominant between both the
organisations (QUALYS, 2017).
Gross profit ratio
This ratio indicates the generation of gross profit (including the indirect expenses and taxes)
which has been generated. It is defined as the certain proportion of the total revenue. The
company has been performing well in its gross profits too (QUALYS, 2017).
Operating profit ratio
This ratio is that proportion of the revenue, which has been generated from the business
operations. Aristocrat leisure limited has earned 26 percent in 2014, 21 percent in 2015, 28
percent in 2016, 32 percent in 2017, and 26 percent in 2018. This shows that the company`s
profitability increased by 7 percent in 2015, 4 percent in 2017 but finally in 2018 it decreased
by 6 percent. As compared to competitor “”Qualys, it is seen that the company earned 15
percent in 2015, 15 percent in 2016, 16 percent in 2017 and 18 percent in 2018. This show
the competitor grows slowly and steadily (Aristocrat leisure limited, 2018).
Return on equity
This ratio examines the proportion of the net income generated by the engagement of the
equity fund. This indicates the financial performance of the company. Aristocrat leisure
limited profitability is seen that 7 percent in 2014, 17 percent in 2015, 32 percent in 2016, 37
percent in 2017 and 31 percent in 2018. Fluctuation is relatively seen as 15 percent increase
in 2016, 5 percent in 2017 and finally it decreased 6 percent in 2018. As compared to
competitor “”Qualys, it is seen that earned an equity return of 8 percent in 2015, 7 percent in
2016, 12 percent in 2017, and 13 percent in 2018. The company has been seeing it as minor
increase in the profits, such as 1 percent decrease in 2016, 5 percent increase in 2017 and
Paraphrase This Document
Need a fresh take? Get an instant paraphrase of this document with our AI Paraphraser

finally 6 percent increase in 2018. Between both the companies, it is seen that prime increase
is in the Aristocrat leisure limited (Aristocrat leisure limited, 2018).
Return on total assets
This ratio is the measure of the total income generated by using the total assets. Aristocrat
leisure limited, it is seen that it is at 20 percent in 2014, 11 percent in 2015, 20 percent in
2016, 24 percent in 2017, and 16 percent in 2018. It is seen as the increase in the percentage
by 9 percent in 2016, 4 percent in 2017 and finally it reduced by 8 percent in 2018. As
compared to competitor “”Qualys, it is seen that the company lead to be at 8 percent in 2015,
7 percent in 2016, 7 percent in 2017, and 9 percent in 2019. This shows the competitor has
been growing very slowly as it remained at near to 7 to 8 percent in every year (Aristocrat
leisure limited, 2017).
Return on capital employed
This ratio shows the proportion of the net income that has been generated by using the capital
employed. It is seen from the reports that Aristocrat leisure limited it is 3 percent in 2014, 12
percent in 2015, 24 percent in 2016, 30 percent in 2017 and finally 19 percent in 2018. As
compared to competitor” “Qualys,” it is seen that it is 22 percent in 2015, 11 percent in 2016,
10 percent in 2017 and finally it was around 13 percent in 2018. This shows that 2018 was
not a good year for both the organisation (Aristocrat leisure limited, 2017).
Conclusion
From the above discussion, it can be concluded that it will more profitable if the investor
consider investing in Aristocrat leisure limited rather than its competitor. As this organisation
will turn to give higher return to the shareholders. While calculating the earning per share, net
profitability ratio, it is seen that it has been increasing each year 5 percent in 2014, 10 percent
in 2015, 16 percent in 2016, 20 percent 2017, and 15 percent in 2018 in case of Aristocrat

leisure limited. Whereas, Qualys has been generating a net profits of 13 percent in 2014, 10
percent in 2015, 10 percent in 2016, 18 percent in 2017 and 21 percent in 2018.
⊘ This is a preview!⊘
Do you want full access?
Subscribe today to unlock all pages.

Trusted by 1+ million students worldwide

References
Aristocrat leisure limited, (2018). Annual report. Retrieved from:
http://ir.aristocrat.com/static-files/0c55bb41-d146-4ed9-9bb7-e0aee747dd28
Aristocrat leisure limited, (2017). Annual report. Retrieved from:
http://ir.aristocrat.com/static-files/a8c256c3-6910-4054-9a8e-87ca4fc05174
QUALYS, (2017), Annual report. Retrieved from:
https://investor.qualys.com/node/12701/html
1 out of 7
Related Documents

Your All-in-One AI-Powered Toolkit for Academic Success.
+13062052269
info@desklib.com
Available 24*7 on WhatsApp / Email
Unlock your academic potential
Copyright © 2020–2025 A2Z Services. All Rights Reserved. Developed and managed by ZUCOL.