Financial Performance Analysis: ARM Holdings, Intel, Imagination Tech
VerifiedAdded on 2020/01/28
|31
|14574
|204
Report
AI Summary
This report presents a comparative analysis of the key performance indicators (KPIs) of ARM Holdings, Intel, and Imagination Technologies from 2011 to 2015 (or 2013 for Imagination Technologies). The analysis covers profitability ratios such as revenue, cost of revenue, gross profit, operating margin, ROCE, ROA, and ROE, along with research and development spending, total operating expenses, net income, and market share. The report highlights trends in revenue growth, cost management, and profitability, revealing that ARM Holdings experienced consistent revenue growth and maintained positive financial outcomes compared to its competitors, whose performance showed fluctuations and declines in key areas. The report also examines the liquidity position, asset turnover, and research and development investments of the three companies, offering insights into their financial health and competitive strategies. The interpretations of the KPIs provide a detailed comparison of the three companies' performances, pointing out strengths and weaknesses in each area and providing a rationale behind the decreasing net income in all three firms. The analysis provides crucial insights into the financial performance and competitive landscape of these key players in the technology sector.
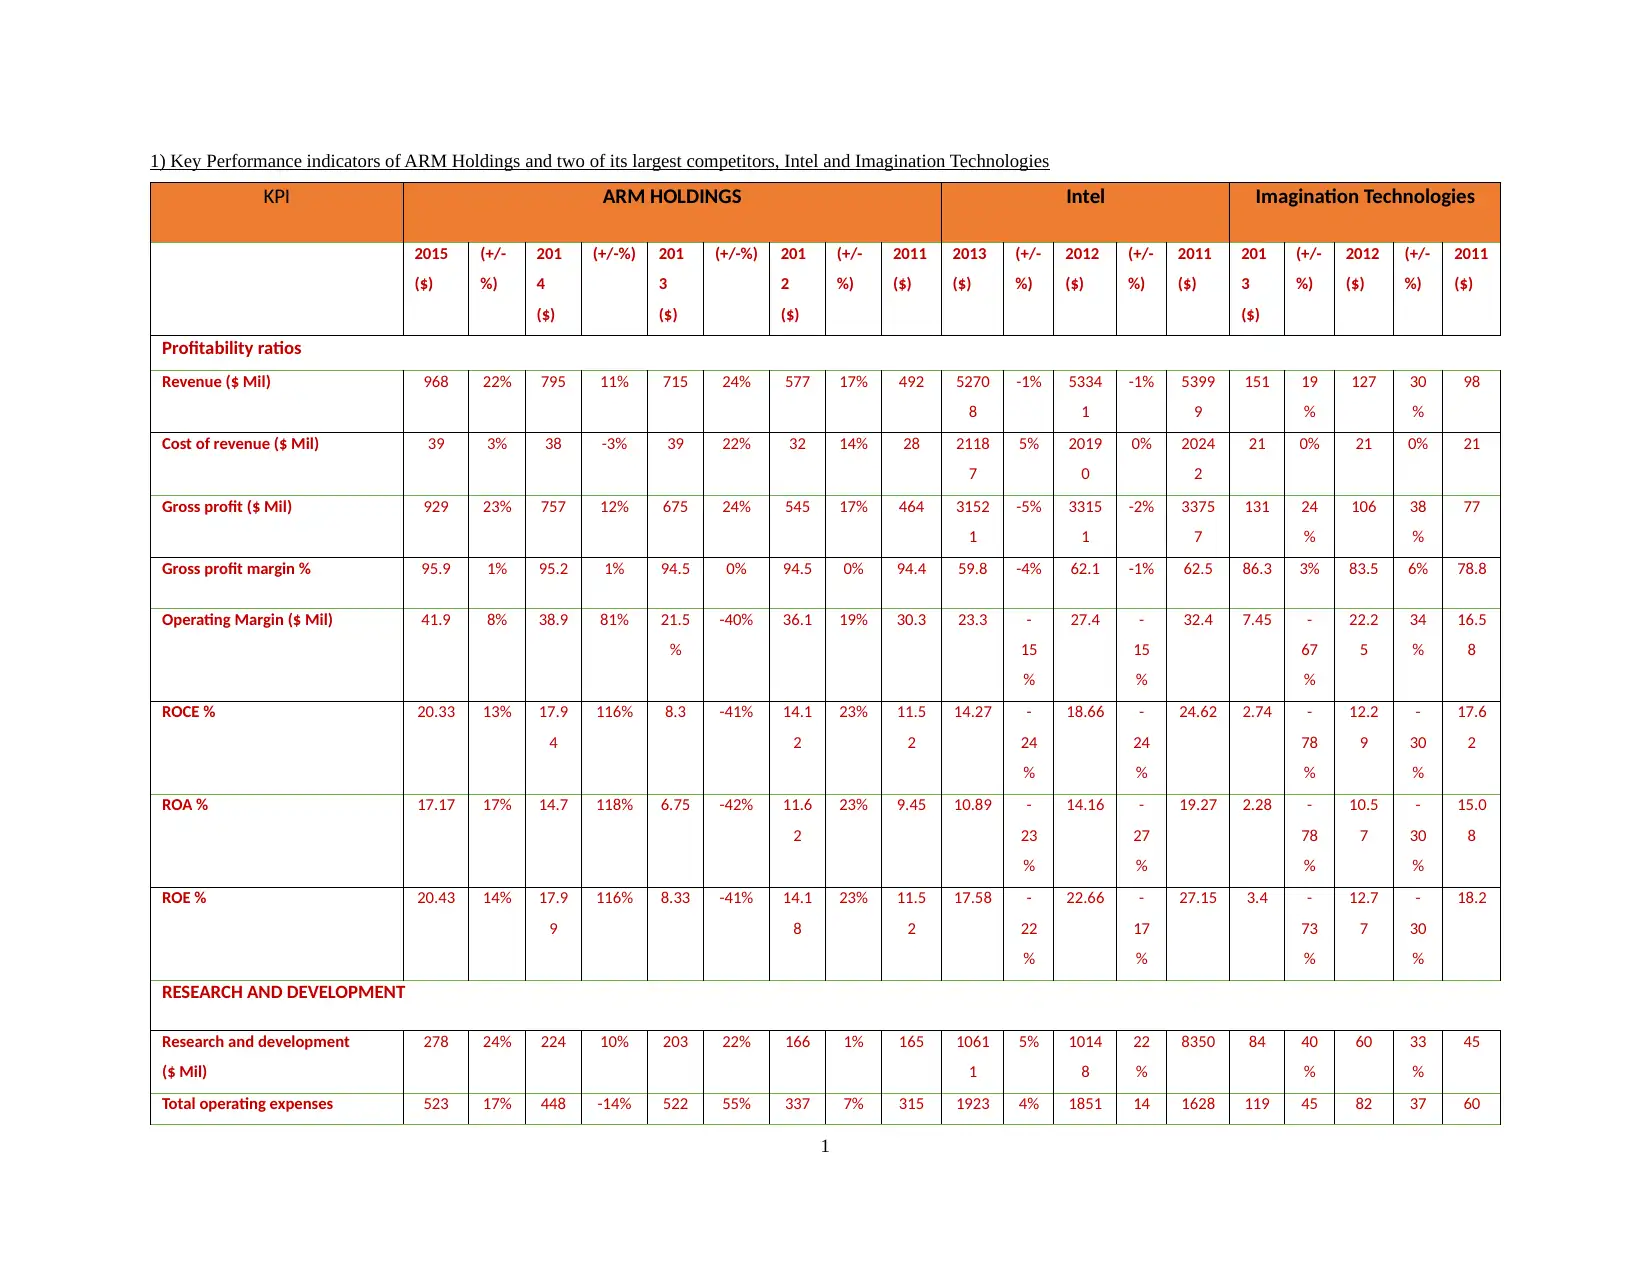
1) Key Performance indicators of ARM Holdings and two of its largest competitors, Intel and Imagination Technologies
KPI ARM HOLDINGS Intel Imagination Technologies
2015
($)
(+/-
%)
201
4
($)
(+/-%) 201
3
($)
(+/-%) 201
2
($)
(+/-
%)
2011
($)
2013
($)
(+/-
%)
2012
($)
(+/-
%)
2011
($)
201
3
($)
(+/-
%)
2012
($)
(+/-
%)
2011
($)
Profitability ratios
Revenue ($ Mil) 968 22% 795 11% 715 24% 577 17% 492 5270
8
-1% 5334
1
-1% 5399
9
151 19
%
127 30
%
98
Cost of revenue ($ Mil) 39 3% 38 -3% 39 22% 32 14% 28 2118
7
5% 2019
0
0% 2024
2
21 0% 21 0% 21
Gross profit ($ Mil) 929 23% 757 12% 675 24% 545 17% 464 3152
1
-5% 3315
1
-2% 3375
7
131 24
%
106 38
%
77
Gross profit margin % 95.9 1% 95.2 1% 94.5 0% 94.5 0% 94.4 59.8 -4% 62.1 -1% 62.5 86.3 3% 83.5 6% 78.8
Operating Margin ($ Mil) 41.9 8% 38.9 81% 21.5
%
-40% 36.1 19% 30.3 23.3 -
15
%
27.4 -
15
%
32.4 7.45 -
67
%
22.2
5
34
%
16.5
8
ROCE % 20.33 13% 17.9
4
116% 8.3 -41% 14.1
2
23% 11.5
2
14.27 -
24
%
18.66 -
24
%
24.62 2.74 -
78
%
12.2
9
-
30
%
17.6
2
ROA % 17.17 17% 14.7 118% 6.75 -42% 11.6
2
23% 9.45 10.89 -
23
%
14.16 -
27
%
19.27 2.28 -
78
%
10.5
7
-
30
%
15.0
8
ROE % 20.43 14% 17.9
9
116% 8.33 -41% 14.1
8
23% 11.5
2
17.58 -
22
%
22.66 -
17
%
27.15 3.4 -
73
%
12.7
7
-
30
%
18.2
RESEARCH AND DEVELOPMENT
Research and development
($ Mil)
278 24% 224 10% 203 22% 166 1% 165 1061
1
5% 1014
8
22
%
8350 84 40
%
60 33
%
45
Total operating expenses 523 17% 448 -14% 522 55% 337 7% 315 1923 4% 1851 14 1628 119 45 82 37 60
1
Paraphrase This Document
Need a fresh take? Get an instant paraphrase of this document with our AI Paraphraser
($ Mil)
0 3 % 0 % %
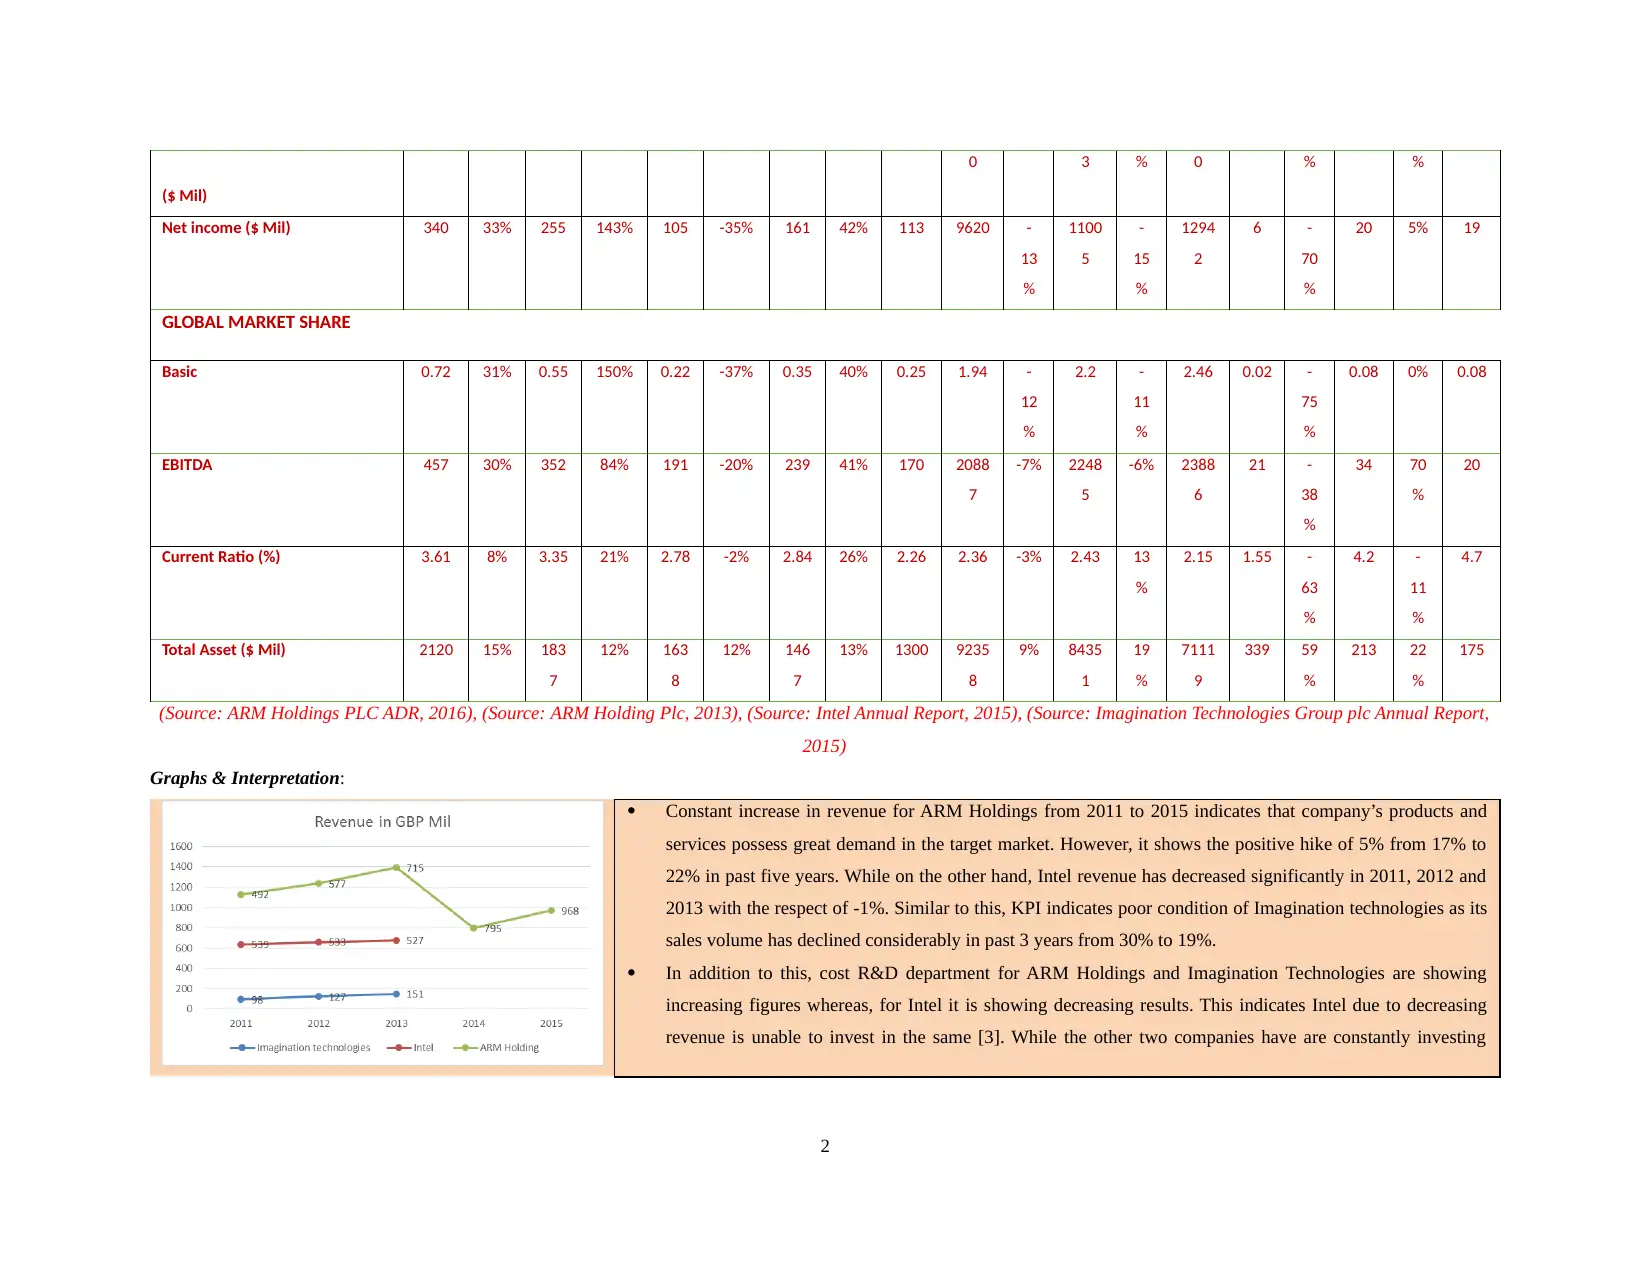
Net income ($ Mil) 340 33% 255 143% 105 -35% 161 42% 113 9620 -
13
%
1100
5
-
15
%
1294
2
6 -
70
%
20 5% 19
GLOBAL MARKET SHARE
Basic 0.72 31% 0.55 150% 0.22 -37% 0.35 40% 0.25 1.94 -
12
%
2.2 -
11
%
2.46 0.02 -
75
%
0.08 0% 0.08
EBITDA 457 30% 352 84% 191 -20% 239 41% 170 2088
7
-7% 2248
5
-6% 2388
6
21 -
38
%
34 70
%
20
Current Ratio (%) 3.61 8% 3.35 21% 2.78 -2% 2.84 26% 2.26 2.36 -3% 2.43 13
%
2.15 1.55 -
63
%
4.2 -
11
%
4.7
Total Asset ($ Mil) 2120 15% 183
7
12% 163
8
12% 146
7
13% 1300 9235
8
9% 8435
1
19
%
7111
9
339 59
%
213 22
%
175
(Source: ARM Holdings PLC ADR, 2016), (Source: ARM Holding Plc, 2013), (Source: Intel Annual Report, 2015), (Source: Imagination Technologies Group plc Annual Report,
2015)
Graphs & Interpretation:
Constant increase in revenue for ARM Holdings from 2011 to 2015 indicates that company’s products and
services possess great demand in the target market. However, it shows the positive hike of 5% from 17% to
22% in past five years. While on the other hand, Intel revenue has decreased significantly in 2011, 2012 and
2013 with the respect of -1%. Similar to this, KPI indicates poor condition of Imagination technologies as its
sales volume has declined considerably in past 3 years from 30% to 19%.
In addition to this, cost R&D department for ARM Holdings and Imagination Technologies are showing
increasing figures whereas, for Intel it is showing decreasing results. This indicates Intel due to decreasing
revenue is unable to invest in the same [3]. While the other two companies have are constantly investing
2
0 3 % 0 % %
Net income ($ Mil) 340 33% 255 143% 105 -35% 161 42% 113 9620 -
13
%
1100
5
-
15
%
1294
2
6 -
70
%
20 5% 19
GLOBAL MARKET SHARE
Basic 0.72 31% 0.55 150% 0.22 -37% 0.35 40% 0.25 1.94 -
12
%
2.2 -
11
%
2.46 0.02 -
75
%
0.08 0% 0.08
EBITDA 457 30% 352 84% 191 -20% 239 41% 170 2088
7
-7% 2248
5
-6% 2388
6
21 -
38
%
34 70
%
20
Current Ratio (%) 3.61 8% 3.35 21% 2.78 -2% 2.84 26% 2.26 2.36 -3% 2.43 13
%
2.15 1.55 -
63
%
4.2 -
11
%
4.7
Total Asset ($ Mil) 2120 15% 183
7
12% 163
8
12% 146
7
13% 1300 9235
8
9% 8435
1
19
%
7111
9
339 59
%
213 22
%
175
(Source: ARM Holdings PLC ADR, 2016), (Source: ARM Holding Plc, 2013), (Source: Intel Annual Report, 2015), (Source: Imagination Technologies Group plc Annual Report,
2015)
Graphs & Interpretation:
Constant increase in revenue for ARM Holdings from 2011 to 2015 indicates that company’s products and
services possess great demand in the target market. However, it shows the positive hike of 5% from 17% to
22% in past five years. While on the other hand, Intel revenue has decreased significantly in 2011, 2012 and
2013 with the respect of -1%. Similar to this, KPI indicates poor condition of Imagination technologies as its
sales volume has declined considerably in past 3 years from 30% to 19%.
In addition to this, cost R&D department for ARM Holdings and Imagination Technologies are showing
increasing figures whereas, for Intel it is showing decreasing results. This indicates Intel due to decreasing
revenue is unable to invest in the same [3]. While the other two companies have are constantly investing
2
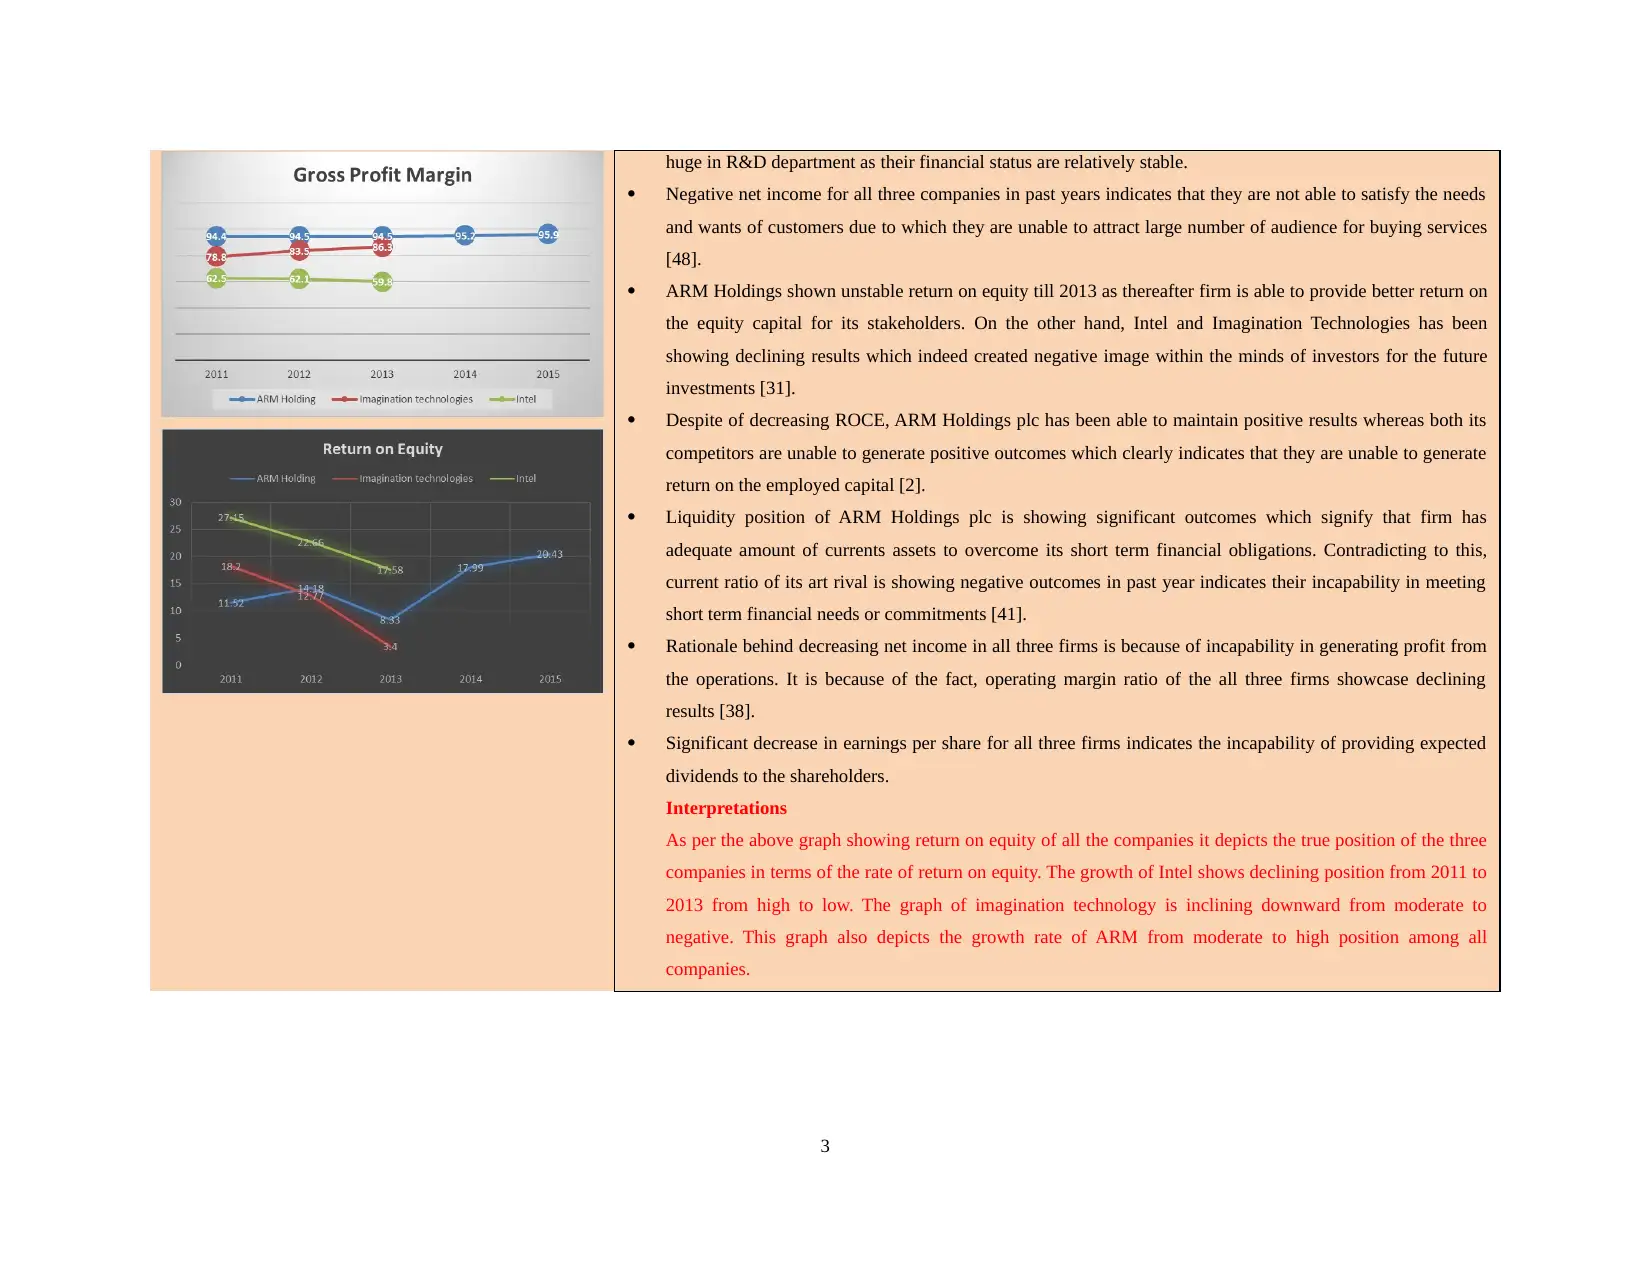
huge in R&D department as their financial status are relatively stable.
Negative net income for all three companies in past years indicates that they are not able to satisfy the needs
and wants of customers due to which they are unable to attract large number of audience for buying services
[48].
ARM Holdings shown unstable return on equity till 2013 as thereafter firm is able to provide better return on
the equity capital for its stakeholders. On the other hand, Intel and Imagination Technologies has been
showing declining results which indeed created negative image within the minds of investors for the future
investments [31].
Despite of decreasing ROCE, ARM Holdings plc has been able to maintain positive results whereas both its
competitors are unable to generate positive outcomes which clearly indicates that they are unable to generate
return on the employed capital [2].
Liquidity position of ARM Holdings plc is showing significant outcomes which signify that firm has
adequate amount of currents assets to overcome its short term financial obligations. Contradicting to this,
current ratio of its art rival is showing negative outcomes in past year indicates their incapability in meeting
short term financial needs or commitments [41].
Rationale behind decreasing net income in all three firms is because of incapability in generating profit from
the operations. It is because of the fact, operating margin ratio of the all three firms showcase declining
results [38].
Significant decrease in earnings per share for all three firms indicates the incapability of providing expected
dividends to the shareholders.
Interpretations
As per the above graph showing return on equity of all the companies it depicts the true position of the three
companies in terms of the rate of return on equity. The growth of Intel shows declining position from 2011 to
2013 from high to low. The graph of imagination technology is inclining downward from moderate to
negative. This graph also depicts the growth rate of ARM from moderate to high position among all
companies.
3
⊘ This is a preview!⊘
Do you want full access?
Subscribe today to unlock all pages.
Trusted by 1+ million students worldwide
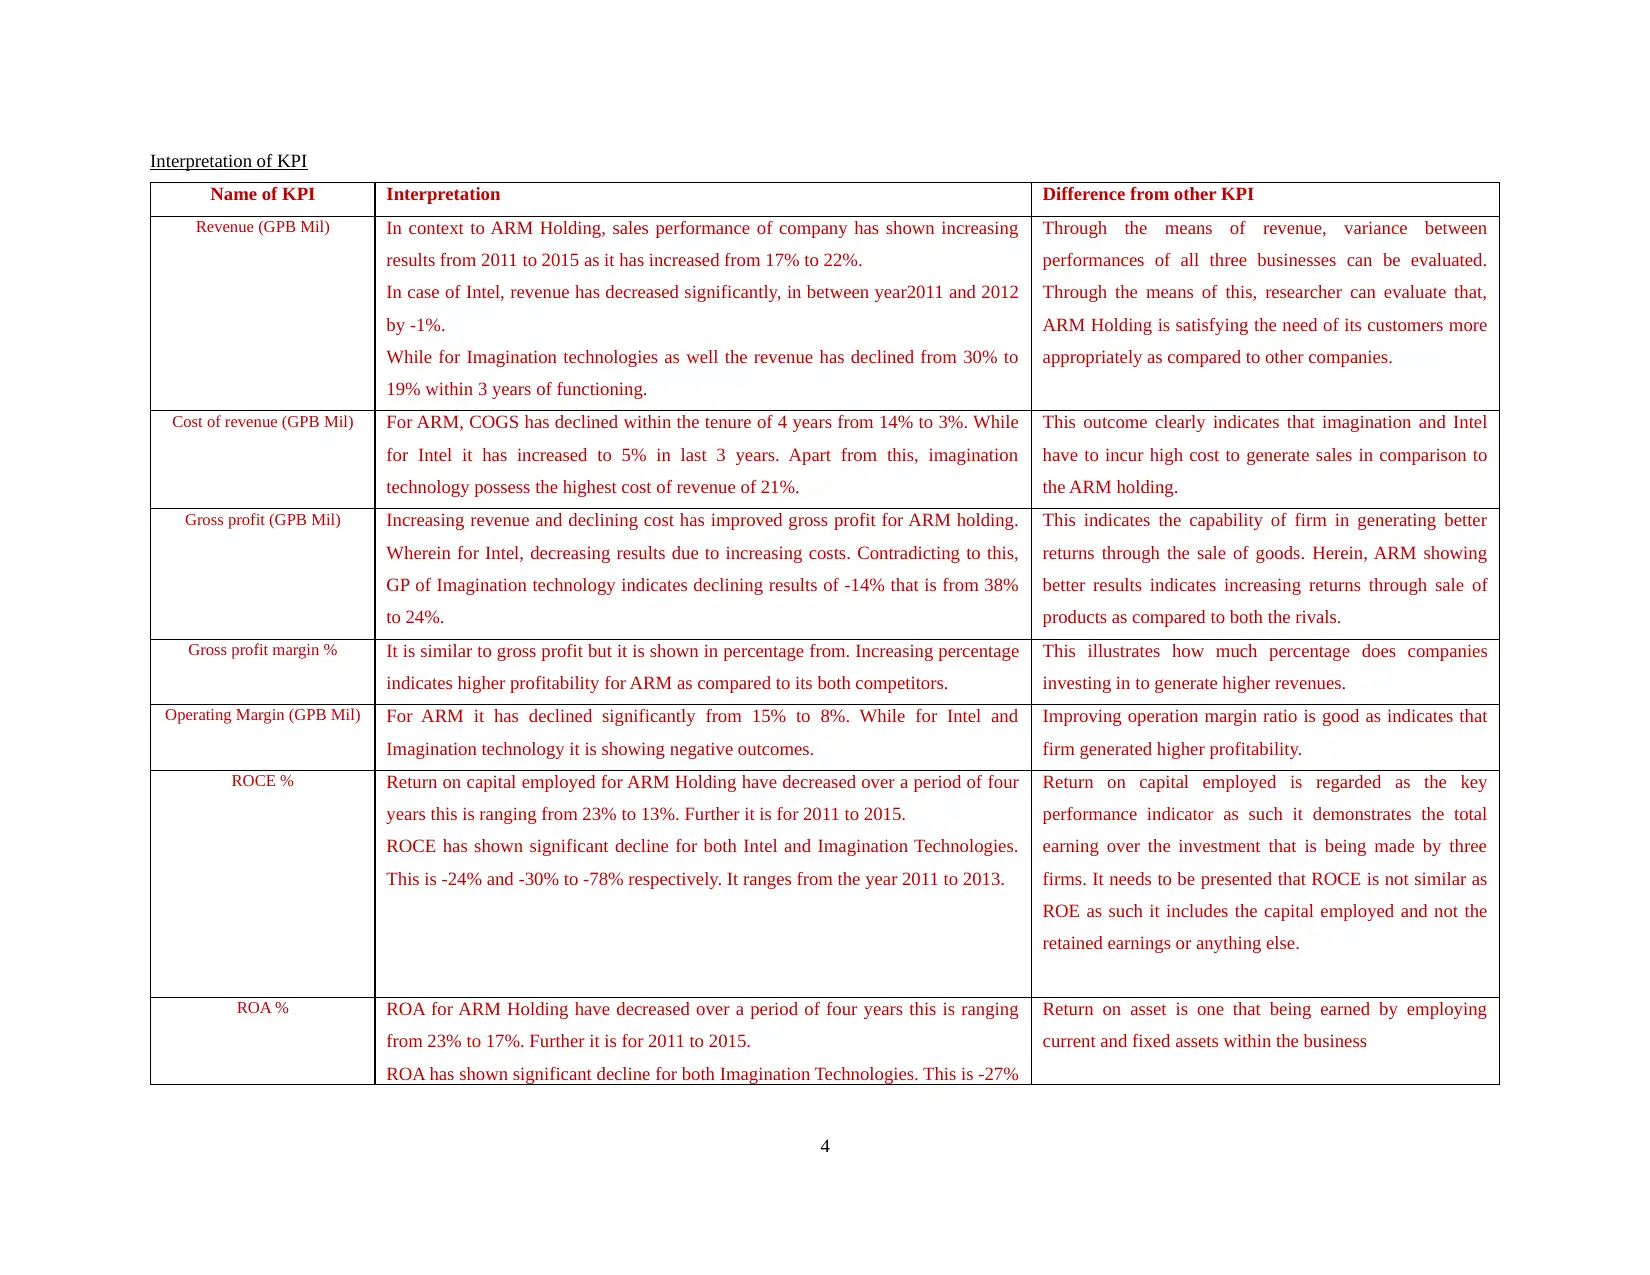
Interpretation of KPI
Name of KPI Interpretation Difference from other KPI
Revenue (GPB Mil) In context to ARM Holding, sales performance of company has shown increasing
results from 2011 to 2015 as it has increased from 17% to 22%.
In case of Intel, revenue has decreased significantly, in between year2011 and 2012
by -1%.
While for Imagination technologies as well the revenue has declined from 30% to
19% within 3 years of functioning.
Through the means of revenue, variance between
performances of all three businesses can be evaluated.
Through the means of this, researcher can evaluate that,
ARM Holding is satisfying the need of its customers more
appropriately as compared to other companies.
Cost of revenue (GPB Mil) For ARM, COGS has declined within the tenure of 4 years from 14% to 3%. While
for Intel it has increased to 5% in last 3 years. Apart from this, imagination
technology possess the highest cost of revenue of 21%.
This outcome clearly indicates that imagination and Intel
have to incur high cost to generate sales in comparison to
the ARM holding.
Gross profit (GPB Mil) Increasing revenue and declining cost has improved gross profit for ARM holding.
Wherein for Intel, decreasing results due to increasing costs. Contradicting to this,
GP of Imagination technology indicates declining results of -14% that is from 38%
to 24%.
This indicates the capability of firm in generating better
returns through the sale of goods. Herein, ARM showing
better results indicates increasing returns through sale of
products as compared to both the rivals.
Gross profit margin % It is similar to gross profit but it is shown in percentage from. Increasing percentage
indicates higher profitability for ARM as compared to its both competitors.
This illustrates how much percentage does companies
investing in to generate higher revenues.
Operating Margin (GPB Mil) For ARM it has declined significantly from 15% to 8%. While for Intel and
Imagination technology it is showing negative outcomes.
Improving operation margin ratio is good as indicates that
firm generated higher profitability.
ROCE % Return on capital employed for ARM Holding have decreased over a period of four
years this is ranging from 23% to 13%. Further it is for 2011 to 2015.
ROCE has shown significant decline for both Intel and Imagination Technologies.
This is -24% and -30% to -78% respectively. It ranges from the year 2011 to 2013.
Return on capital employed is regarded as the key
performance indicator as such it demonstrates the total
earning over the investment that is being made by three
firms. It needs to be presented that ROCE is not similar as
ROE as such it includes the capital employed and not the
retained earnings or anything else.
ROA % ROA for ARM Holding have decreased over a period of four years this is ranging
from 23% to 17%. Further it is for 2011 to 2015.
ROA has shown significant decline for both Imagination Technologies. This is -27%
Return on asset is one that being earned by employing
current and fixed assets within the business
4
Paraphrase This Document
Need a fresh take? Get an instant paraphrase of this document with our AI Paraphraser
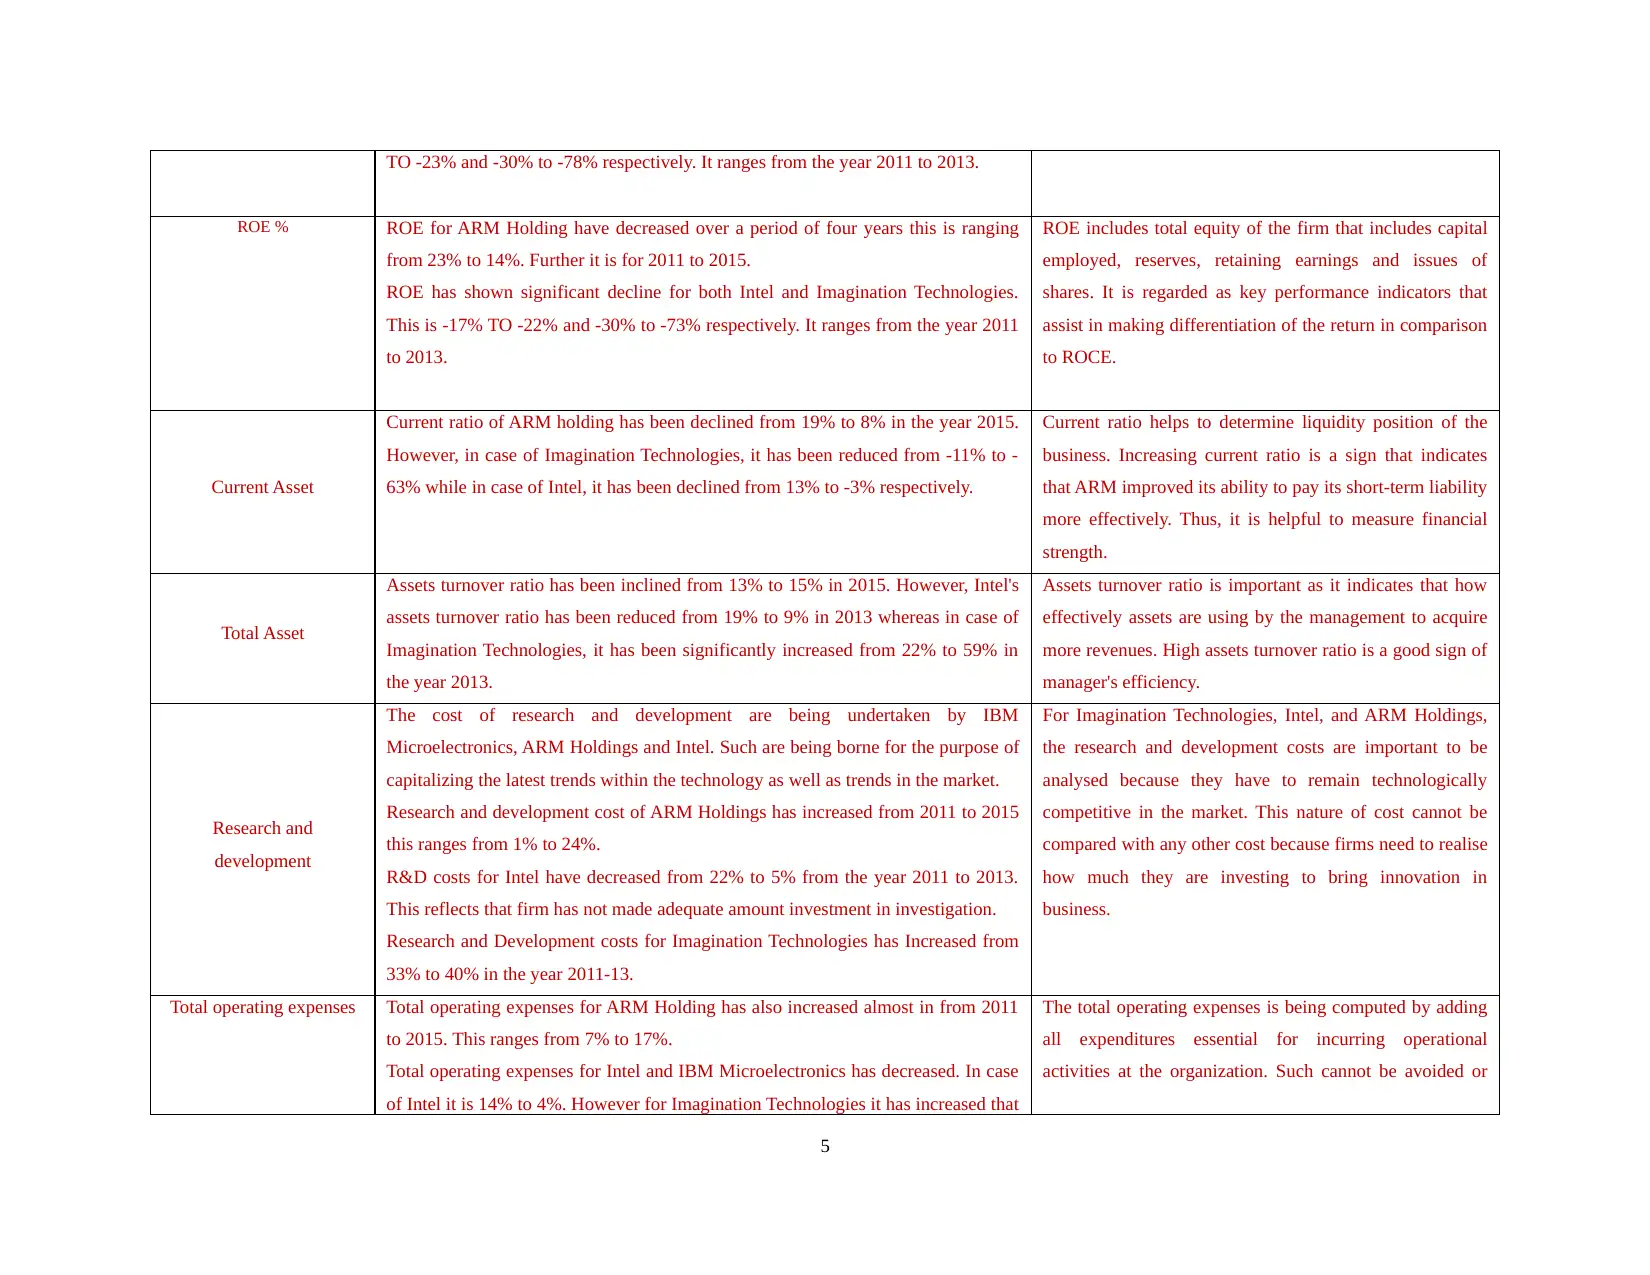
TO -23% and -30% to -78% respectively. It ranges from the year 2011 to 2013.
ROE % ROE for ARM Holding have decreased over a period of four years this is ranging
from 23% to 14%. Further it is for 2011 to 2015.
ROE has shown significant decline for both Intel and Imagination Technologies.
This is -17% TO -22% and -30% to -73% respectively. It ranges from the year 2011
to 2013.
ROE includes total equity of the firm that includes capital
employed, reserves, retaining earnings and issues of
shares. It is regarded as key performance indicators that
assist in making differentiation of the return in comparison
to ROCE.
Current Asset
Current ratio of ARM holding has been declined from 19% to 8% in the year 2015.
However, in case of Imagination Technologies, it has been reduced from -11% to -
63% while in case of Intel, it has been declined from 13% to -3% respectively.
Current ratio helps to determine liquidity position of the
business. Increasing current ratio is a sign that indicates
that ARM improved its ability to pay its short-term liability
more effectively. Thus, it is helpful to measure financial
strength.
Total Asset
Assets turnover ratio has been inclined from 13% to 15% in 2015. However, Intel's
assets turnover ratio has been reduced from 19% to 9% in 2013 whereas in case of
Imagination Technologies, it has been significantly increased from 22% to 59% in
the year 2013.
Assets turnover ratio is important as it indicates that how
effectively assets are using by the management to acquire
more revenues. High assets turnover ratio is a good sign of
manager's efficiency.
Research and
development
The cost of research and development are being undertaken by IBM
Microelectronics, ARM Holdings and Intel. Such are being borne for the purpose of
capitalizing the latest trends within the technology as well as trends in the market.
Research and development cost of ARM Holdings has increased from 2011 to 2015
this ranges from 1% to 24%.
R&D costs for Intel have decreased from 22% to 5% from the year 2011 to 2013.
This reflects that firm has not made adequate amount investment in investigation.
Research and Development costs for Imagination Technologies has Increased from
33% to 40% in the year 2011-13.
For Imagination Technologies, Intel, and ARM Holdings,
the research and development costs are important to be
analysed because they have to remain technologically
competitive in the market. This nature of cost cannot be
compared with any other cost because firms need to realise
how much they are investing to bring innovation in
business.
Total operating expenses Total operating expenses for ARM Holding has also increased almost in from 2011
to 2015. This ranges from 7% to 17%.
Total operating expenses for Intel and IBM Microelectronics has decreased. In case
of Intel it is 14% to 4%. However for Imagination Technologies it has increased that
The total operating expenses is being computed by adding
all expenditures essential for incurring operational
activities at the organization. Such cannot be avoided or
5
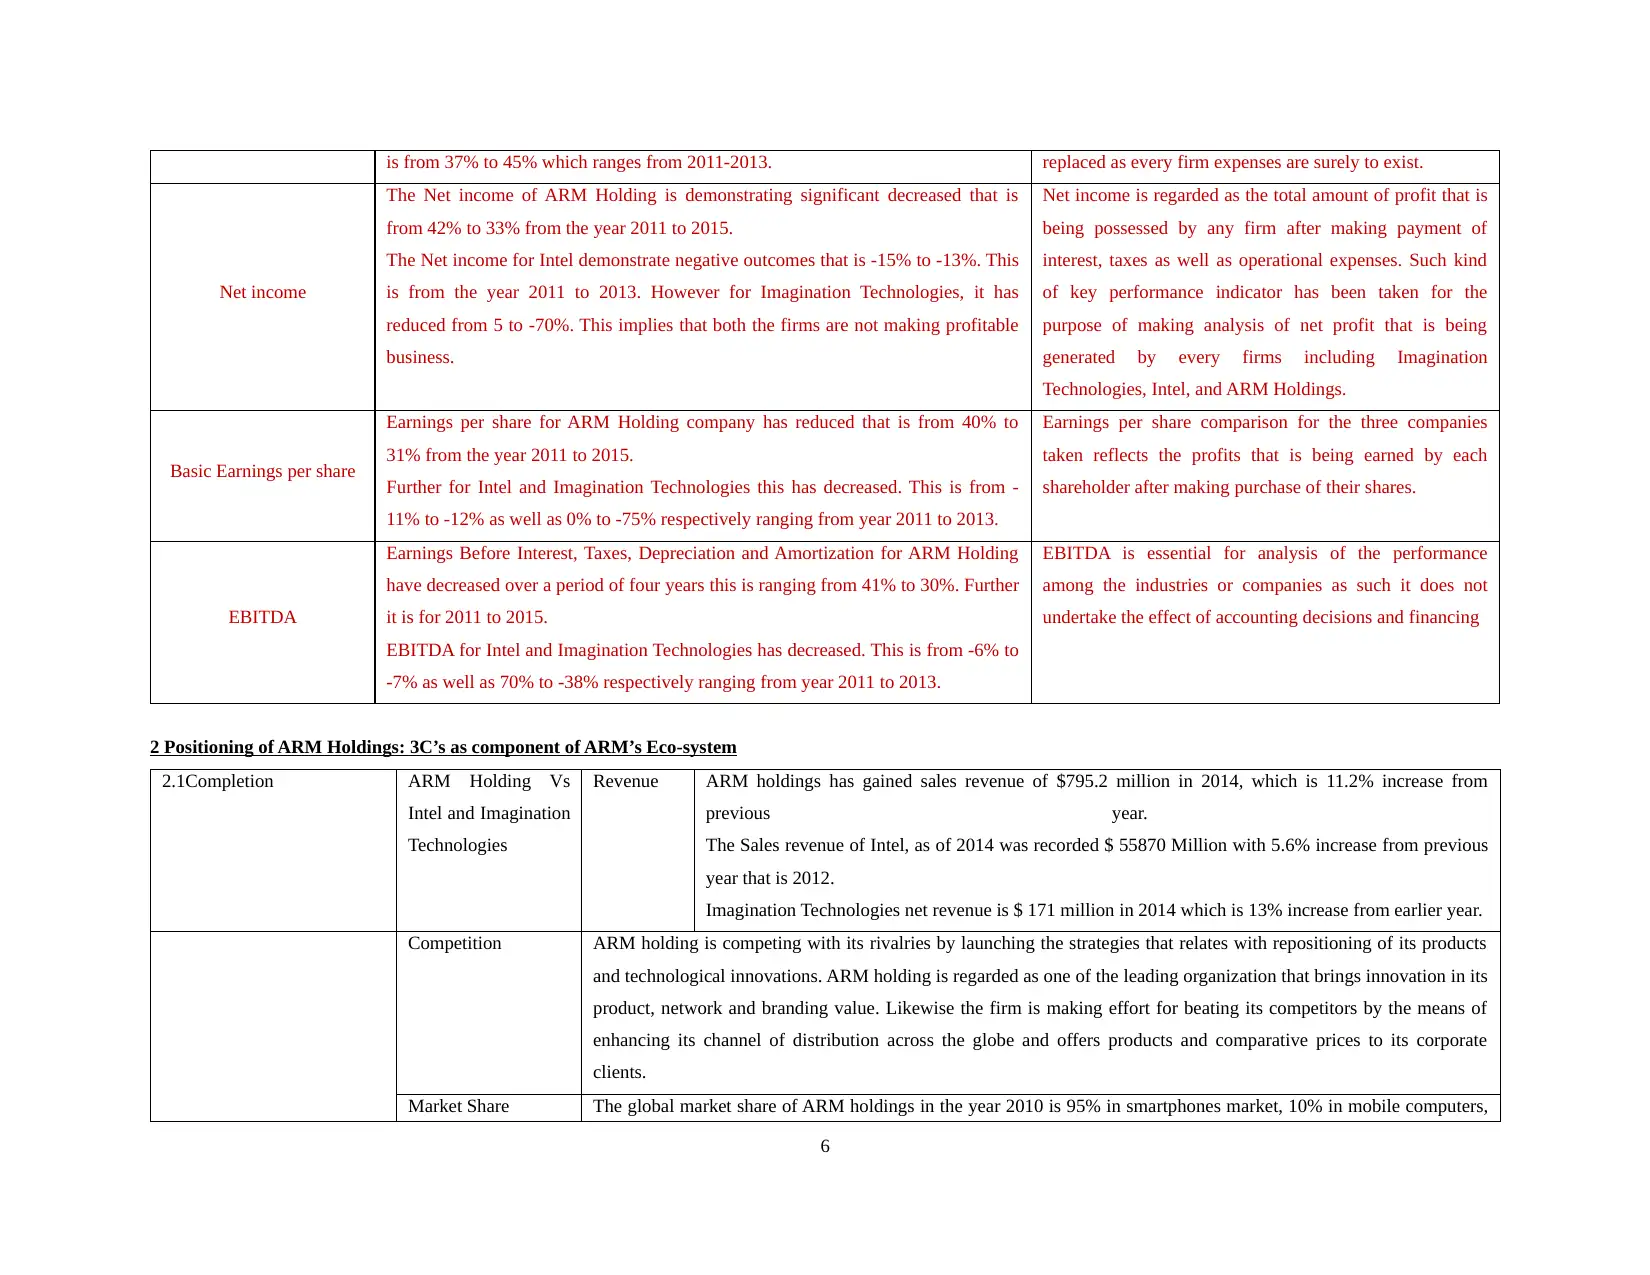
is from 37% to 45% which ranges from 2011-2013. replaced as every firm expenses are surely to exist.
Net income
The Net income of ARM Holding is demonstrating significant decreased that is
from 42% to 33% from the year 2011 to 2015.
The Net income for Intel demonstrate negative outcomes that is -15% to -13%. This
is from the year 2011 to 2013. However for Imagination Technologies, it has
reduced from 5 to -70%. This implies that both the firms are not making profitable
business.
Net income is regarded as the total amount of profit that is
being possessed by any firm after making payment of
interest, taxes as well as operational expenses. Such kind
of key performance indicator has been taken for the
purpose of making analysis of net profit that is being
generated by every firms including Imagination
Technologies, Intel, and ARM Holdings.
Basic Earnings per share
Earnings per share for ARM Holding company has reduced that is from 40% to
31% from the year 2011 to 2015.
Further for Intel and Imagination Technologies this has decreased. This is from -
11% to -12% as well as 0% to -75% respectively ranging from year 2011 to 2013.
Earnings per share comparison for the three companies
taken reflects the profits that is being earned by each
shareholder after making purchase of their shares.
EBITDA
Earnings Before Interest, Taxes, Depreciation and Amortization for ARM Holding
have decreased over a period of four years this is ranging from 41% to 30%. Further
it is for 2011 to 2015.
EBITDA for Intel and Imagination Technologies has decreased. This is from -6% to
-7% as well as 70% to -38% respectively ranging from year 2011 to 2013.
EBITDA is essential for analysis of the performance
among the industries or companies as such it does not
undertake the effect of accounting decisions and financing
2 Positioning of ARM Holdings: 3C’s as component of ARM’s Eco-system
2.1Completion ARM Holding Vs
Intel and Imagination
Technologies
Revenue ARM holdings has gained sales revenue of $795.2 million in 2014, which is 11.2% increase from
previous year.
The Sales revenue of Intel, as of 2014 was recorded $ 55870 Million with 5.6% increase from previous
year that is 2012.
Imagination Technologies net revenue is $ 171 million in 2014 which is 13% increase from earlier year.
Competition ARM holding is competing with its rivalries by launching the strategies that relates with repositioning of its products
and technological innovations. ARM holding is regarded as one of the leading organization that brings innovation in its
product, network and branding value. Likewise the firm is making effort for beating its competitors by the means of
enhancing its channel of distribution across the globe and offers products and comparative prices to its corporate
clients.
Market Share The global market share of ARM holdings in the year 2010 is 95% in smartphones market, 10% in mobile computers,
6
⊘ This is a preview!⊘
Do you want full access?
Subscribe today to unlock all pages.
Trusted by 1+ million students worldwide
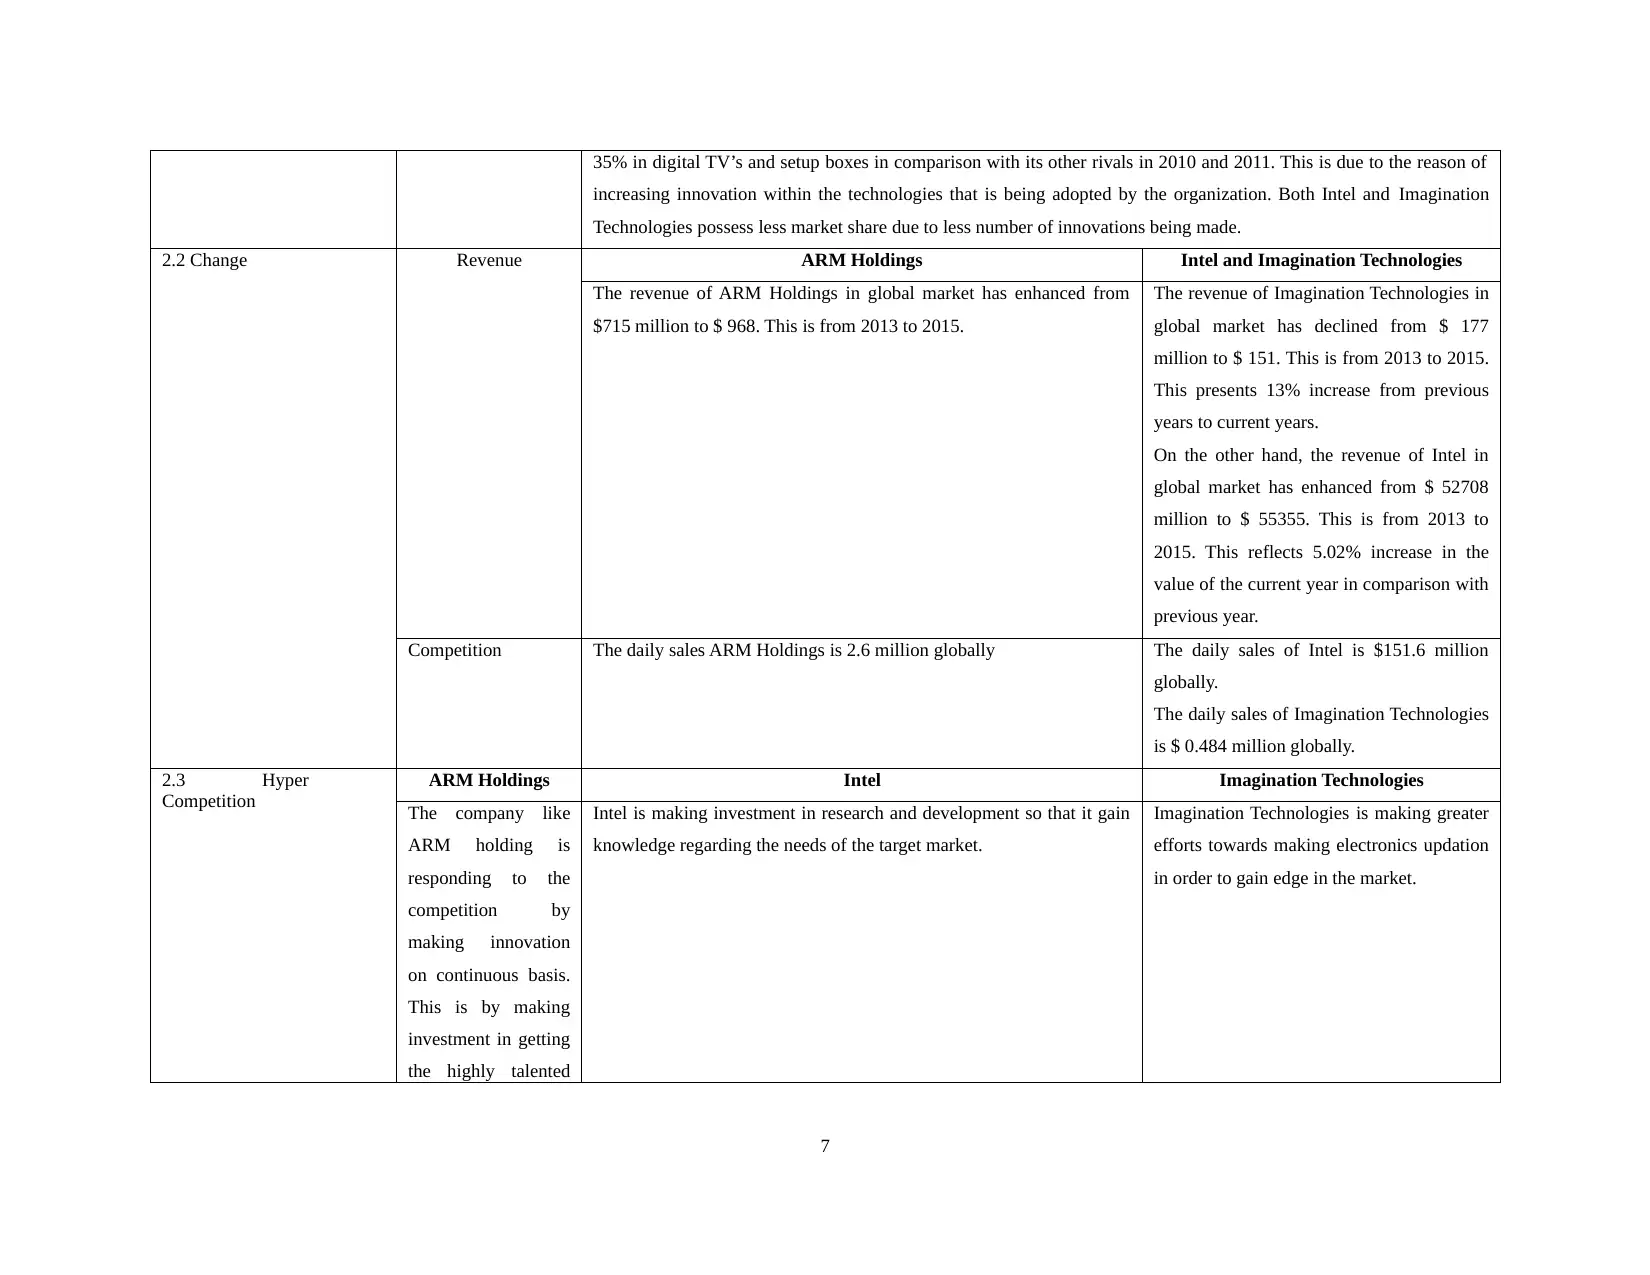
35% in digital TV’s and setup boxes in comparison with its other rivals in 2010 and 2011. This is due to the reason of
increasing innovation within the technologies that is being adopted by the organization. Both Intel and Imagination
Technologies possess less market share due to less number of innovations being made.
2.2 Change Revenue ARM Holdings Intel and Imagination Technologies
The revenue of ARM Holdings in global market has enhanced from
$715 million to $ 968. This is from 2013 to 2015.
The revenue of Imagination Technologies in
global market has declined from $ 177
million to $ 151. This is from 2013 to 2015.
This presents 13% increase from previous
years to current years.
On the other hand, the revenue of Intel in
global market has enhanced from $ 52708
million to $ 55355. This is from 2013 to
2015. This reflects 5.02% increase in the
value of the current year in comparison with
previous year.
Competition The daily sales ARM Holdings is 2.6 million globally The daily sales of Intel is $151.6 million
globally.
The daily sales of Imagination Technologies
is $ 0.484 million globally.
2.3 Hyper
Competition
ARM Holdings Intel Imagination Technologies
The company like
ARM holding is
responding to the
competition by
making innovation
on continuous basis.
This is by making
investment in getting
the highly talented
Intel is making investment in research and development so that it gain
knowledge regarding the needs of the target market.
Imagination Technologies is making greater
efforts towards making electronics updation
in order to gain edge in the market.
7
Paraphrase This Document
Need a fresh take? Get an instant paraphrase of this document with our AI Paraphraser
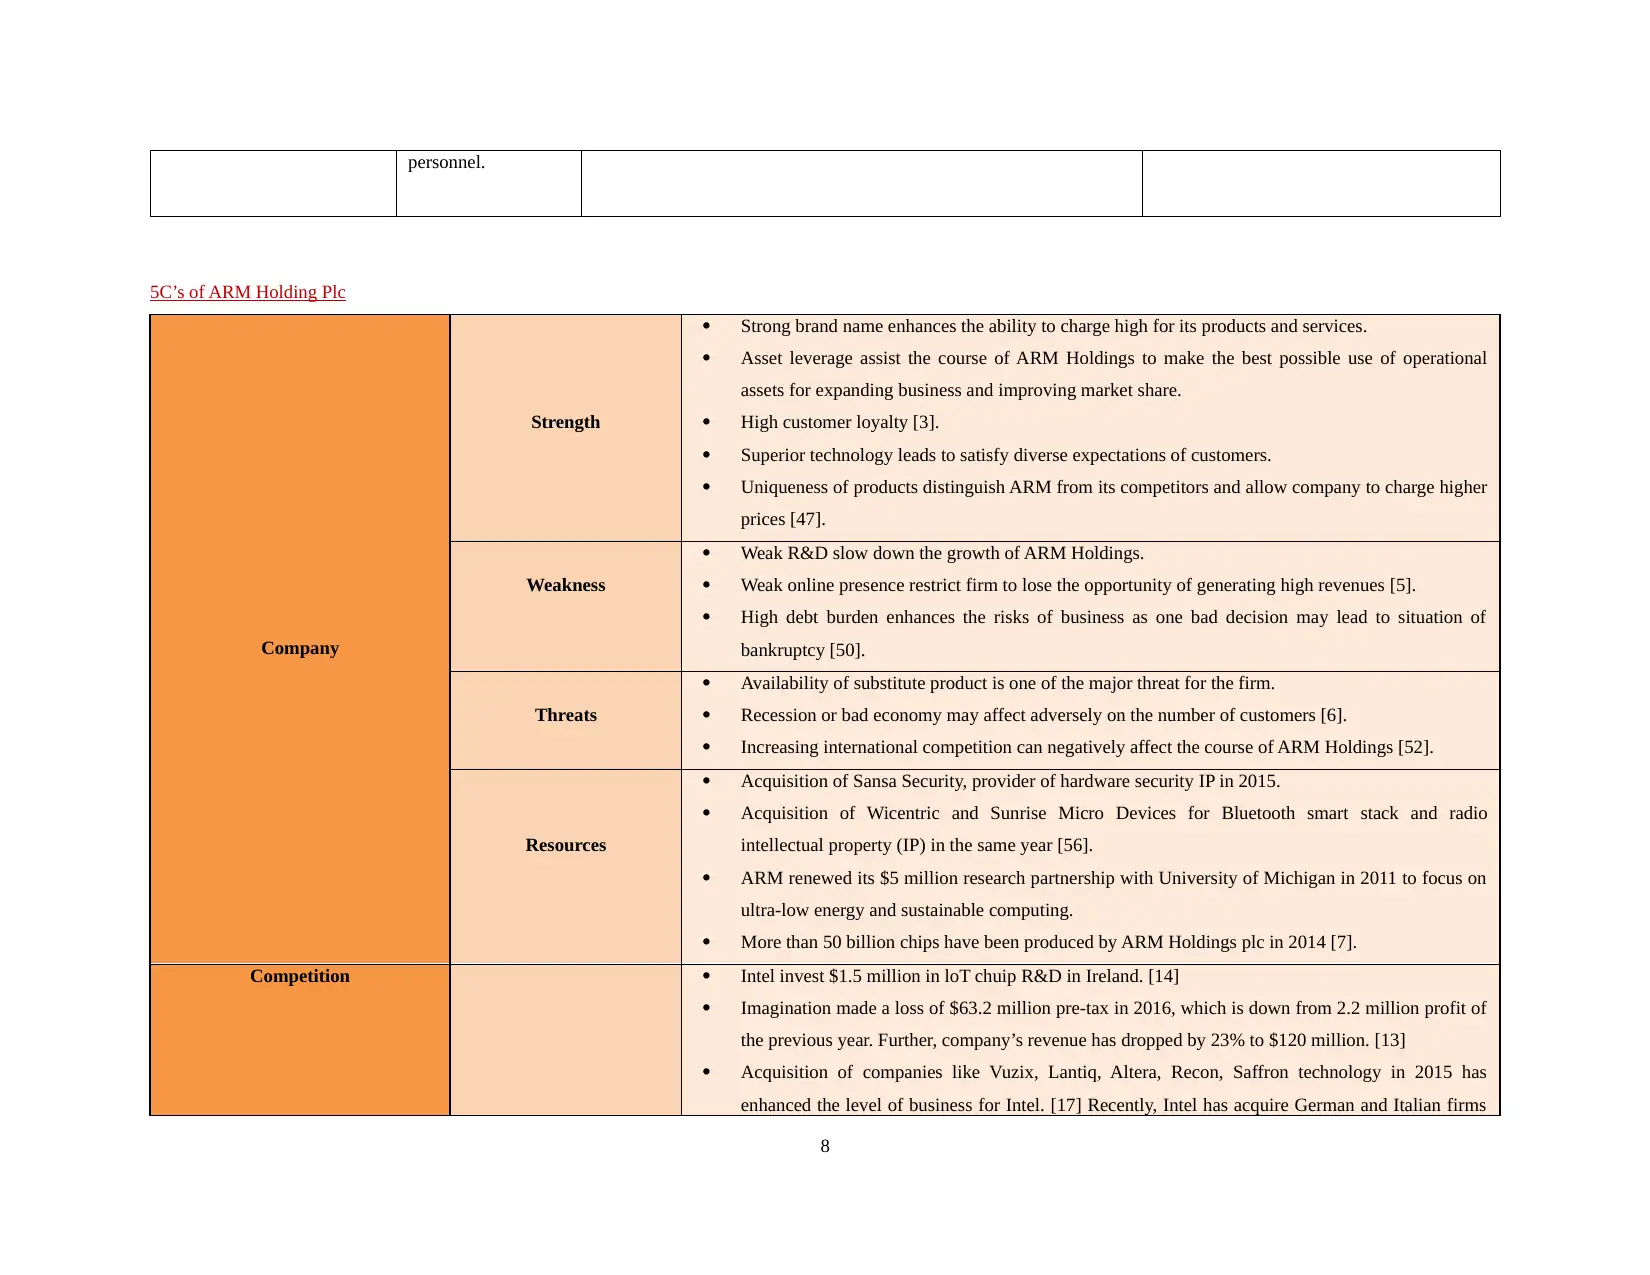
personnel.
5C’s of ARM Holding Plc
Company
Strength
Strong brand name enhances the ability to charge high for its products and services.
Asset leverage assist the course of ARM Holdings to make the best possible use of operational
assets for expanding business and improving market share.
High customer loyalty [3].
Superior technology leads to satisfy diverse expectations of customers.
Uniqueness of products distinguish ARM from its competitors and allow company to charge higher
prices [47].
Weakness
Weak R&D slow down the growth of ARM Holdings.
Weak online presence restrict firm to lose the opportunity of generating high revenues [5].
High debt burden enhances the risks of business as one bad decision may lead to situation of
bankruptcy [50].
Threats
Availability of substitute product is one of the major threat for the firm.
Recession or bad economy may affect adversely on the number of customers [6].
Increasing international competition can negatively affect the course of ARM Holdings [52].
Resources
Acquisition of Sansa Security, provider of hardware security IP in 2015.
Acquisition of Wicentric and Sunrise Micro Devices for Bluetooth smart stack and radio
intellectual property (IP) in the same year [56].
ARM renewed its $5 million research partnership with University of Michigan in 2011 to focus on
ultra-low energy and sustainable computing.
More than 50 billion chips have been produced by ARM Holdings plc in 2014 [7].
Competition Intel invest $1.5 million in loT chuip R&D in Ireland. [14]
Imagination made a loss of $63.2 million pre-tax in 2016, which is down from 2.2 million profit of
the previous year. Further, company’s revenue has dropped by 23% to $120 million. [13]
Acquisition of companies like Vuzix, Lantiq, Altera, Recon, Saffron technology in 2015 has
enhanced the level of business for Intel. [17] Recently, Intel has acquire German and Italian firms
8
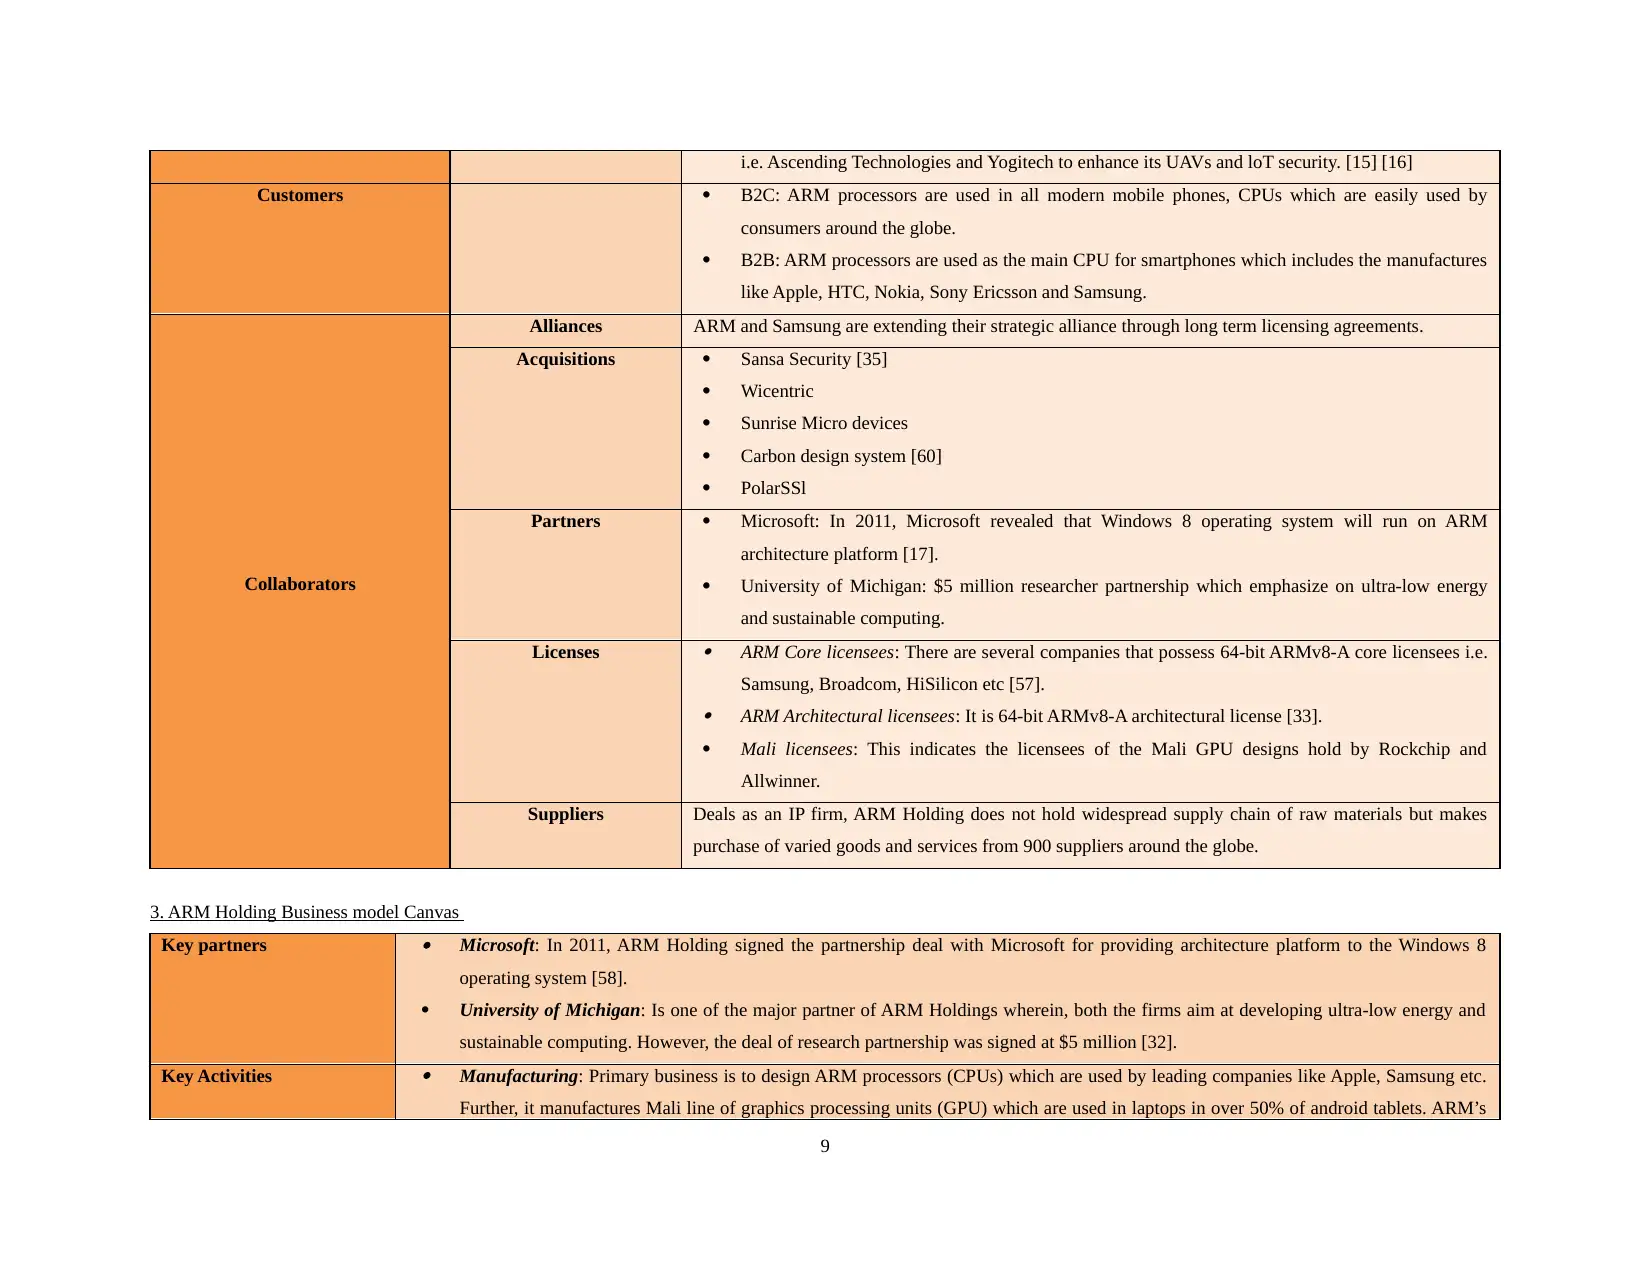
i.e. Ascending Technologies and Yogitech to enhance its UAVs and loT security. [15] [16]
Customers B2C: ARM processors are used in all modern mobile phones, CPUs which are easily used by
consumers around the globe.
B2B: ARM processors are used as the main CPU for smartphones which includes the manufactures
like Apple, HTC, Nokia, Sony Ericsson and Samsung.
Collaborators
Alliances ARM and Samsung are extending their strategic alliance through long term licensing agreements.
Acquisitions Sansa Security [35]
Wicentric
Sunrise Micro devices
Carbon design system [60]
PolarSSl
Partners Microsoft: In 2011, Microsoft revealed that Windows 8 operating system will run on ARM
architecture platform [17].
University of Michigan: $5 million researcher partnership which emphasize on ultra-low energy
and sustainable computing.
Licenses
ARM Core licensees: There are several companies that possess 64-bit ARMv8-A core licensees i.e.
Samsung, Broadcom, HiSilicon etc [57].
ARM Architectural licensees: It is 64-bit ARMv8-A architectural license [33].
Mali licensees: This indicates the licensees of the Mali GPU designs hold by Rockchip and
Allwinner.
Suppliers Deals as an IP firm, ARM Holding does not hold widespread supply chain of raw materials but makes
purchase of varied goods and services from 900 suppliers around the globe.
3. ARM Holding Business model Canvas
Key partners
Microsoft: In 2011, ARM Holding signed the partnership deal with Microsoft for providing architecture platform to the Windows 8
operating system [58].
University of Michigan: Is one of the major partner of ARM Holdings wherein, both the firms aim at developing ultra-low energy and
sustainable computing. However, the deal of research partnership was signed at $5 million [32].
Key Activities
Manufacturing: Primary business is to design ARM processors (CPUs) which are used by leading companies like Apple, Samsung etc.
Further, it manufactures Mali line of graphics processing units (GPU) which are used in laptops in over 50% of android tablets. ARM’s
9
⊘ This is a preview!⊘
Do you want full access?
Subscribe today to unlock all pages.
Trusted by 1+ million students worldwide
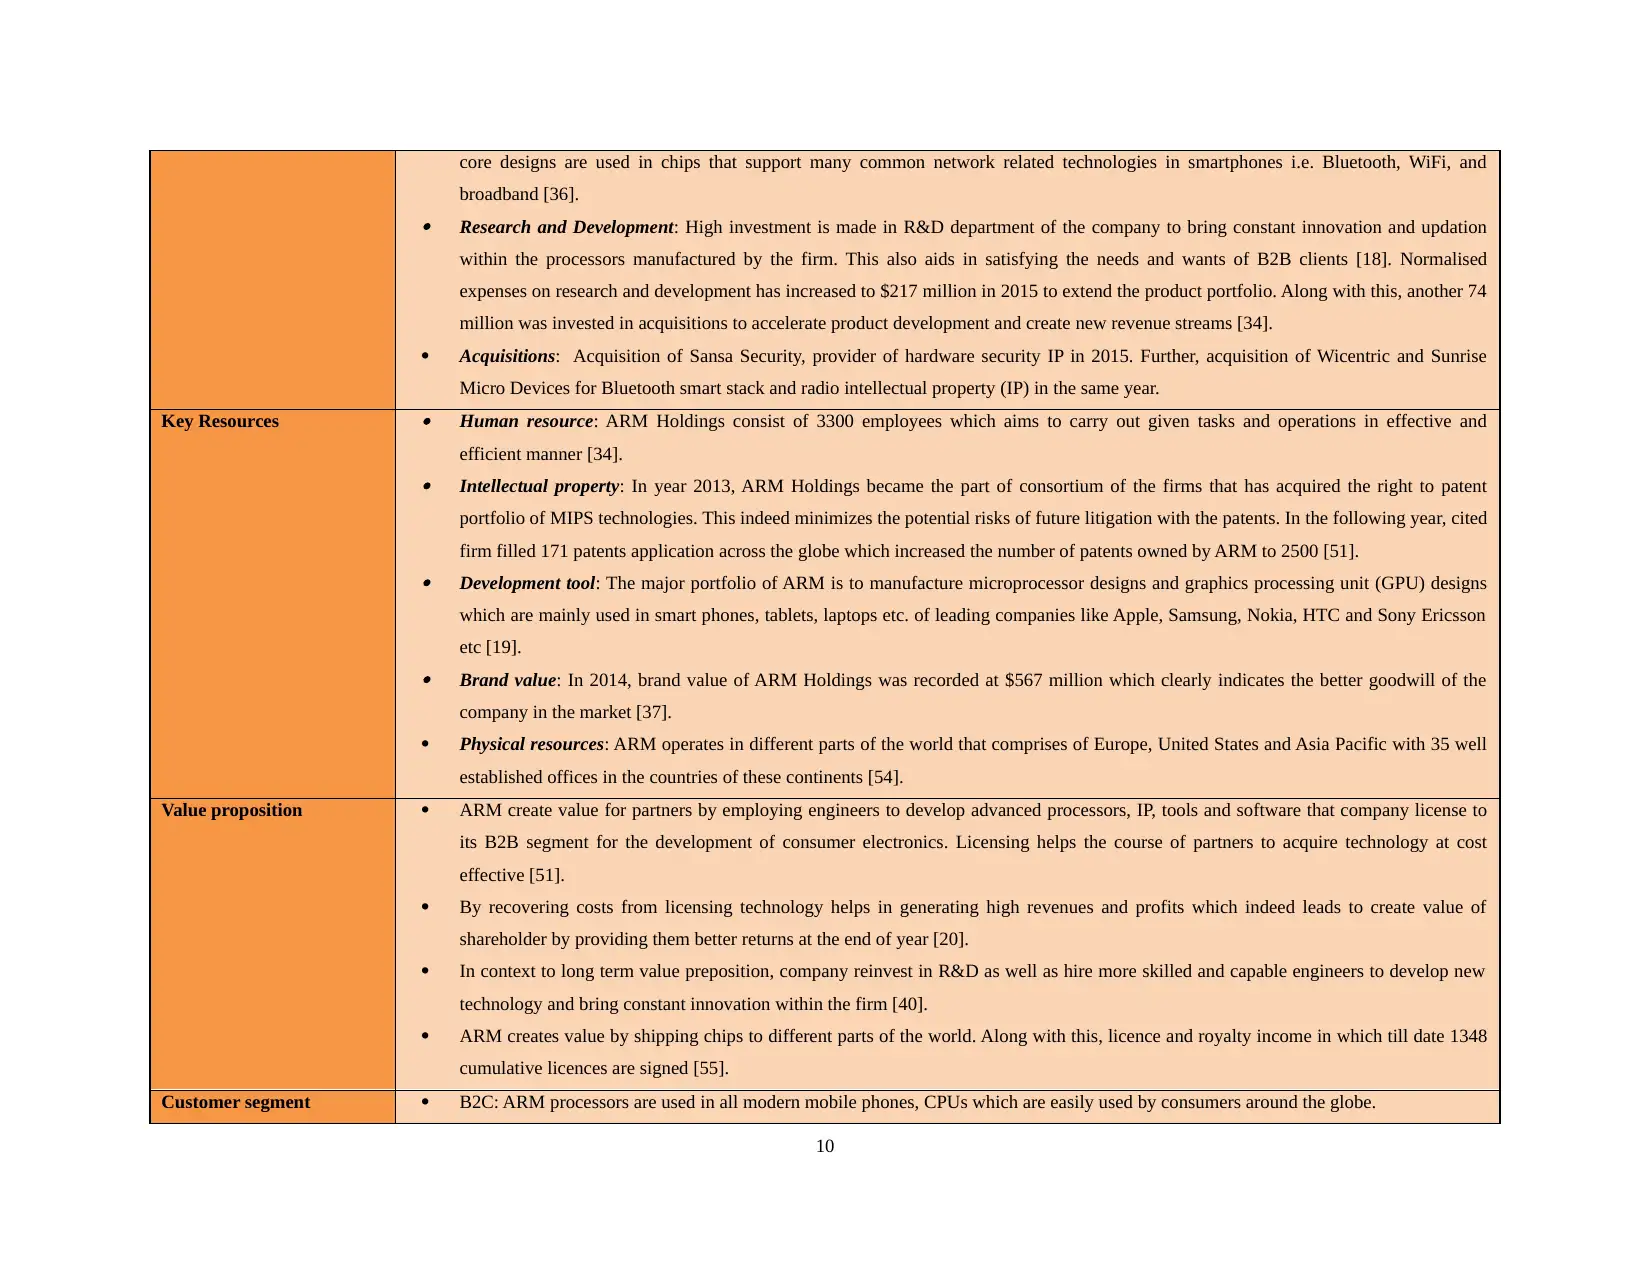
core designs are used in chips that support many common network related technologies in smartphones i.e. Bluetooth, WiFi, and
broadband [36].
Research and Development: High investment is made in R&D department of the company to bring constant innovation and updation
within the processors manufactured by the firm. This also aids in satisfying the needs and wants of B2B clients [18]. Normalised
expenses on research and development has increased to $217 million in 2015 to extend the product portfolio. Along with this, another 74
million was invested in acquisitions to accelerate product development and create new revenue streams [34].
Acquisitions: Acquisition of Sansa Security, provider of hardware security IP in 2015. Further, acquisition of Wicentric and Sunrise
Micro Devices for Bluetooth smart stack and radio intellectual property (IP) in the same year.
Key Resources
Human resource: ARM Holdings consist of 3300 employees which aims to carry out given tasks and operations in effective and
efficient manner [34].
Intellectual property: In year 2013, ARM Holdings became the part of consortium of the firms that has acquired the right to patent
portfolio of MIPS technologies. This indeed minimizes the potential risks of future litigation with the patents. In the following year, cited
firm filled 171 patents application across the globe which increased the number of patents owned by ARM to 2500 [51].
Development tool: The major portfolio of ARM is to manufacture microprocessor designs and graphics processing unit (GPU) designs
which are mainly used in smart phones, tablets, laptops etc. of leading companies like Apple, Samsung, Nokia, HTC and Sony Ericsson
etc [19].
Brand value: In 2014, brand value of ARM Holdings was recorded at $567 million which clearly indicates the better goodwill of the
company in the market [37].
Physical resources: ARM operates in different parts of the world that comprises of Europe, United States and Asia Pacific with 35 well
established offices in the countries of these continents [54].
Value proposition ARM create value for partners by employing engineers to develop advanced processors, IP, tools and software that company license to
its B2B segment for the development of consumer electronics. Licensing helps the course of partners to acquire technology at cost
effective [51].
By recovering costs from licensing technology helps in generating high revenues and profits which indeed leads to create value of
shareholder by providing them better returns at the end of year [20].
In context to long term value preposition, company reinvest in R&D as well as hire more skilled and capable engineers to develop new
technology and bring constant innovation within the firm [40].
ARM creates value by shipping chips to different parts of the world. Along with this, licence and royalty income in which till date 1348
cumulative licences are signed [55].
Customer segment B2C: ARM processors are used in all modern mobile phones, CPUs which are easily used by consumers around the globe.
10
Paraphrase This Document
Need a fresh take? Get an instant paraphrase of this document with our AI Paraphraser
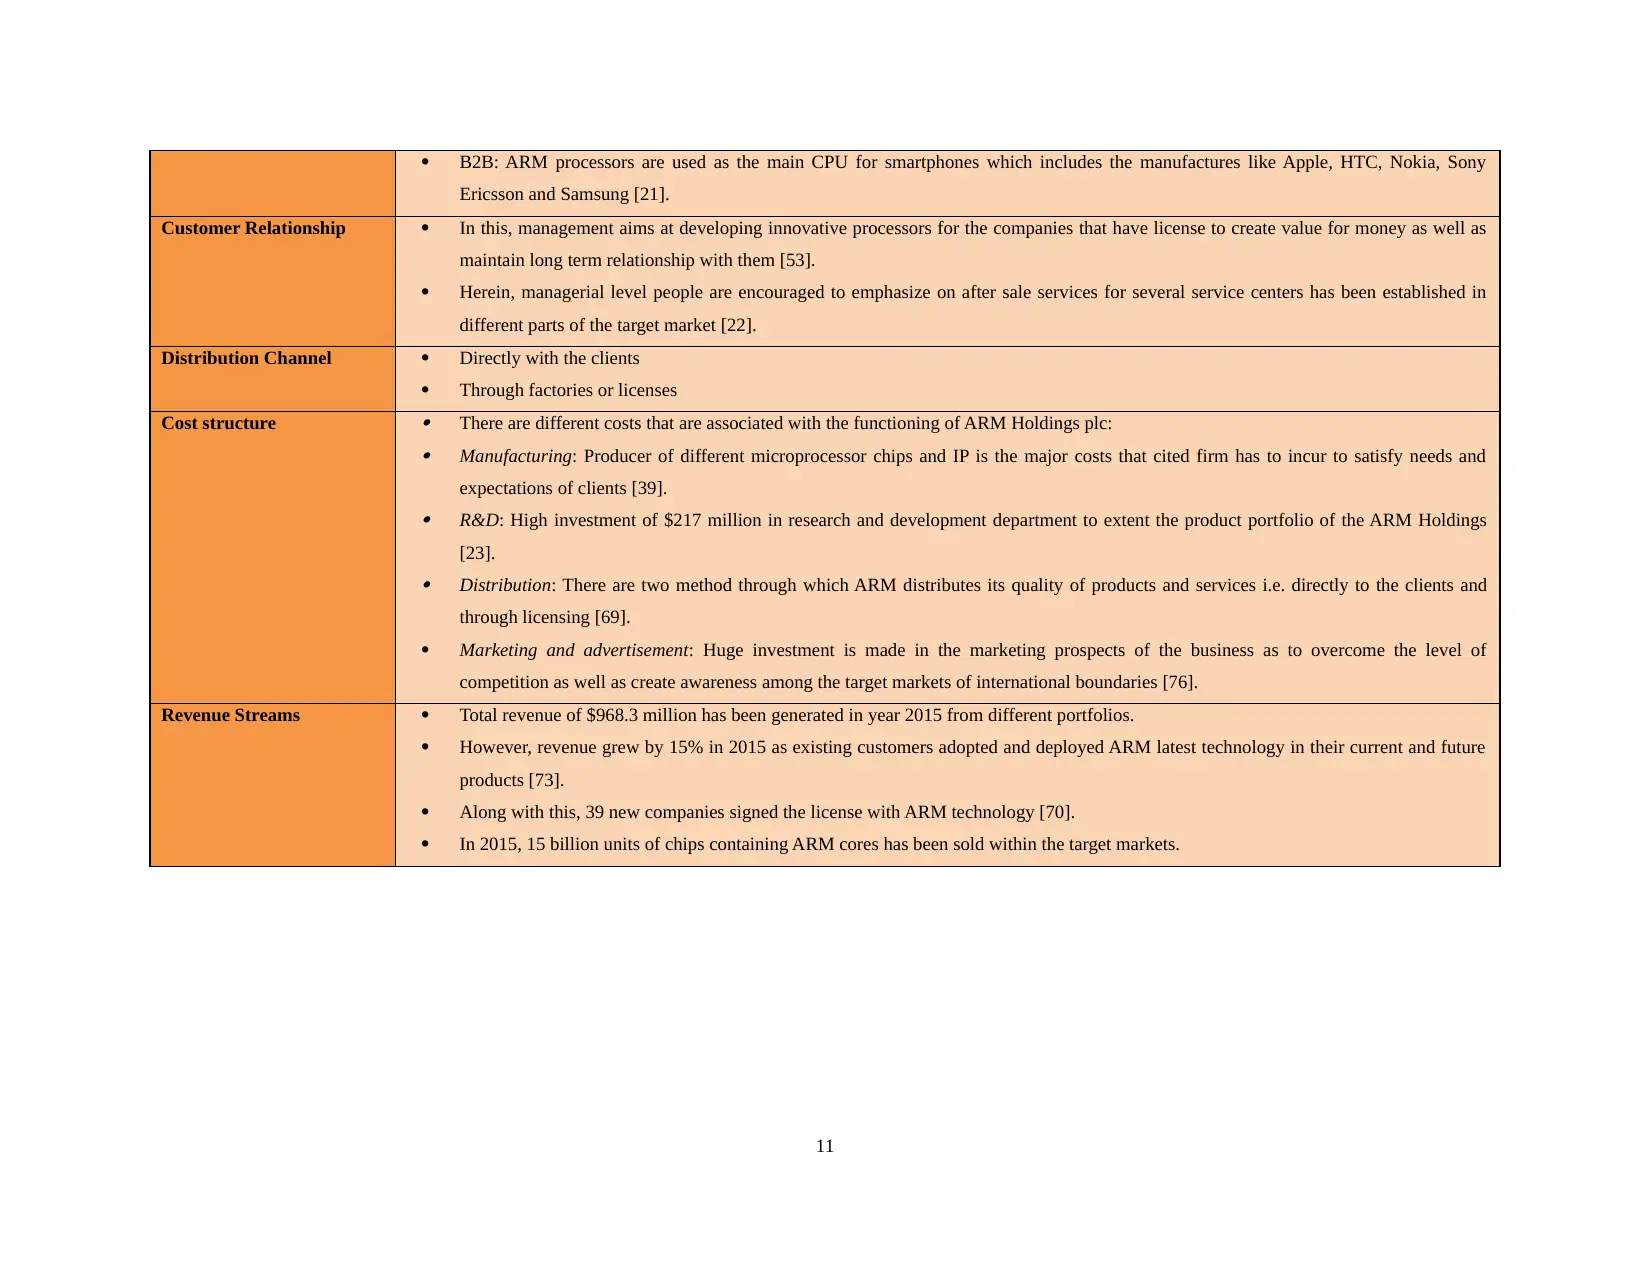
B2B: ARM processors are used as the main CPU for smartphones which includes the manufactures like Apple, HTC, Nokia, Sony
Ericsson and Samsung [21].
Customer Relationship In this, management aims at developing innovative processors for the companies that have license to create value for money as well as
maintain long term relationship with them [53].
Herein, managerial level people are encouraged to emphasize on after sale services for several service centers has been established in
different parts of the target market [22].
Distribution Channel Directly with the clients
Through factories or licenses
Cost structure
There are different costs that are associated with the functioning of ARM Holdings plc:
Manufacturing: Producer of different microprocessor chips and IP is the major costs that cited firm has to incur to satisfy needs and
expectations of clients [39].
R&D: High investment of $217 million in research and development department to extent the product portfolio of the ARM Holdings
[23].
Distribution: There are two method through which ARM distributes its quality of products and services i.e. directly to the clients and
through licensing [69].
Marketing and advertisement: Huge investment is made in the marketing prospects of the business as to overcome the level of
competition as well as create awareness among the target markets of international boundaries [76].
Revenue Streams Total revenue of $968.3 million has been generated in year 2015 from different portfolios.
However, revenue grew by 15% in 2015 as existing customers adopted and deployed ARM latest technology in their current and future
products [73].
Along with this, 39 new companies signed the license with ARM technology [70].
In 2015, 15 billion units of chips containing ARM cores has been sold within the target markets.
11
4. Acquisition of ARM Holdings Plc
Company Standard Industrial classification Value added to ARM Holding
Sansa Security (2015) Hardware security and software
industry
This added value by enhancing ARM’s IP security and software for advanced system on chip
components [9].
Wicentric (2015) Value for partners by adding Bluetooth smart smack [64].
Sunrise Micro Devices (2015) Intellectual property company The acquisition resulted in development of ARM® Cordio® portfolio in which IP of both companies
were integrated [13].
Carbon design system System validation solution industry This acquisition added value for ARM by improving its operating system as well as software system
verification and interconnect performance analysis has been improved significantly [46].
PolarSSI (2014) FlowLink Driver Software Software library implementing the SSL and TLS protocols [63].
12
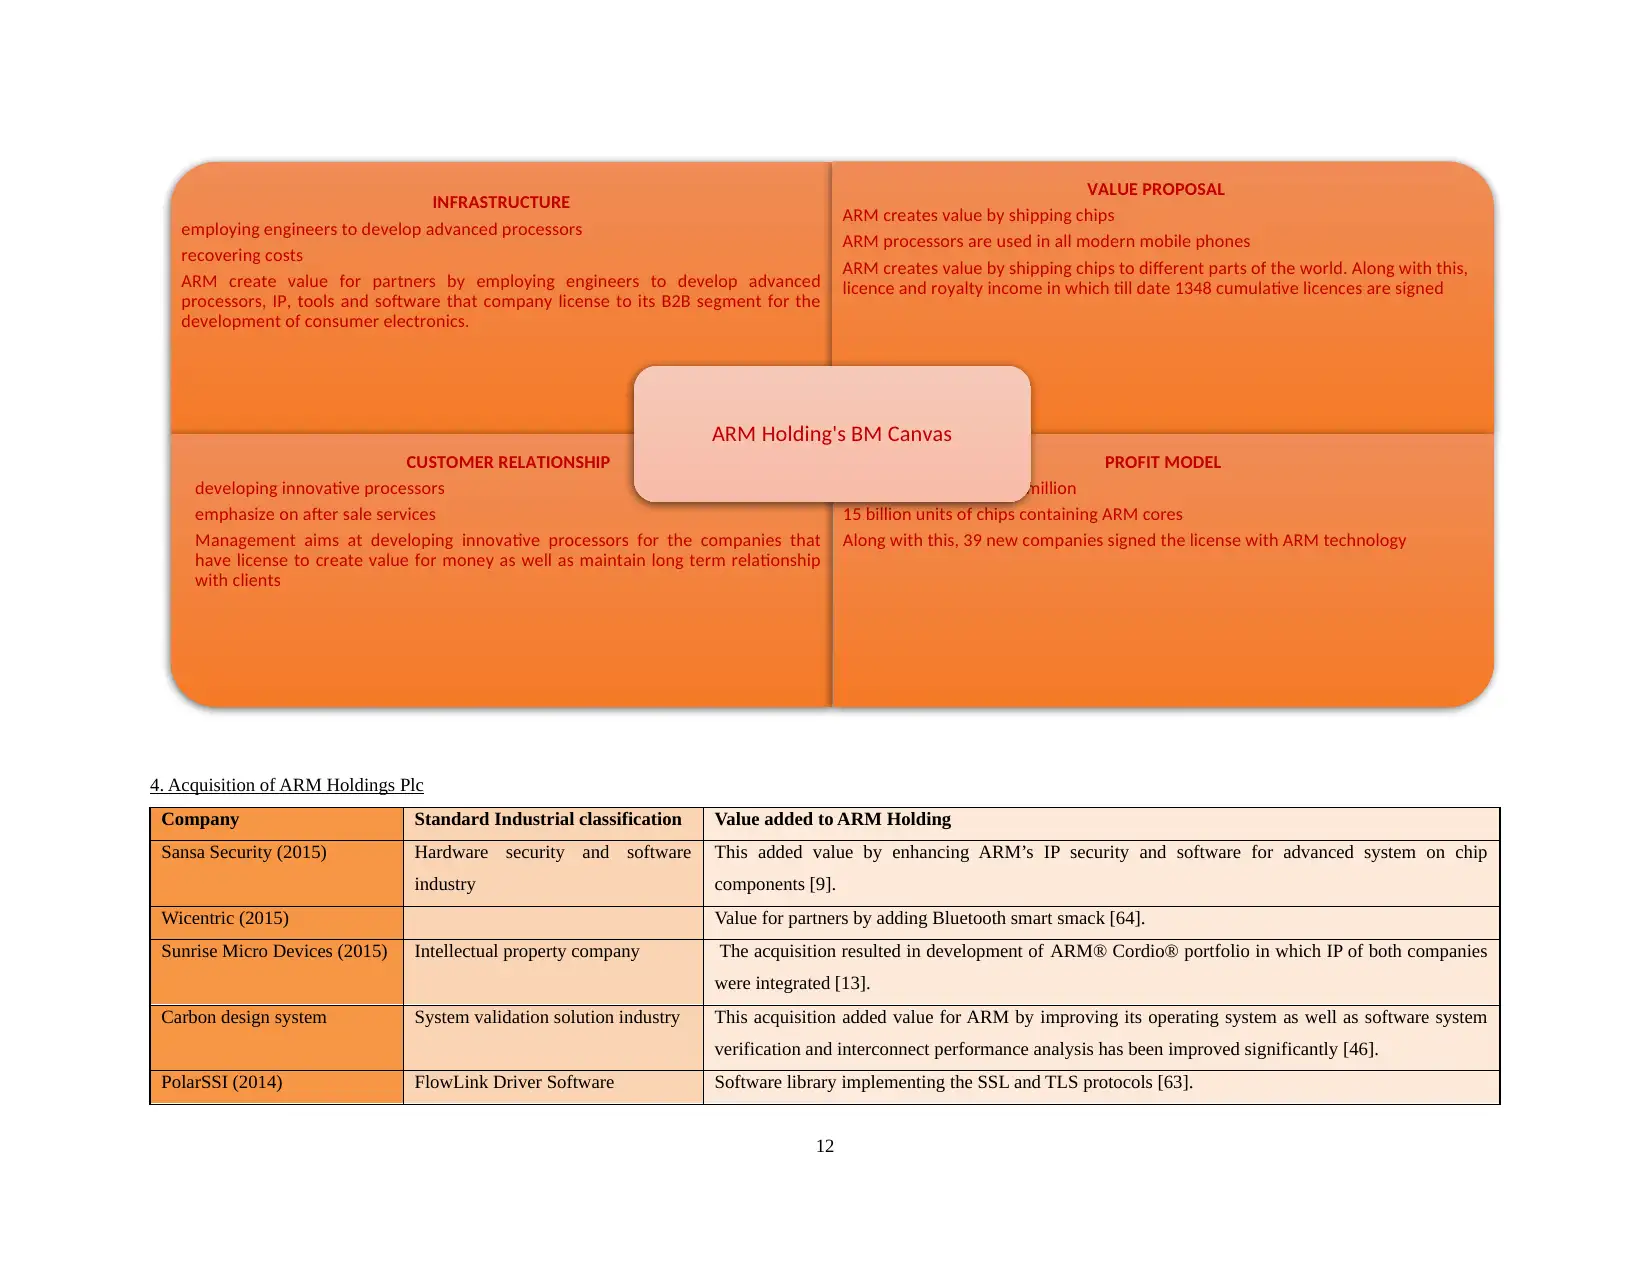
INFRASTRUCTURE
employing engineers to develop advanced processors
recovering costs
ARM create value for partners by employing engineers to develop advanced
processors, IP, tools and software that company license to its B2B segment for the
development of consumer electronics.
VALUE PROPOSAL
ARM creates value by shipping chips
ARM processors are used in all modern mobile phones
ARM creates value by shipping chips to different parts of the world. Along with this,
licence and royalty income in which till date 1348 cumulative licences are signed
CUSTOMER RELATIONSHIP
developing innovative processors
emphasize on after sale services
Management aims at developing innovative processors for the companies that
have license to create value for money as well as maintain long term relationship
with clients
PROFIT MODEL
Total revenue of $968.3 million
15 billion units of chips containing ARM cores
Along with this, 39 new companies signed the license with ARM technology
ARM Holding's BM Canvas
Company Standard Industrial classification Value added to ARM Holding
Sansa Security (2015) Hardware security and software
industry
This added value by enhancing ARM’s IP security and software for advanced system on chip
components [9].
Wicentric (2015) Value for partners by adding Bluetooth smart smack [64].
Sunrise Micro Devices (2015) Intellectual property company The acquisition resulted in development of ARM® Cordio® portfolio in which IP of both companies
were integrated [13].
Carbon design system System validation solution industry This acquisition added value for ARM by improving its operating system as well as software system
verification and interconnect performance analysis has been improved significantly [46].
PolarSSI (2014) FlowLink Driver Software Software library implementing the SSL and TLS protocols [63].
12
INFRASTRUCTURE
employing engineers to develop advanced processors
recovering costs
ARM create value for partners by employing engineers to develop advanced
processors, IP, tools and software that company license to its B2B segment for the
development of consumer electronics.
VALUE PROPOSAL
ARM creates value by shipping chips
ARM processors are used in all modern mobile phones
ARM creates value by shipping chips to different parts of the world. Along with this,
licence and royalty income in which till date 1348 cumulative licences are signed
CUSTOMER RELATIONSHIP
developing innovative processors
emphasize on after sale services
Management aims at developing innovative processors for the companies that
have license to create value for money as well as maintain long term relationship
with clients
PROFIT MODEL
Total revenue of $968.3 million
15 billion units of chips containing ARM cores
Along with this, 39 new companies signed the license with ARM technology
ARM Holding's BM Canvas
⊘ This is a preview!⊘
Do you want full access?
Subscribe today to unlock all pages.
Trusted by 1+ million students worldwide
1 out of 31
Related Documents


Your All-in-One AI-Powered Toolkit for Academic Success.
+13062052269
info@desklib.com
Available 24*7 on WhatsApp / Email
![[object Object]](/_next/static/media/star-bottom.7253800d.svg)
Unlock your academic potential
Copyright © 2020–2026 A2Z Services. All Rights Reserved. Developed and managed by ZUCOL.