AROA BIOSURGERY LTD: Accounting Principles and Practices Report

Verified

Added on  2023/06/17

|13
|1303
|138
Report
AI Summary
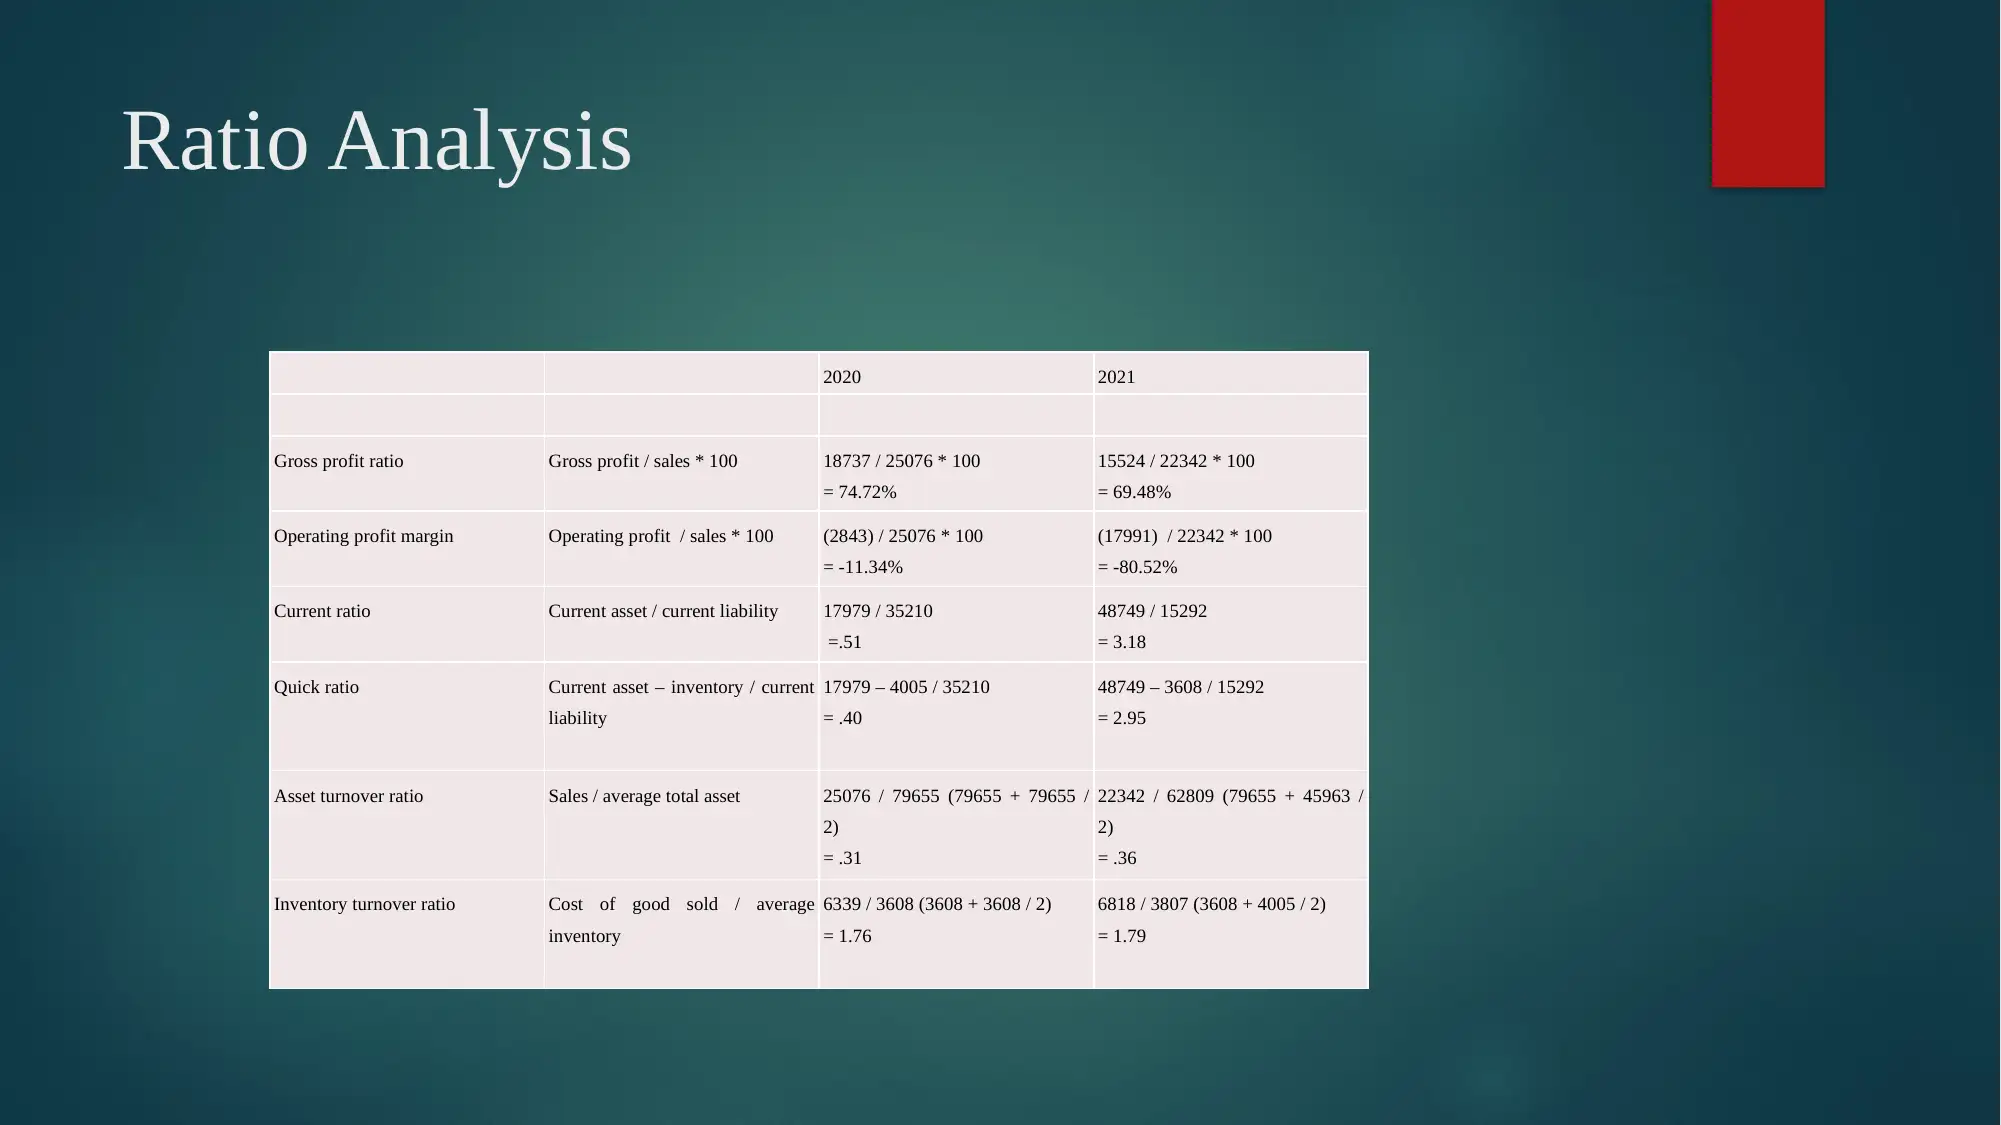
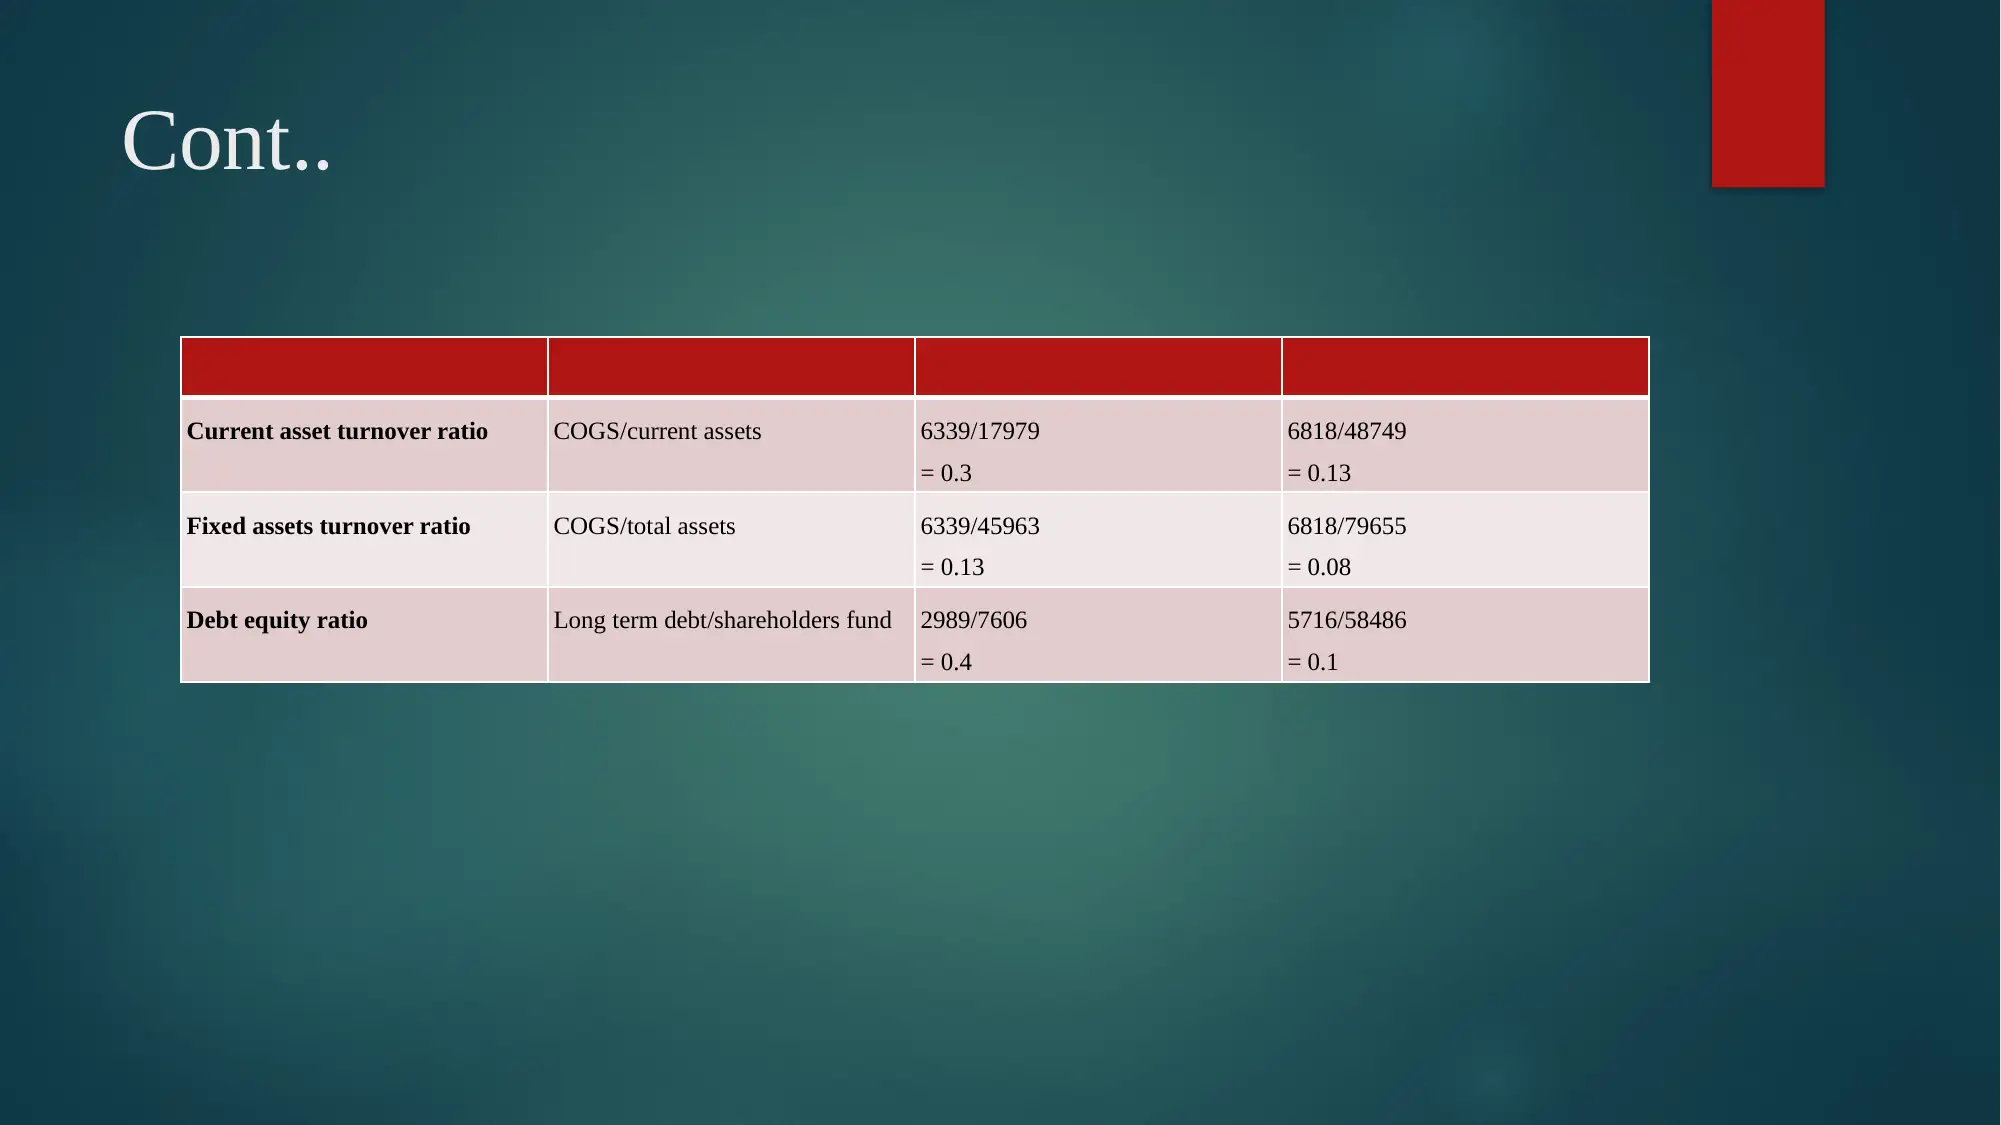
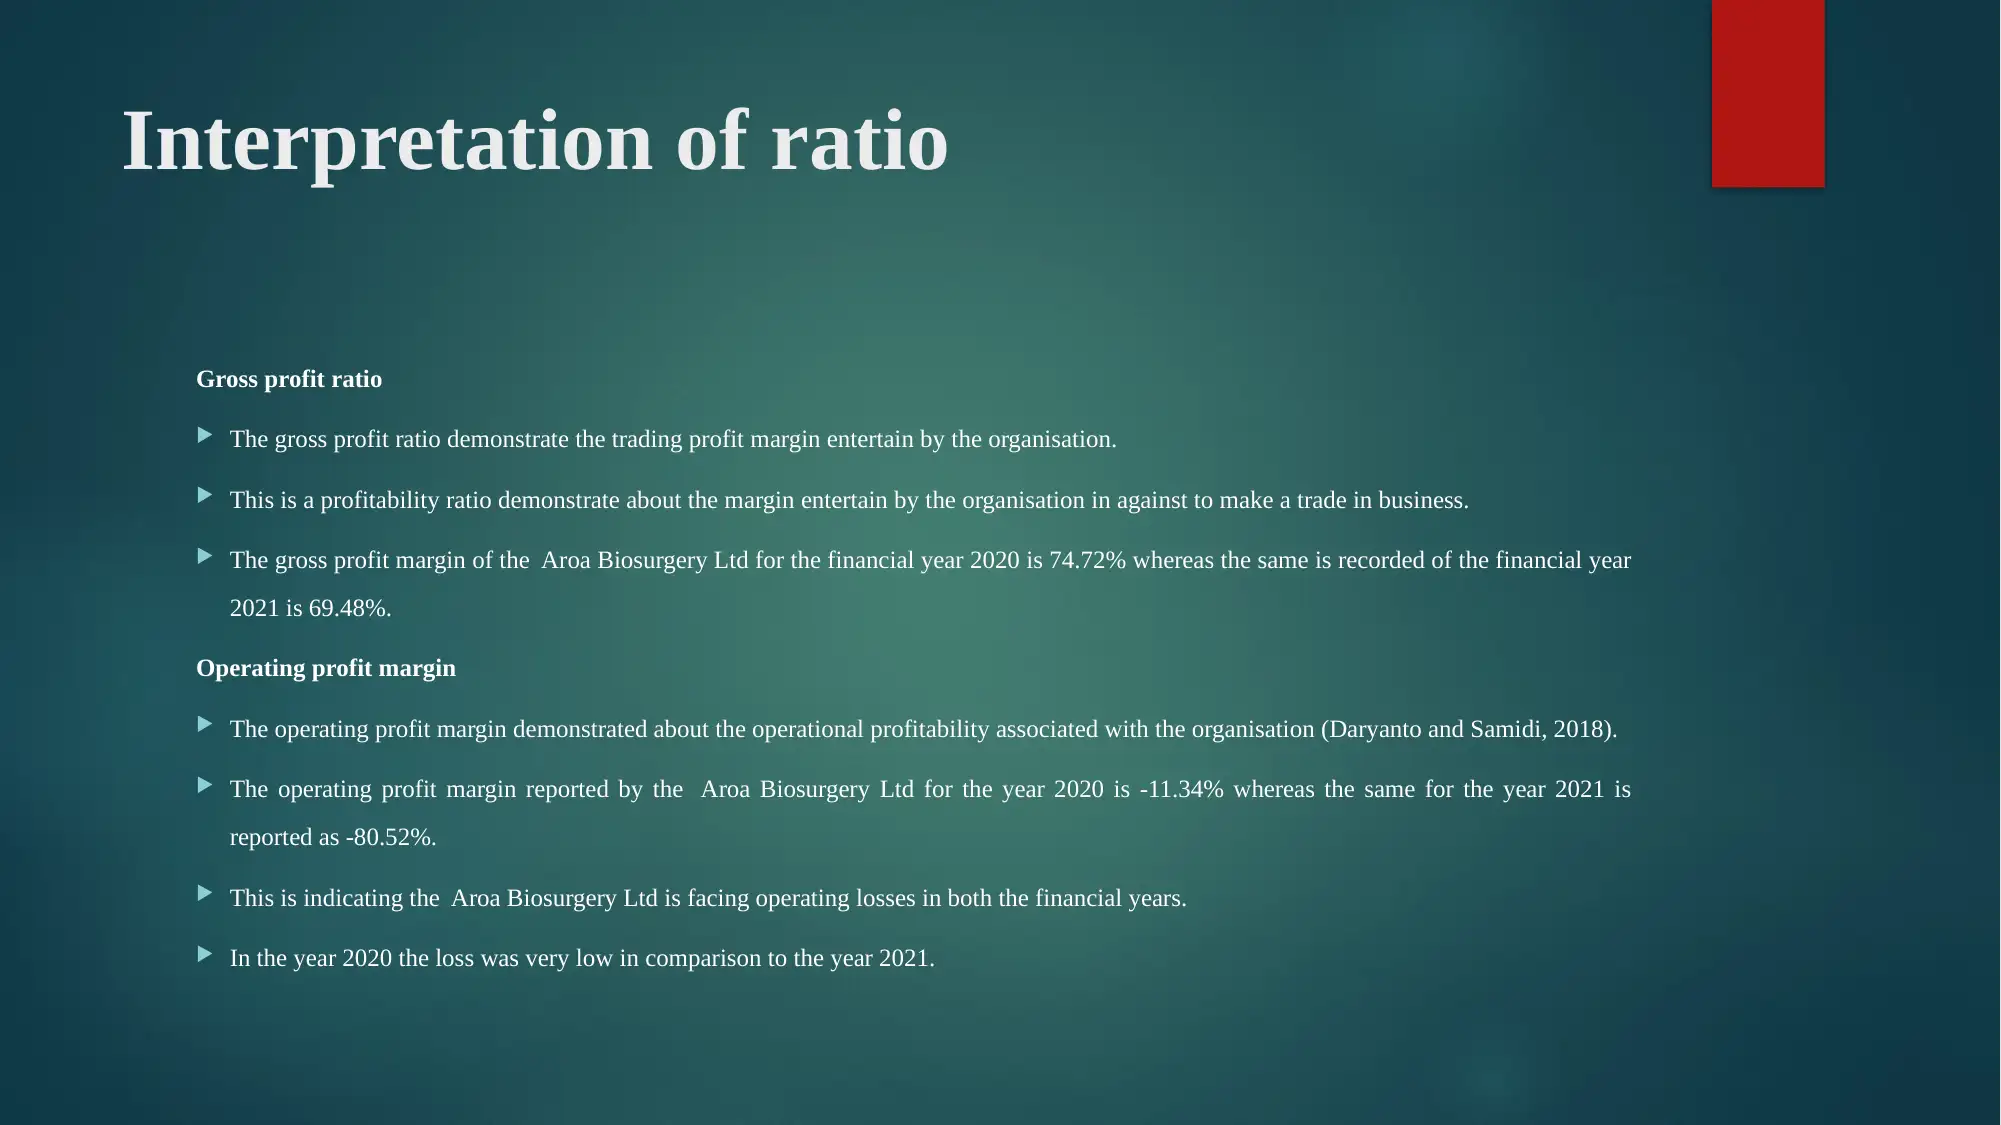
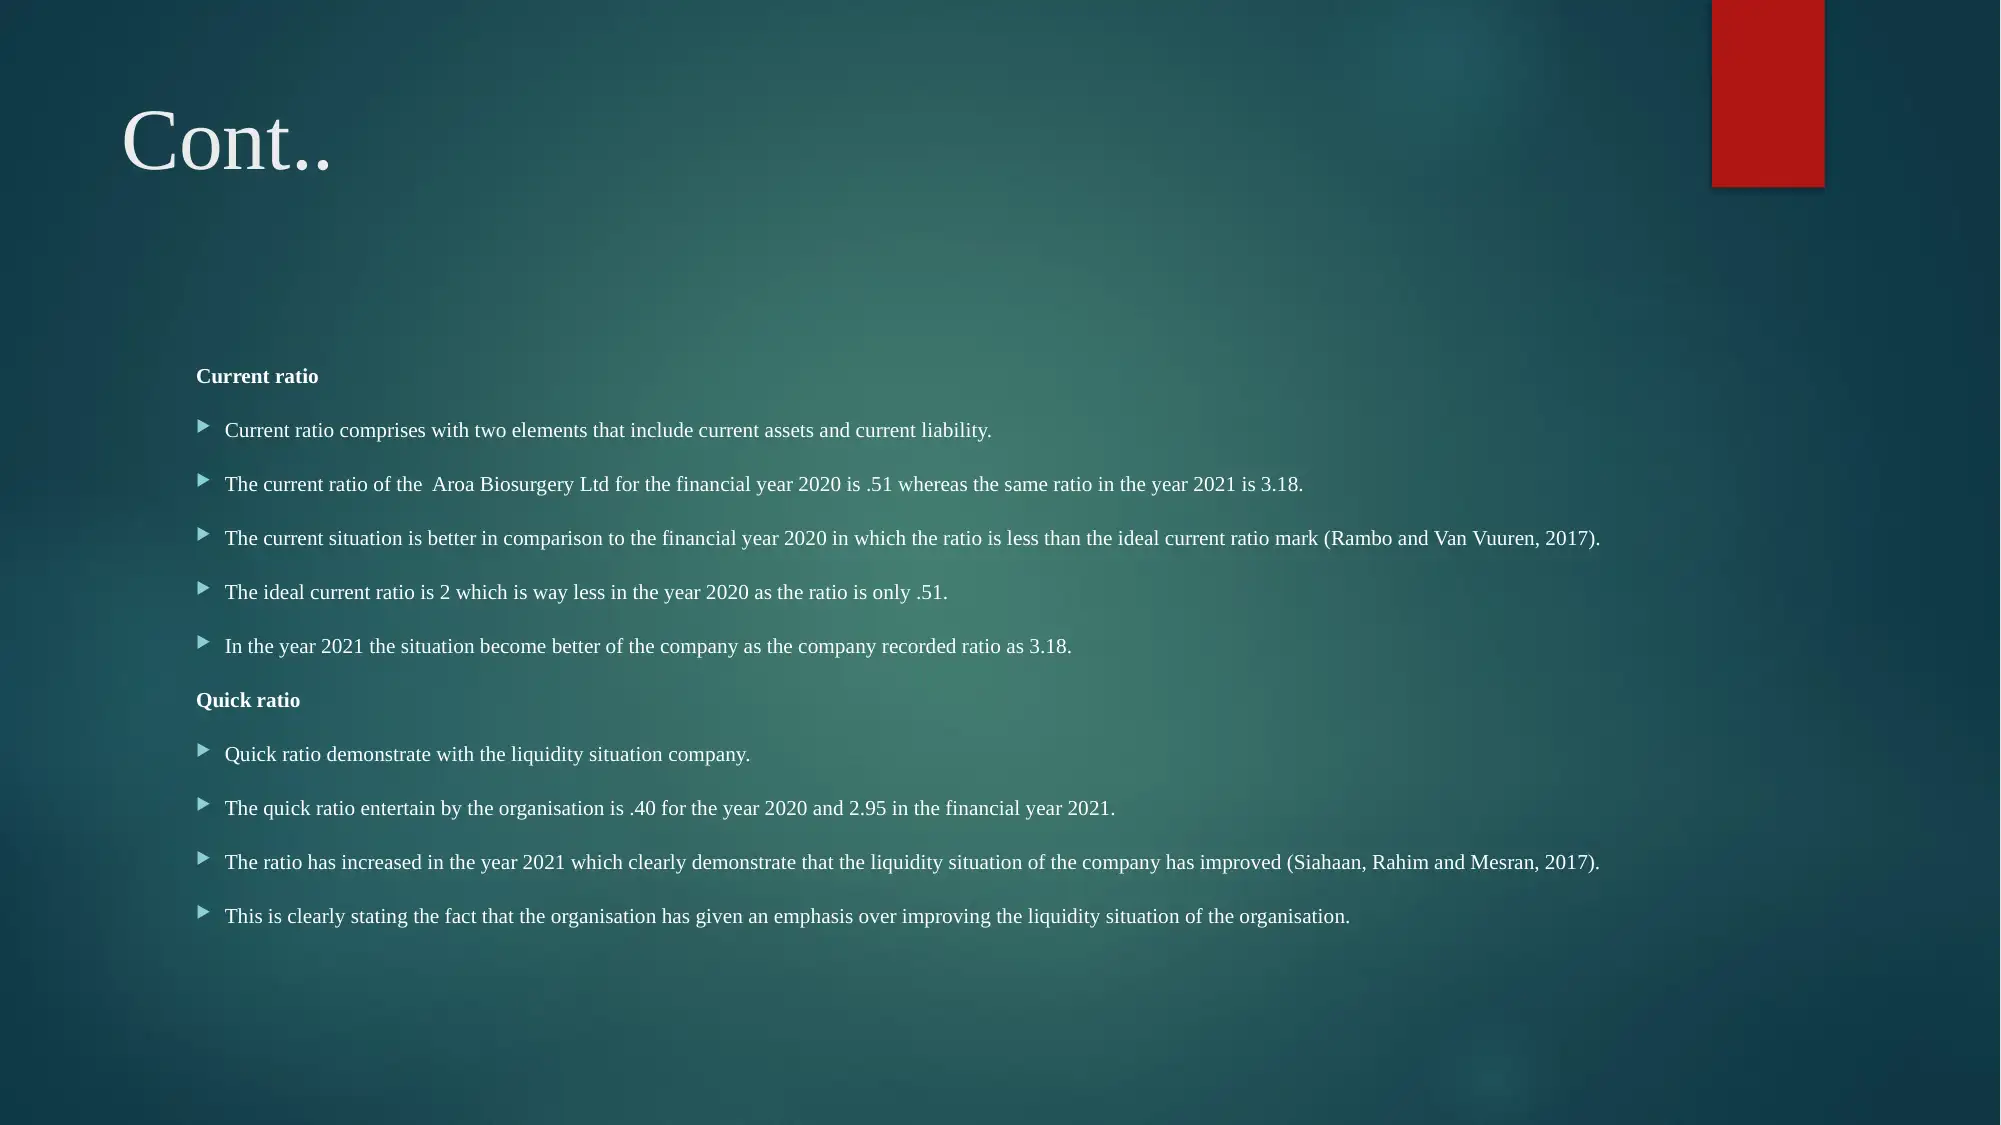
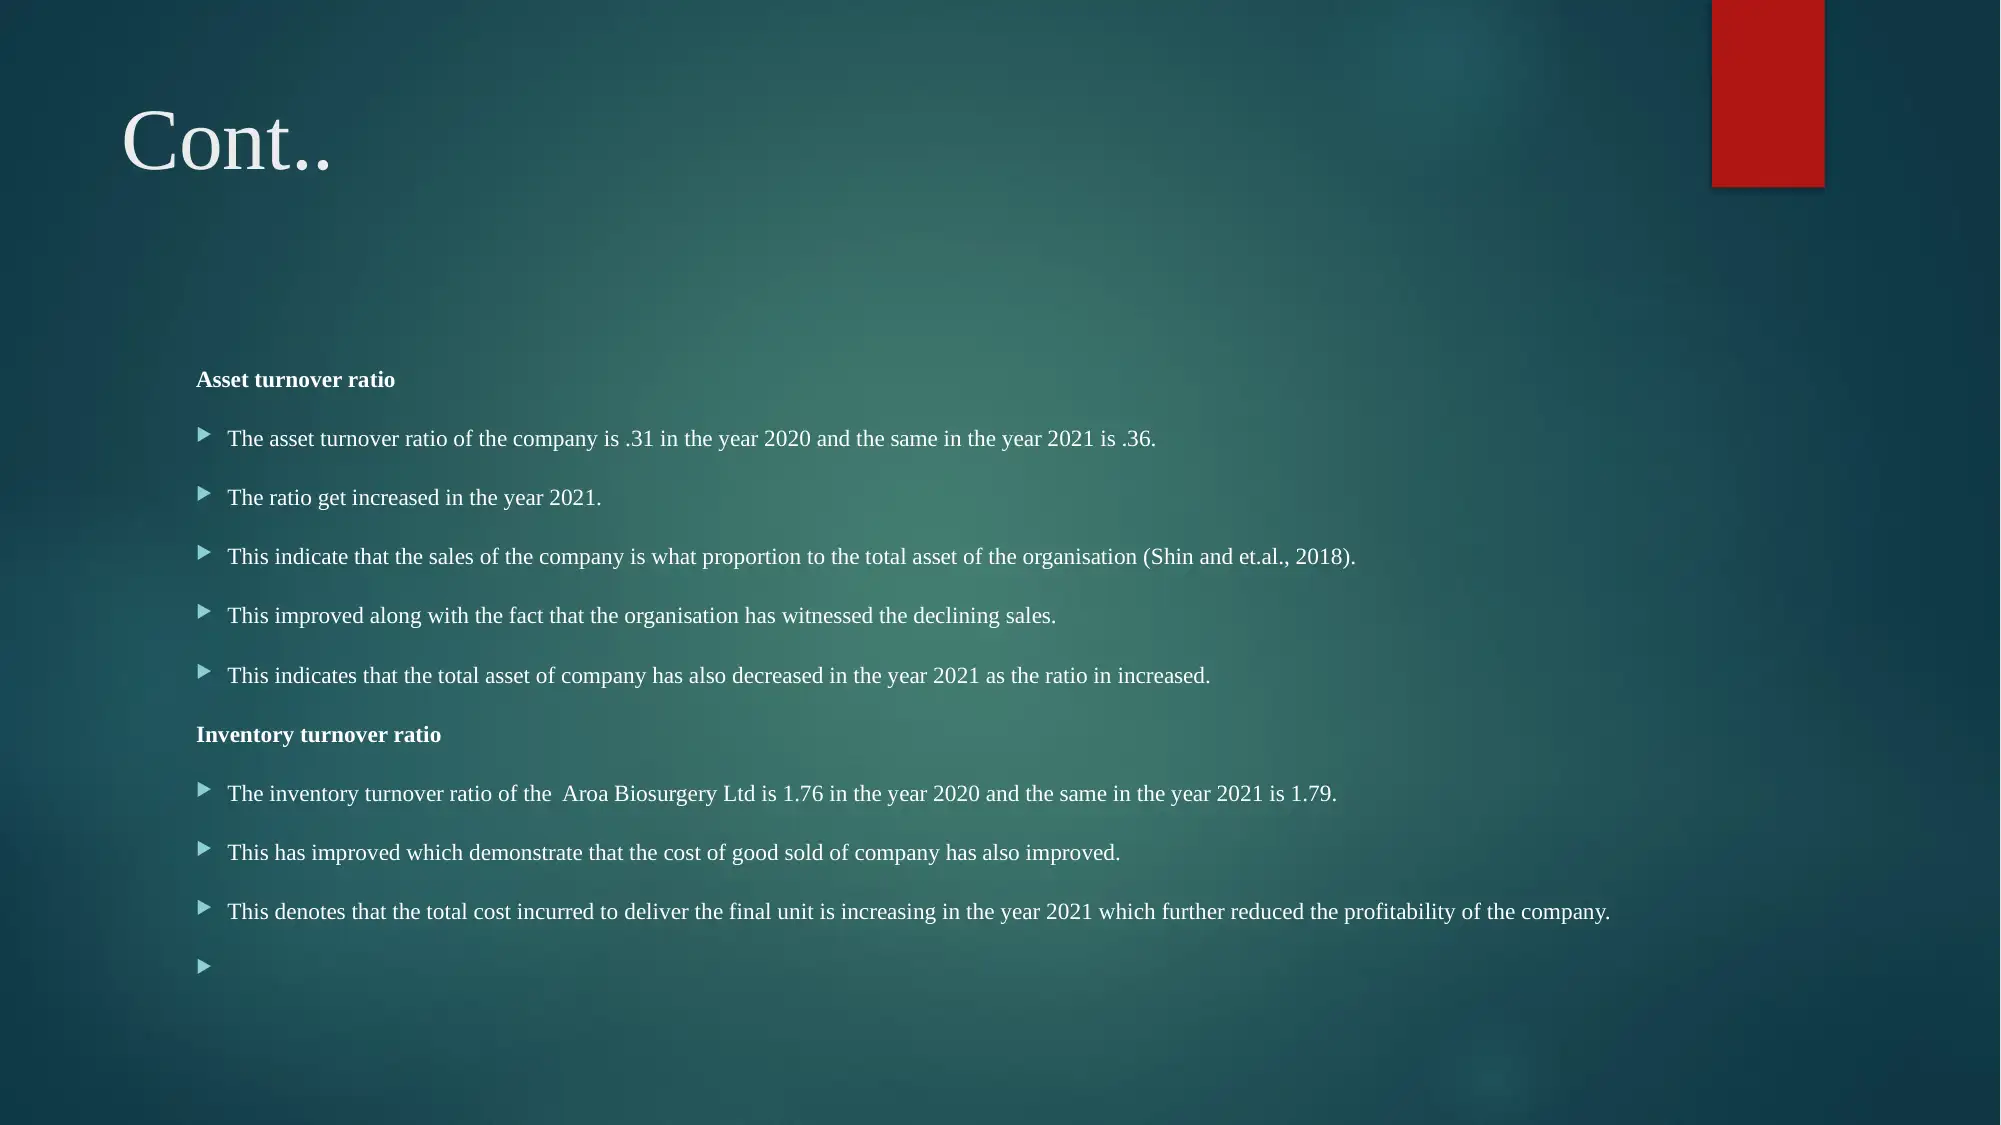
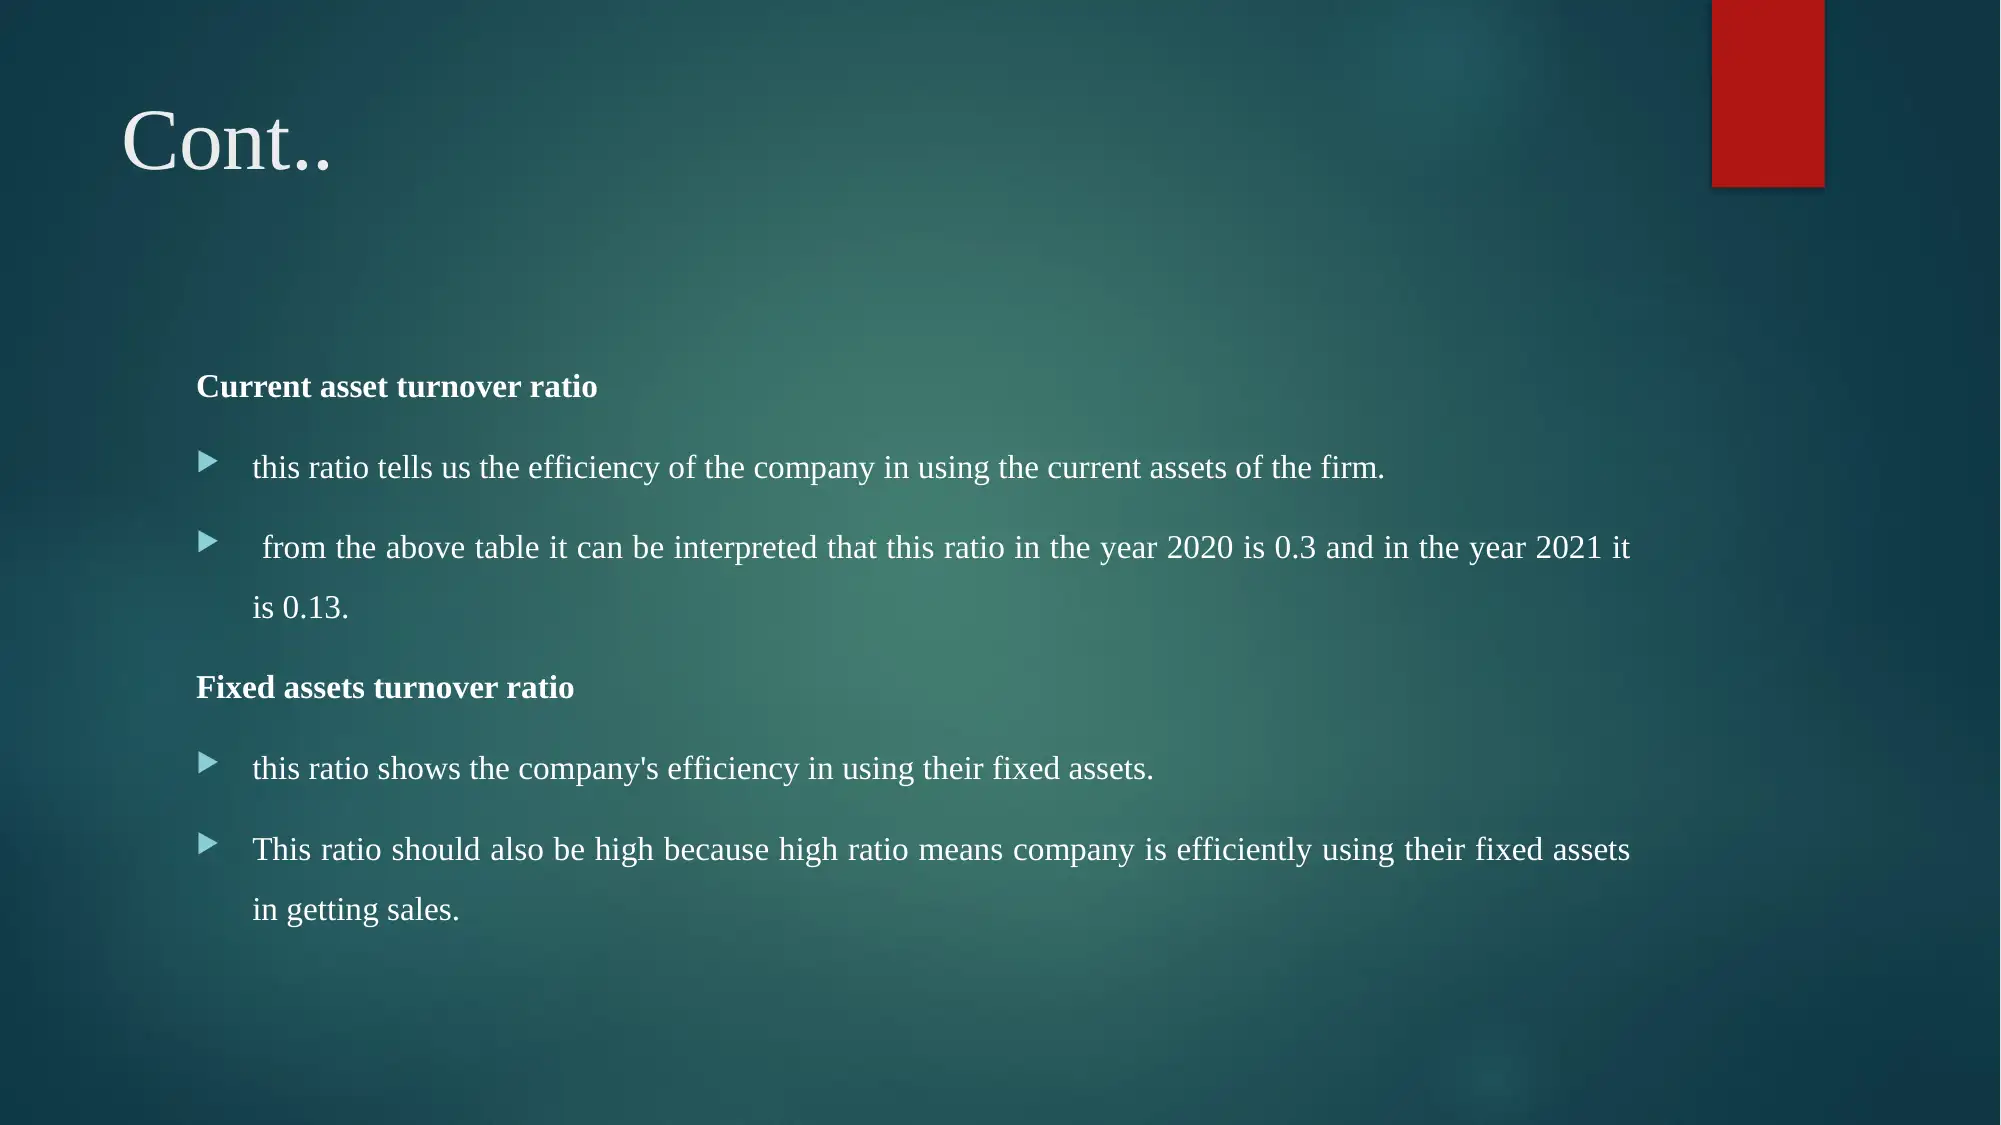
This report provides a financial analysis of Aroa Biosurgery Ltd, focusing on key accounting principles and practices. It includes a detailed ratio analysis covering gross profit ratio, operating profit margin, current ratio, quick ratio, asset turnover ratio, inventory turnover ratio, current asset turnover ratio, fixed assets turnover ratio, and debt-equity ratio for the years 2020 and 2021. The analysis interprets these ratios to assess the company's profitability, liquidity, and financial leverage, noting a decline in sales and operating profit margin in 2021 compared to 2020. The report concludes that while the company experienced improved liquidity in 2021, profitability declined, and it emphasizes the importance of monitoring debt levels. The findings are supported by relevant references to academic sources.
Document Page
Accounting Principles
and Practices
AROA BIOSURGERY LTD
tabler-icon-diamond-filled.svg

Paraphrase This Document

Need a fresh take? Get an instant paraphrase of this document with our AI Paraphraser
Document Page
Table of content
INTRODUCTION
Ratio Analysis
Ratio Interpretation
Conclusion
REFERENCES
Document Page
INTRODUCTION
Accounting principles are denoted as fundamentals behind projecting the accounting books and statements.
These are the key requirements that direct the books of accounts to be presented in the books in the most
efficient manner.
This report is based on the case study of Aroa Biosurgery Ltd in context to its financial management
practices.
The company is founded in the year 2008 contain the headquarter in Auckland, Newland.
Company is currently listed under the Australian stock exchange.
The organisation is involved under manufacture and producing medical and surgical products that can
provide key medical requirement to cure the complex wounds and soft tissue reconstruction.
Document Page
Ratio Analysis
2020 2021
Gross profit ratio Gross profit / sales * 100 18737 / 25076 * 100
= 74.72%
15524 / 22342 * 100
= 69.48%
Operating profit margin Operating profit / sales * 100 (2843) / 25076 * 100
= -11.34%
(17991) / 22342 * 100
= -80.52%
Current ratio Current asset / current liability 17979 / 35210
=.51
48749 / 15292
= 3.18
Quick ratio Current asset – inventory / current
liability
17979 – 4005 / 35210
= .40
48749 – 3608 / 15292
= 2.95
Asset turnover ratio Sales / average total asset 25076 / 79655 (79655 + 79655 /
2)
= .31
22342 / 62809 (79655 + 45963 /
2)
= .36
Inventory turnover ratio Cost of good sold / average
inventory
6339 / 3608 (3608 + 3608 / 2)
= 1.76
6818 / 3807 (3608 + 4005 / 2)
= 1.79
tabler-icon-diamond-filled.svg

Paraphrase This Document

Need a fresh take? Get an instant paraphrase of this document with our AI Paraphraser
Document Page
Cont..
Current asset turnover ratio COGS/current assets 6339/17979
= 0.3
6818/48749
= 0.13
Fixed assets turnover ratio COGS/total assets 6339/45963
= 0.13
6818/79655
= 0.08
Debt equity ratio Long term debt/shareholders fund 2989/7606
= 0.4
5716/58486
= 0.1
Document Page
Interpretation of ratio
Gross profit ratio
The gross profit ratio demonstrate the trading profit margin entertain by the organisation.
This is a profitability ratio demonstrate about the margin entertain by the organisation in against to make a trade in business.
The gross profit margin of the Aroa Biosurgery Ltd for the financial year 2020 is 74.72% whereas the same is recorded of the financial year
2021 is 69.48%.
Operating profit margin
The operating profit margin demonstrated about the operational profitability associated with the organisation (Daryanto and Samidi, 2018).
The operating profit margin reported by the Aroa Biosurgery Ltd for the year 2020 is -11.34% whereas the same for the year 2021 is
reported as -80.52%.
This is indicating the Aroa Biosurgery Ltd is facing operating losses in both the financial years.
In the year 2020 the loss was very low in comparison to the year 2021.
Document Page
Cont..
Current ratio
Current ratio comprises with two elements that include current assets and current liability.
The current ratio of the Aroa Biosurgery Ltd for the financial year 2020 is .51 whereas the same ratio in the year 2021 is 3.18.
The current situation is better in comparison to the financial year 2020 in which the ratio is less than the ideal current ratio mark (Rambo and Van Vuuren, 2017).
The ideal current ratio is 2 which is way less in the year 2020 as the ratio is only .51.
In the year 2021 the situation become better of the company as the company recorded ratio as 3.18.
Quick ratio
Quick ratio demonstrate with the liquidity situation company.
The quick ratio entertain by the organisation is .40 for the year 2020 and 2.95 in the financial year 2021.
The ratio has increased in the year 2021 which clearly demonstrate that the liquidity situation of the company has improved (Siahaan, Rahim and Mesran, 2017).
This is clearly stating the fact that the organisation has given an emphasis over improving the liquidity situation of the organisation.
tabler-icon-diamond-filled.svg

Paraphrase This Document

Need a fresh take? Get an instant paraphrase of this document with our AI Paraphraser
Document Page
Cont..
Asset turnover ratio
The asset turnover ratio of the company is .31 in the year 2020 and the same in the year 2021 is .36.
The ratio get increased in the year 2021.
This indicate that the sales of the company is what proportion to the total asset of the organisation (Shin and et.al., 2018).
This improved along with the fact that the organisation has witnessed the declining sales.
This indicates that the total asset of company has also decreased in the year 2021 as the ratio in increased.
Inventory turnover ratio
The inventory turnover ratio of the Aroa Biosurgery Ltd is 1.76 in the year 2020 and the same in the year 2021 is 1.79.
This has improved which demonstrate that the cost of good sold of company has also improved.
This denotes that the total cost incurred to deliver the final unit is increasing in the year 2021 which further reduced the profitability of the company.
Document Page
Cont..
Current asset turnover ratio
this ratio tells us the efficiency of the company in using the current assets of the firm.
from the above table it can be interpreted that this ratio in the year 2020 is 0.3 and in the year 2021 it
is 0.13.
Fixed assets turnover ratio
this ratio shows the company's efficiency in using their fixed assets.
This ratio should also be high because high ratio means company is efficiently using their fixed assets
in getting sales.
Document Page
cont..
Debt equity ratio
this ratio is used to calculate the financial leverage of the organisation.
It is the matrix to check that the organisation is financing the operation via debt as
compared to the owned funds.
If this ratio is high then it will indicate that company is at more risk to the stakeholders.
tabler-icon-diamond-filled.svg

Paraphrase This Document

Need a fresh take? Get an instant paraphrase of this document with our AI Paraphraser
Document Page
Conclusion
Through this report it can be concluded that from the gross profit ratio it can be seen that company
have experienced low sale in the year 2021 as compared to 2020.
in the operating profit margin also it can be seen that company is making more loss in the year 2021
when compared with the year 2020.
Document Page
REFERENCES
Sales, E. A., Ghirardi, M. L. and Jorquera, O., 2017. Subcritical ethylic biodiesel production from wet animal fat
and vegetable oils: A net energy ratio analysis. Energy Conversion and Management. 141. pp.216-223.
Daryanto, W. M. and Samidi, S., 2018. A Financial Ratio Analysis of Oil and Gas Private Company in Indonesia:
Before and After Declining the Oil Production. International Journal of Business Studies. 2(2). pp.74-83.
Rambo, J. and Van Vuuren, G., 2017. An omega ratio analysis of global hedge fund returns. Journal of Applied
Business Research (JABR). 33(3). pp.565-586.
Siahaan, A. P. U., Rahim, R. and Mesran, M., 2017. Student Admission Assesment using Multi-Objective
Optimization on the Basis of Ratio Analysis.
Shin, J. K. and et.al., 2018. Contact ratio analysis of the Rzeppa joint based on full-static modeling. Mechanism
and Machine Theory. 119. pp.236-251.
chevron_up_icon
1 out of 13
circle_padding
hide_on_mobile
zoom_out_icon
[object Object]