AS/AD Model and Economic Policies: Detailed Analysis

Verified

Added on  2020/03/02

|6
|1380
|240
Report
AI Summary
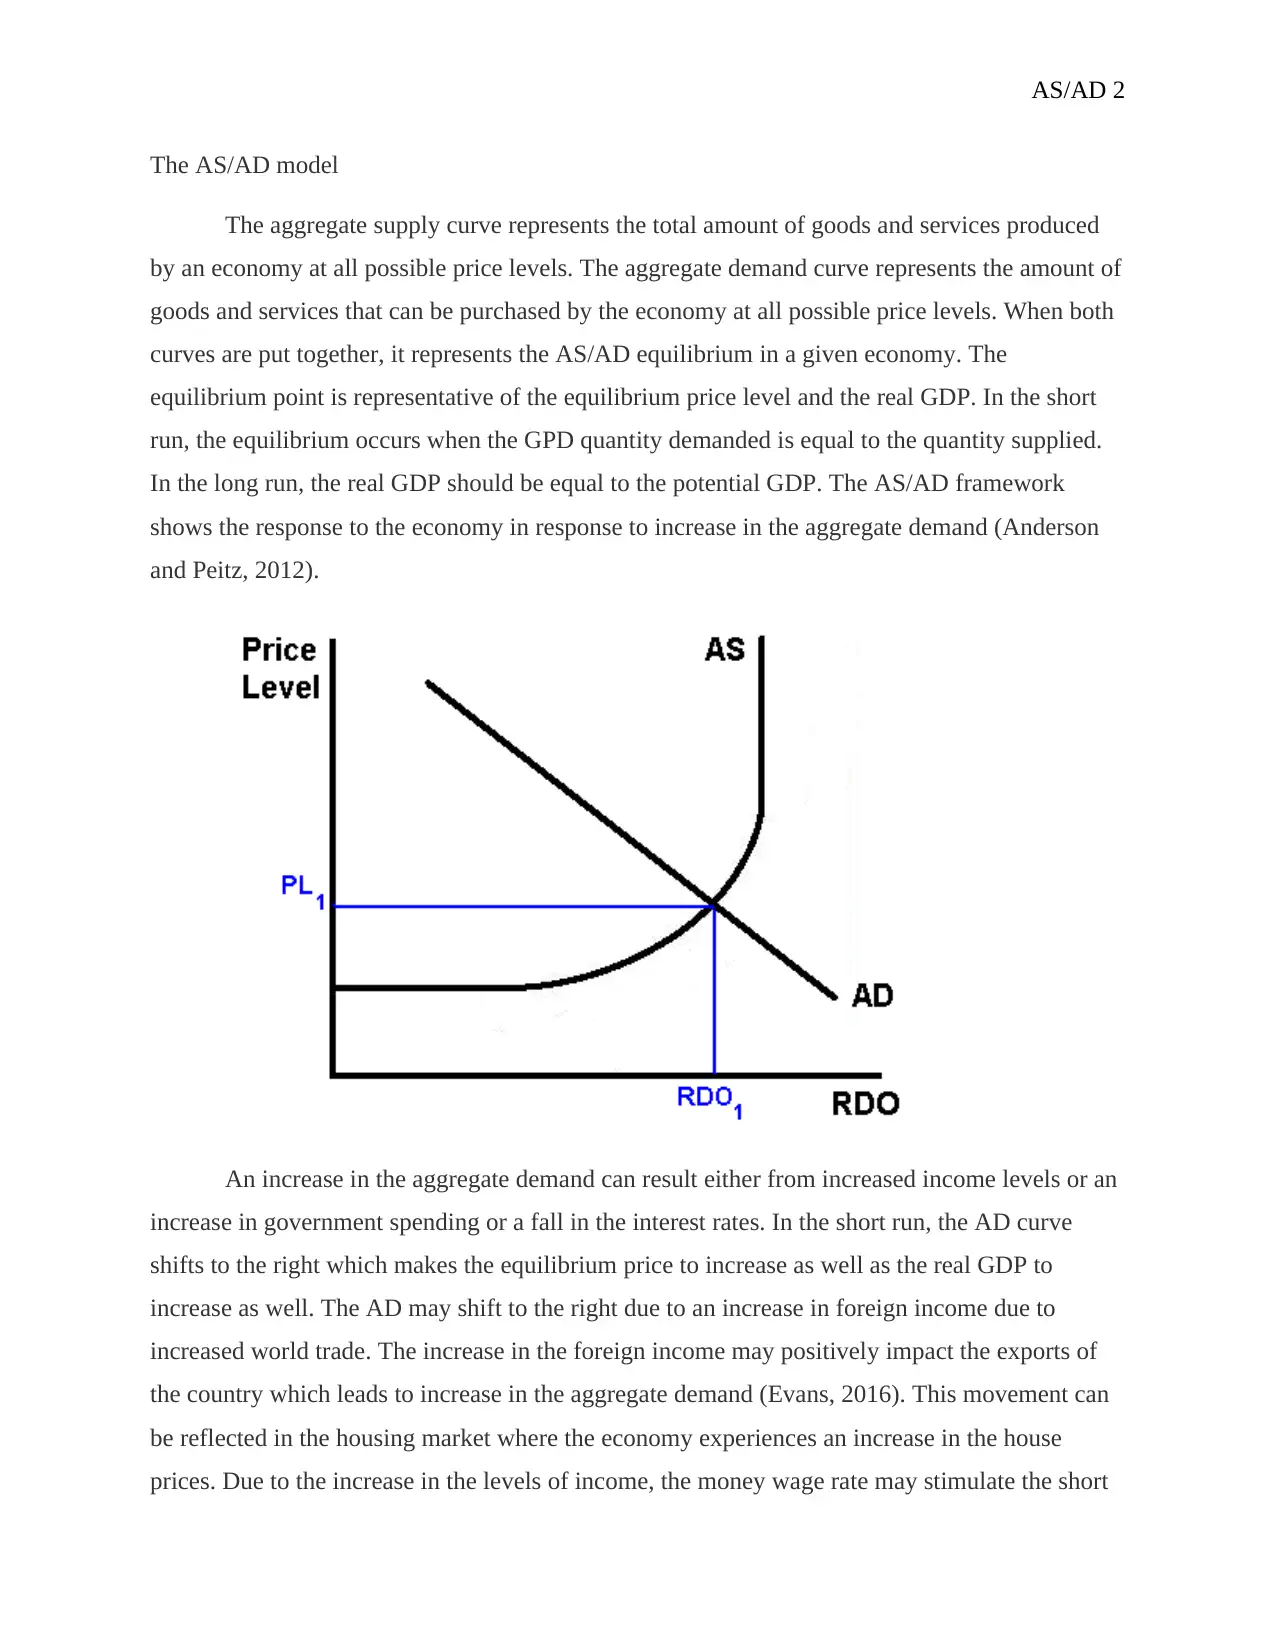
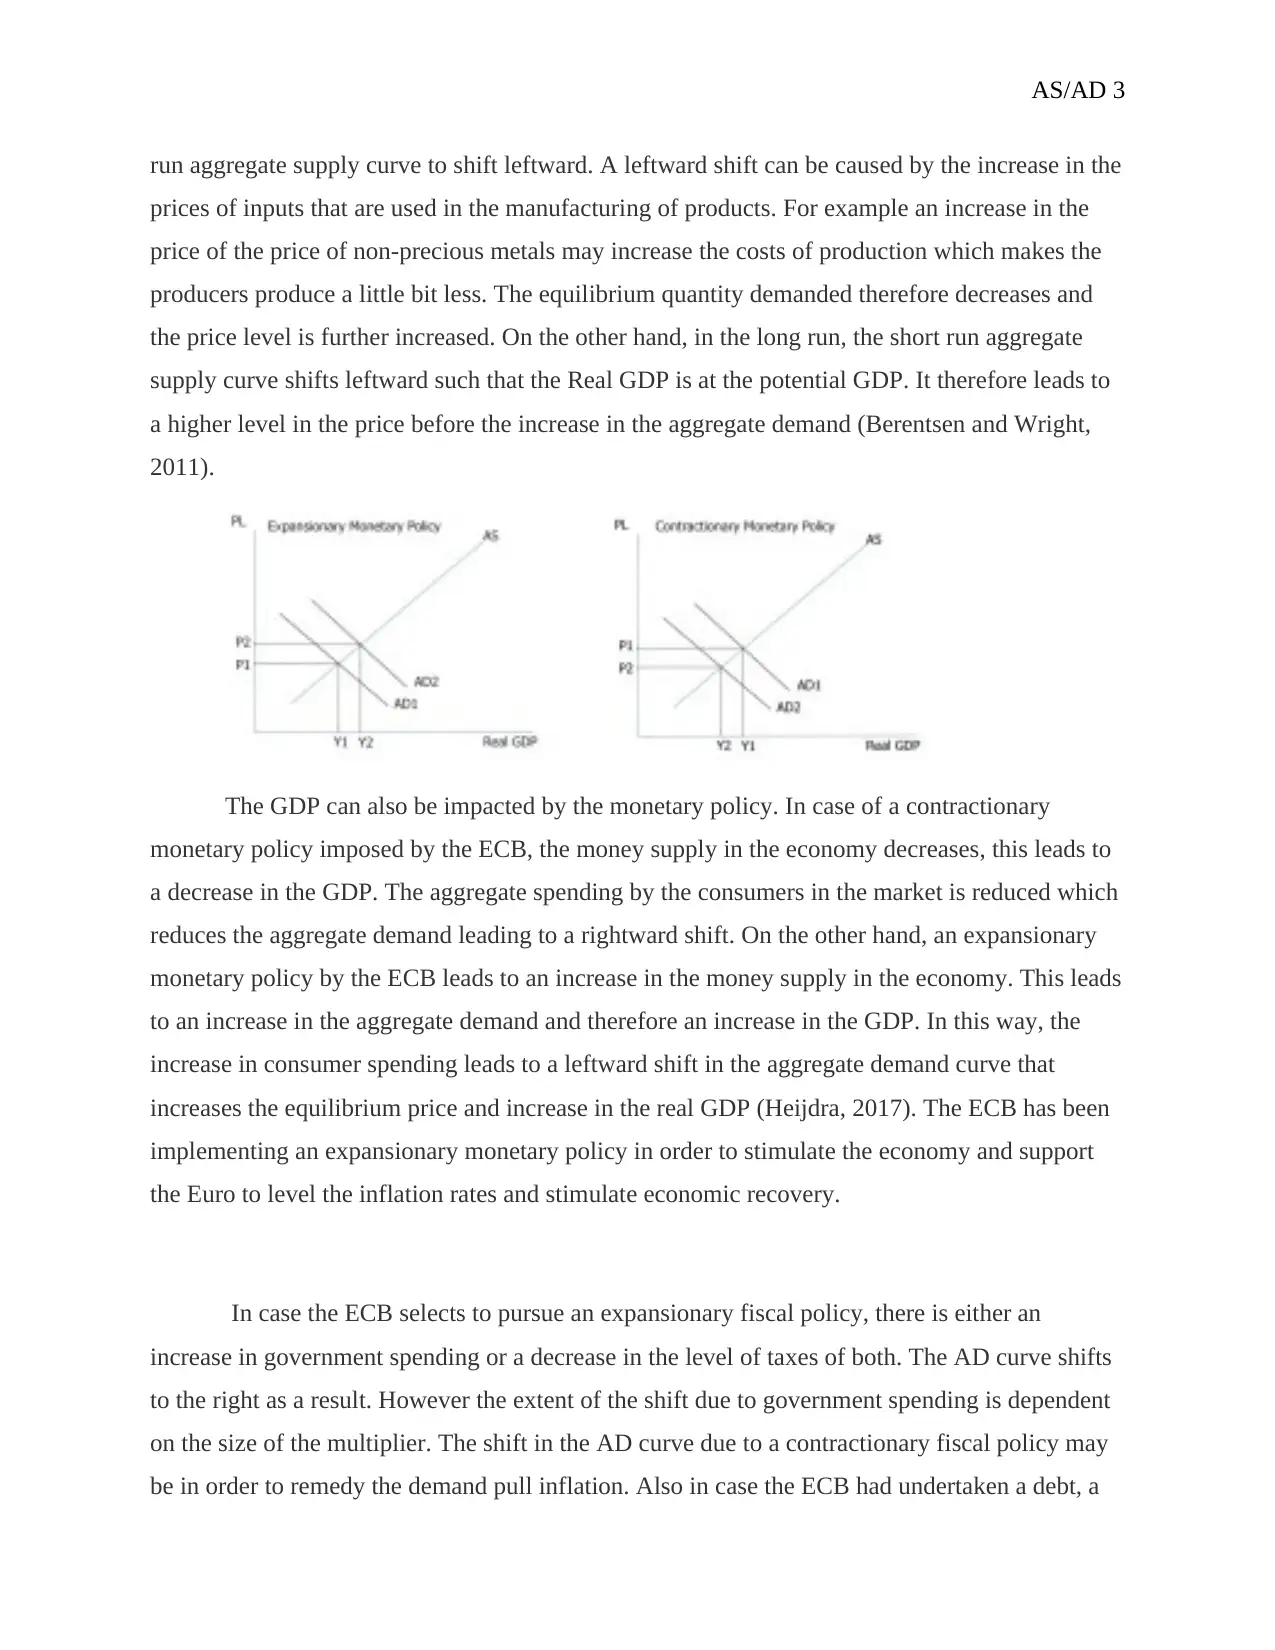
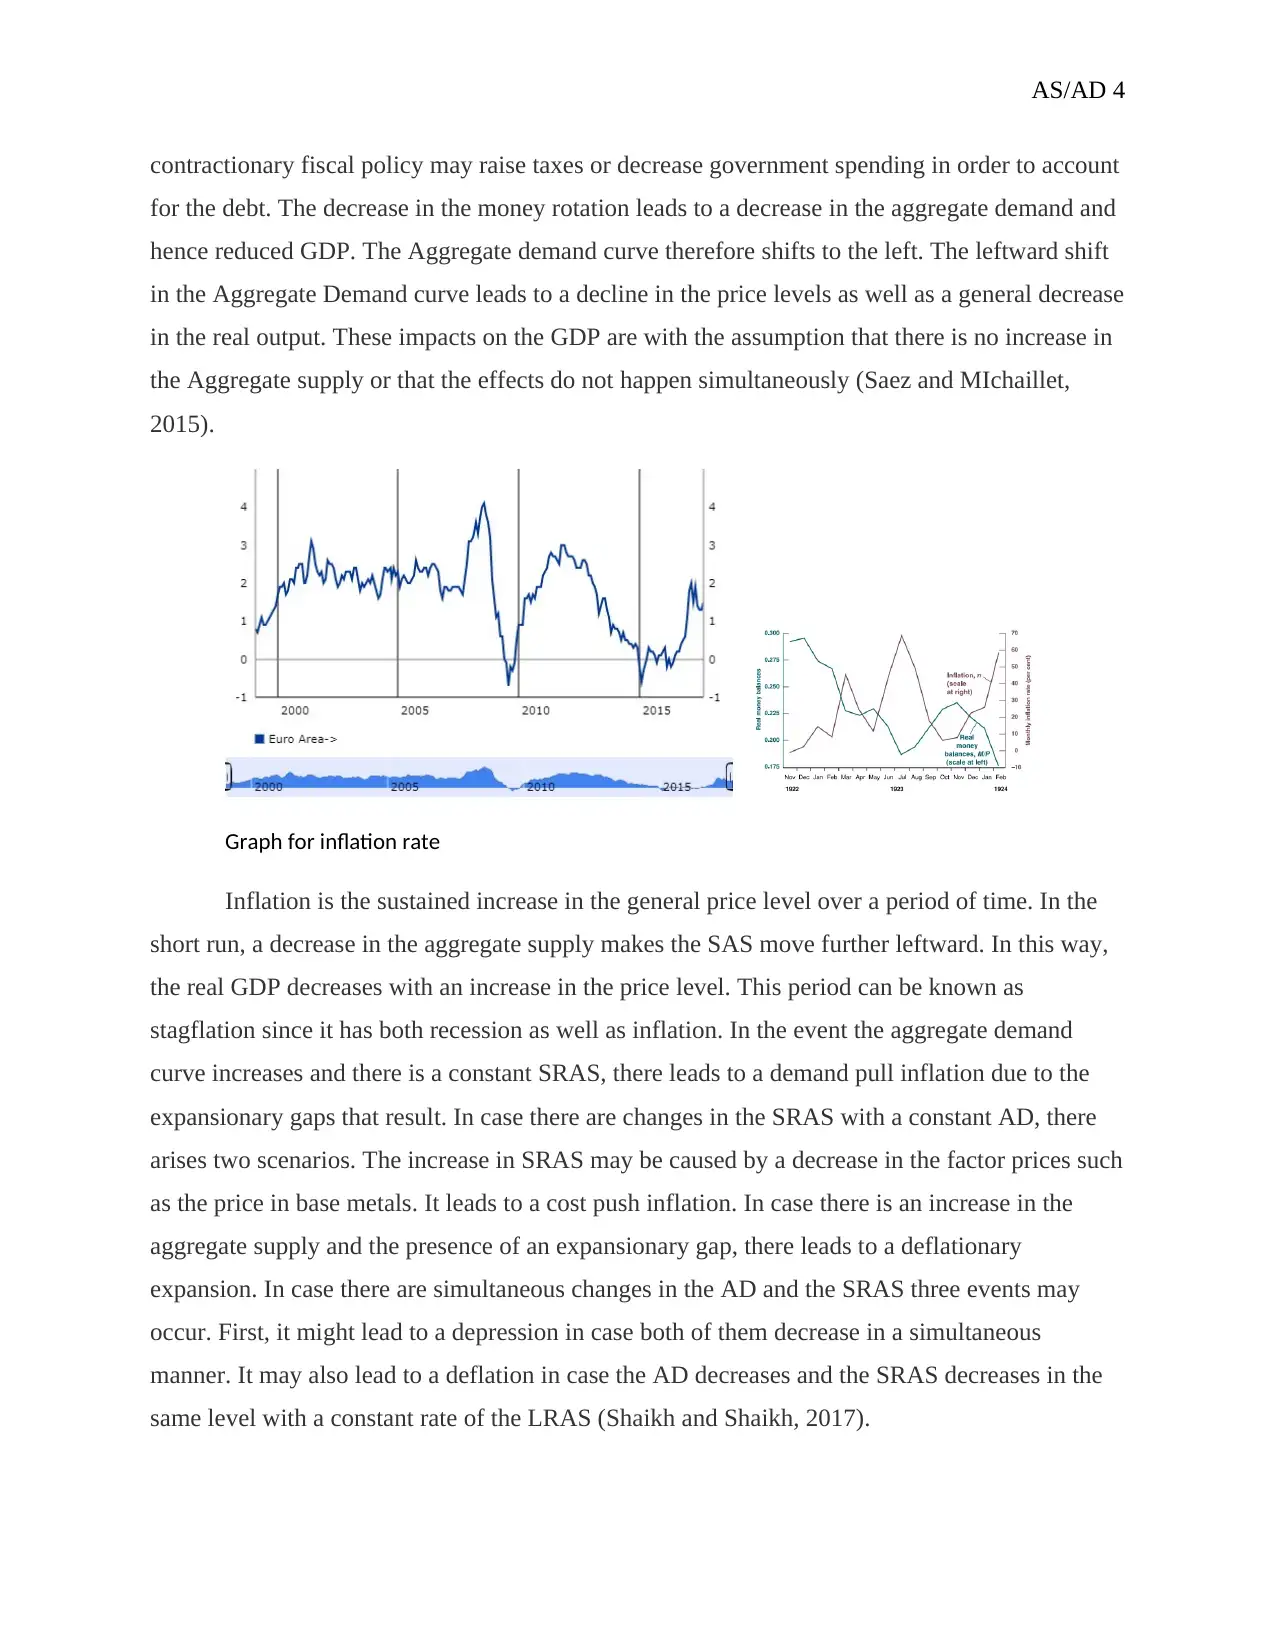
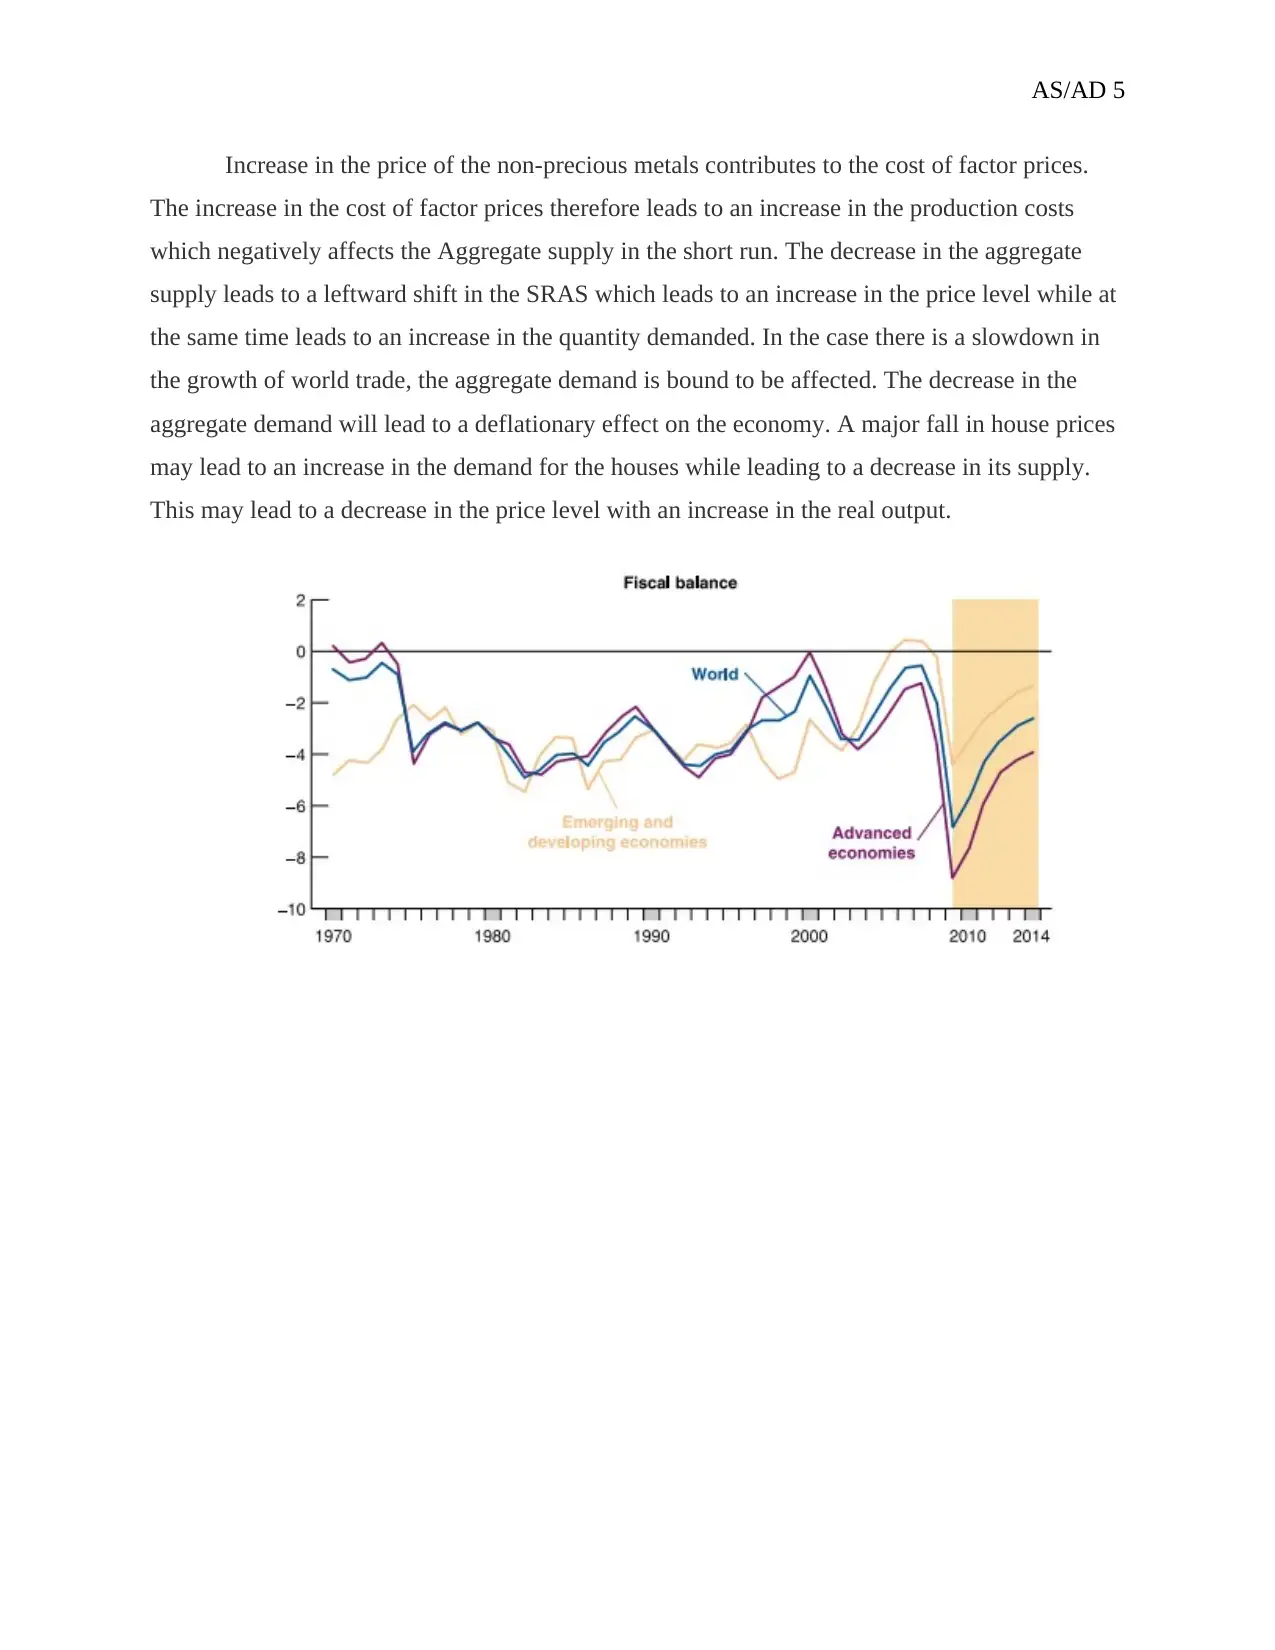
This report provides a comprehensive analysis of the Aggregate Supply/Aggregate Demand (AS/AD) model, a fundamental tool in macroeconomics. It explains the components of the AS/AD model, including the aggregate supply curve, which represents the total goods and services produced by an economy, and the aggregate demand curve, representing the total demand. The report explores the short-run and long-run equilibrium, discussing how shifts in aggregate demand, caused by factors like changes in income, government spending, or interest rates, affect price levels and real GDP. It examines the impact of monetary and fiscal policies on the AS/AD framework, illustrating how the ECB's expansionary or contractionary policies influence economic outcomes, including inflation and GDP. Furthermore, the report addresses the causes and effects of inflation, including stagflation, and considers the influence of external factors such as global trade and housing market fluctuations on the AS/AD equilibrium. The analysis includes a discussion of the impact of changes in factor prices, such as non-precious metals, and their effect on production costs and aggregate supply. The report concludes with a discussion of how simultaneous changes in aggregate demand and aggregate supply can lead to various economic scenarios such as depressions or deflation.
Document Page
AS/AD 1
The AS/AD model
Course
Name
Institution Affiliation
tabler-icon-diamond-filled.svg

Paraphrase This Document

Need a fresh take? Get an instant paraphrase of this document with our AI Paraphraser
Document Page
AS/AD 2
The AS/AD model
The aggregate supply curve represents the total amount of goods and services produced
by an economy at all possible price levels. The aggregate demand curve represents the amount of
goods and services that can be purchased by the economy at all possible price levels. When both
curves are put together, it represents the AS/AD equilibrium in a given economy. The
equilibrium point is representative of the equilibrium price level and the real GDP. In the short
run, the equilibrium occurs when the GPD quantity demanded is equal to the quantity supplied.
In the long run, the real GDP should be equal to the potential GDP. The AS/AD framework
shows the response to the economy in response to increase in the aggregate demand (Anderson
and Peitz, 2012).
An increase in the aggregate demand can result either from increased income levels or an
increase in government spending or a fall in the interest rates. In the short run, the AD curve
shifts to the right which makes the equilibrium price to increase as well as the real GDP to
increase as well. The AD may shift to the right due to an increase in foreign income due to
increased world trade. The increase in the foreign income may positively impact the exports of
the country which leads to increase in the aggregate demand (Evans, 2016). This movement can
be reflected in the housing market where the economy experiences an increase in the house
prices. Due to the increase in the levels of income, the money wage rate may stimulate the short
Document Page
AS/AD 3
run aggregate supply curve to shift leftward. A leftward shift can be caused by the increase in the
prices of inputs that are used in the manufacturing of products. For example an increase in the
price of the price of non-precious metals may increase the costs of production which makes the
producers produce a little bit less. The equilibrium quantity demanded therefore decreases and
the price level is further increased. On the other hand, in the long run, the short run aggregate
supply curve shifts leftward such that the Real GDP is at the potential GDP. It therefore leads to
a higher level in the price before the increase in the aggregate demand (Berentsen and Wright,
2011).
The GDP can also be impacted by the monetary policy. In case of a contractionary
monetary policy imposed by the ECB, the money supply in the economy decreases, this leads to
a decrease in the GDP. The aggregate spending by the consumers in the market is reduced which
reduces the aggregate demand leading to a rightward shift. On the other hand, an expansionary
monetary policy by the ECB leads to an increase in the money supply in the economy. This leads
to an increase in the aggregate demand and therefore an increase in the GDP. In this way, the
increase in consumer spending leads to a leftward shift in the aggregate demand curve that
increases the equilibrium price and increase in the real GDP (Heijdra, 2017). The ECB has been
implementing an expansionary monetary policy in order to stimulate the economy and support
the Euro to level the inflation rates and stimulate economic recovery.
In case the ECB selects to pursue an expansionary fiscal policy, there is either an
increase in government spending or a decrease in the level of taxes of both. The AD curve shifts
to the right as a result. However the extent of the shift due to government spending is dependent
on the size of the multiplier. The shift in the AD curve due to a contractionary fiscal policy may
be in order to remedy the demand pull inflation. Also in case the ECB had undertaken a debt, a
Document Page
AS/AD 4
contractionary fiscal policy may raise taxes or decrease government spending in order to account
for the debt. The decrease in the money rotation leads to a decrease in the aggregate demand and
hence reduced GDP. The Aggregate demand curve therefore shifts to the left. The leftward shift
in the Aggregate Demand curve leads to a decline in the price levels as well as a general decrease
in the real output. These impacts on the GDP are with the assumption that there is no increase in
the Aggregate supply or that the effects do not happen simultaneously (Saez and MIchaillet,
2015).
Graph for inflation rate
Inflation is the sustained increase in the general price level over a period of time. In the
short run, a decrease in the aggregate supply makes the SAS move further leftward. In this way,
the real GDP decreases with an increase in the price level. This period can be known as
stagflation since it has both recession as well as inflation. In the event the aggregate demand
curve increases and there is a constant SRAS, there leads to a demand pull inflation due to the
expansionary gaps that result. In case there are changes in the SRAS with a constant AD, there
arises two scenarios. The increase in SRAS may be caused by a decrease in the factor prices such
as the price in base metals. It leads to a cost push inflation. In case there is an increase in the
aggregate supply and the presence of an expansionary gap, there leads to a deflationary
expansion. In case there are simultaneous changes in the AD and the SRAS three events may
occur. First, it might lead to a depression in case both of them decrease in a simultaneous
manner. It may also lead to a deflation in case the AD decreases and the SRAS decreases in the
same level with a constant rate of the LRAS (Shaikh and Shaikh, 2017).
tabler-icon-diamond-filled.svg

Paraphrase This Document

Need a fresh take? Get an instant paraphrase of this document with our AI Paraphraser
Document Page
AS/AD 5
Increase in the price of the non-precious metals contributes to the cost of factor prices.
The increase in the cost of factor prices therefore leads to an increase in the production costs
which negatively affects the Aggregate supply in the short run. The decrease in the aggregate
supply leads to a leftward shift in the SRAS which leads to an increase in the price level while at
the same time leads to an increase in the quantity demanded. In the case there is a slowdown in
the growth of world trade, the aggregate demand is bound to be affected. The decrease in the
aggregate demand will lead to a deflationary effect on the economy. A major fall in house prices
may lead to an increase in the demand for the houses while leading to a decrease in its supply.
This may lead to a decrease in the price level with an increase in the real output.
Document Page
AS/AD 6
References
Anderson, S.P., Foros, Ø., Kind, H.J. and Peitz, M., 2012. Media market concentration,
advertising levels, and ad prices. International Journal of Industrial
Organization, 30(3), pp.321-325.
Berentsen, A., Menzio, G. and Wright, R., 2011. Inflation and unemployment in the long
run. The American economic review, 101(1), pp.371-398.
Evans, A. J. (2016). A Dynamic AD-AS Analysis of the UK Economy, 2002-
2010. Journal of Private Enterprise, 31(4), 97.
Heijdra, B.J., 2017. Foundations of Modern Macroeconomics: Exercise and Solutions
Manual. Oxford university press.
Saez, E. and Michaillet, P., 2015. An Economical Business-Cycle Model. Working Paper.
Shaikh, M., Shah, A.B. and Shaikh, F.M., 2017. Effect of Aggregate Demand and Supply
Shocks on Output and Inflation Rate in Pakistan.
chevron_up_icon
1 out of 6
circle_padding
hide_on_mobile
zoom_out_icon
[object Object]