Renewable Energy: Smart Solar Power Plant Design in Asia Report
VerifiedAdded on 2022/10/19
|23
|6865
|261
Report
AI Summary
This report provides an overview of renewable energy, focusing on solar power systems in Asia. It examines the growth of solar energy generation, particularly in China and India, and discusses the design of a smart solar power plant using AutoCAD Electrical 2019. The report includes details on system components like solar panels, inverters, transformers, and transmission lines, along with calculations for equivalent per-unit parameters. It also presents data on electricity generation from various sources, including coal, hydropower, nuclear, and solar, highlighting the increasing role of solar energy. The report estimates the cost of installation for a smart solar power plant and calculates the required tariff for a five-year return on investment, referencing the Cadiz Solar Power Plant as an example. Desklib offers more resources for students, including past papers and solved assignments.
Renewable energy design in Asia 1
Renewable energy in Asia and the World
Student Name
Student Number
Class
Date
Renewable energy in Asia and the World
Student Name
Student Number
Class
Date
Paraphrase This Document
Need a fresh take? Get an instant paraphrase of this document with our AI Paraphraser
Renewable energy design in Asia 2
Table of Contents
Introduction to renewable energy...............................................................................................................2
Renewable Energy Information in the world and Asia................................................................................2
PV solar energy generated in the world..................................................................................................3
Design of Smart Solar system......................................................................................................................5
Smart solar power plant designed in AutoCad Electrical 2019................................................................6
Generator................................................................................................................................................6
Transformer.............................................................................................................................................7
Transmission Line parameter..................................................................................................................7
Calculating equivalent per unit parameters of the solar system.............................................................7
Single line diagram of the proposed power plant........................................................................................8
Electricity Generation using the proposed renewable energy source.........................................................8
Estimated cost of installation for the smart solar power plant................................................................9
Cadiz Solar Power Plant energy project.....................................................................................................10
Conclusion.................................................................................................................................................11
Renewable energy design in Asia 3
Introduction to renewable energy.
Renewable energies are form of energies that are natural inexhaustible however in limited supply over a
period of time. There are different types of renewable energy that are already in exploitation, credit to
advancement of technology over the recent years. Among available renewable energies includes wood,
solar energy, biogas, wind, hydropower and geothermal power. It is without no contradiction that
renewable energy is playing major roles in energy sector transforming lives of humankind. For instance,
wood was used for heating and providing light until the mid-1800s in the United States. For the ages,
hydropower and biomass, until 1990s, were their main source of energy. Revolution in technology has
made it possible for exploration of wind and solar power that is a share in the energy sector of US
(Eia.gov, 2019). Main advantages of renewable energy over non-renewable energy is their ability to
sustain power supply over a long period of time without getting exhausted. This type of energy is free in
nature, therefore, the operational cost is at a lower rate compared to generating utilities that uses fossil
fuel such as diesel generator. In addition, renewable sources of energy are most recognized source of
clean energy as they produce no hazardous carbon oxide gases into the atmosphere (Ayres, 2019). It
largely relies on technology that can be modified depending on the capacity power demand. Continuous
emission of carbon dioxide into the atmosphere relatively pollutes the environment.
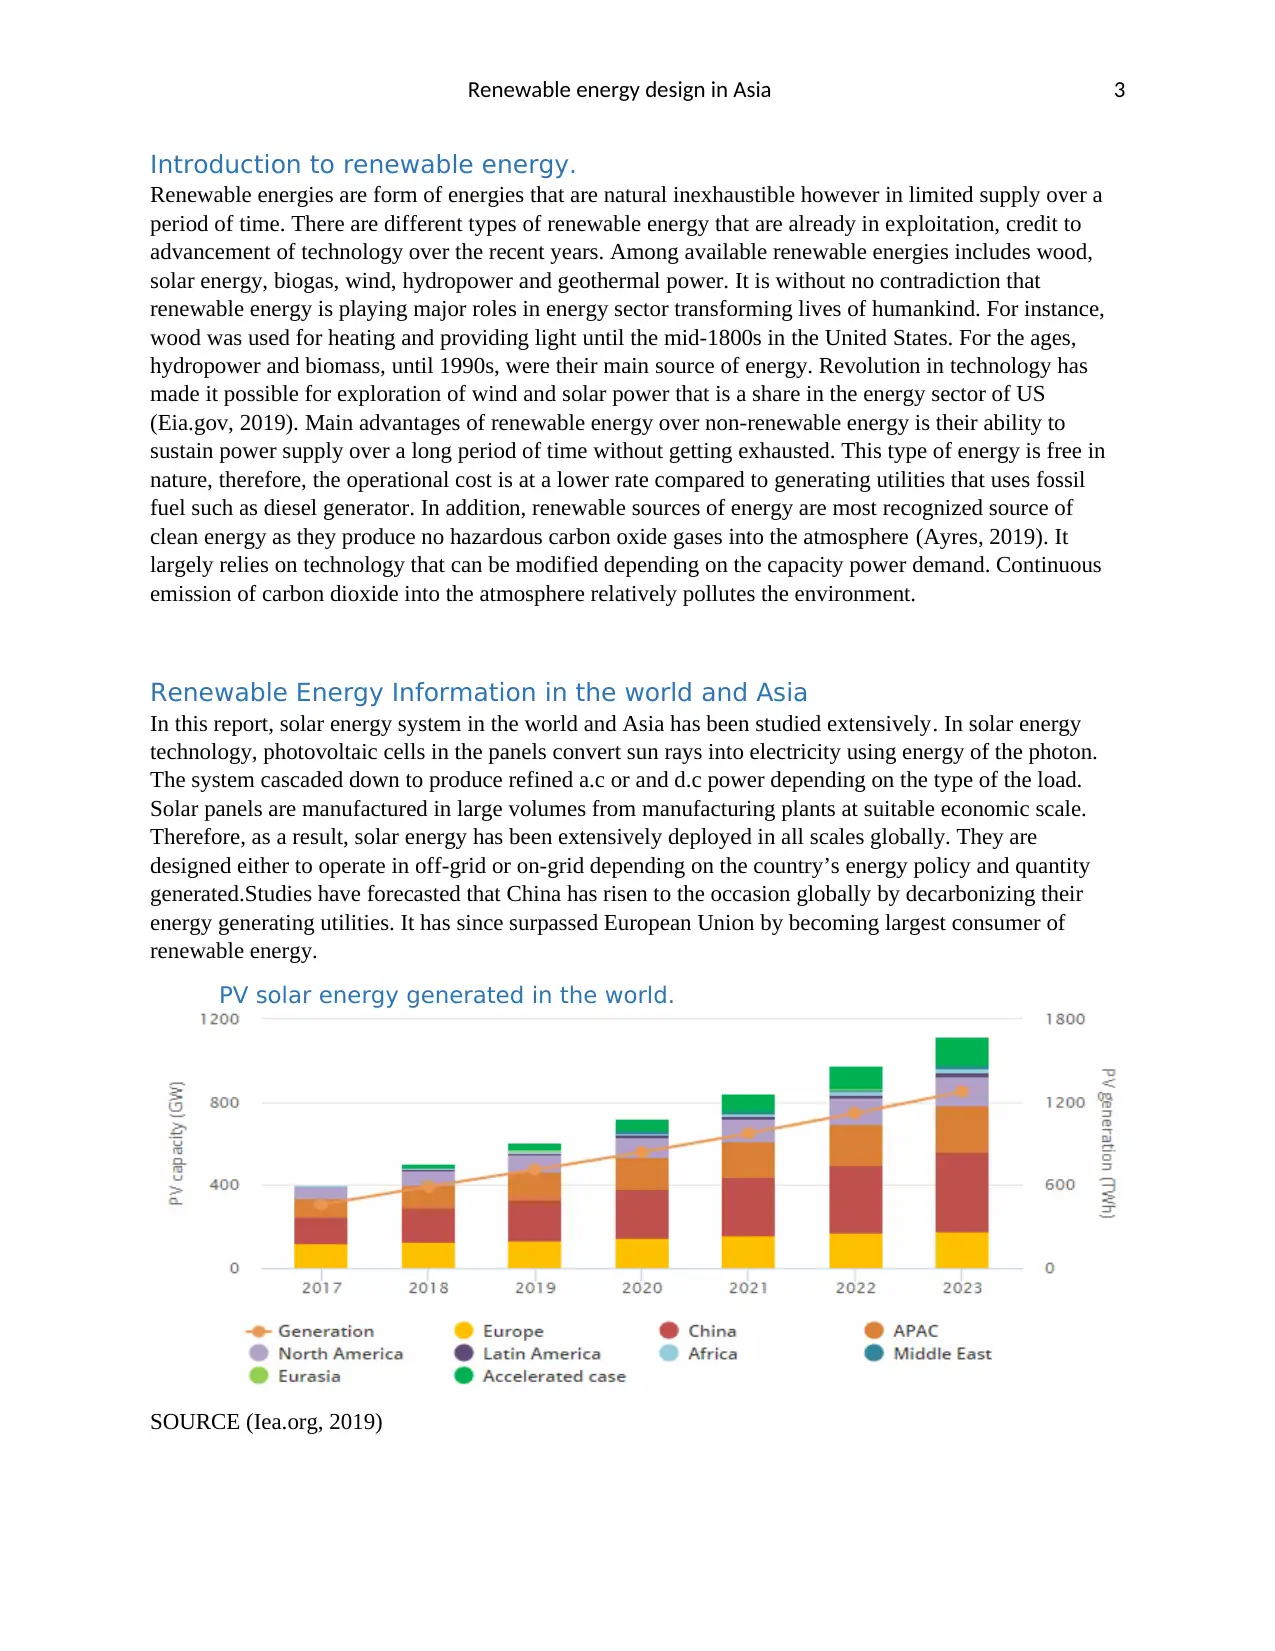
Renewable Energy Information in the world and Asia
In this report, solar energy system in the world and Asia has been studied extensively. In solar energy
technology, photovoltaic cells in the panels convert sun rays into electricity using energy of the photon.
The system cascaded down to produce refined a.c or and d.c power depending on the type of the load.
Solar panels are manufactured in large volumes from manufacturing plants at suitable economic scale.
Therefore, as a result, solar energy has been extensively deployed in all scales globally. They are
designed either to operate in off-grid or on-grid depending on the country’s energy policy and quantity
generated.Studies have forecasted that China has risen to the occasion globally by decarbonizing their
energy generating utilities. It has since surpassed European Union by becoming largest consumer of
renewable energy.
PV solar energy generated in the world.
SOURCE (Iea.org, 2019)
Introduction to renewable energy.
Renewable energies are form of energies that are natural inexhaustible however in limited supply over a
period of time. There are different types of renewable energy that are already in exploitation, credit to
advancement of technology over the recent years. Among available renewable energies includes wood,
solar energy, biogas, wind, hydropower and geothermal power. It is without no contradiction that
renewable energy is playing major roles in energy sector transforming lives of humankind. For instance,
wood was used for heating and providing light until the mid-1800s in the United States. For the ages,
hydropower and biomass, until 1990s, were their main source of energy. Revolution in technology has
made it possible for exploration of wind and solar power that is a share in the energy sector of US
(Eia.gov, 2019). Main advantages of renewable energy over non-renewable energy is their ability to
sustain power supply over a long period of time without getting exhausted. This type of energy is free in
nature, therefore, the operational cost is at a lower rate compared to generating utilities that uses fossil
fuel such as diesel generator. In addition, renewable sources of energy are most recognized source of
clean energy as they produce no hazardous carbon oxide gases into the atmosphere (Ayres, 2019). It
largely relies on technology that can be modified depending on the capacity power demand. Continuous
emission of carbon dioxide into the atmosphere relatively pollutes the environment.
Renewable Energy Information in the world and Asia
In this report, solar energy system in the world and Asia has been studied extensively. In solar energy
technology, photovoltaic cells in the panels convert sun rays into electricity using energy of the photon.
The system cascaded down to produce refined a.c or and d.c power depending on the type of the load.
Solar panels are manufactured in large volumes from manufacturing plants at suitable economic scale.
Therefore, as a result, solar energy has been extensively deployed in all scales globally. They are
designed either to operate in off-grid or on-grid depending on the country’s energy policy and quantity
generated.Studies have forecasted that China has risen to the occasion globally by decarbonizing their
energy generating utilities. It has since surpassed European Union by becoming largest consumer of
renewable energy.
PV solar energy generated in the world.
SOURCE (Iea.org, 2019)
⊘ This is a preview!⊘
Do you want full access?
Subscribe today to unlock all pages.
Trusted by 1+ million students worldwide
Renewable energy design in Asia 4
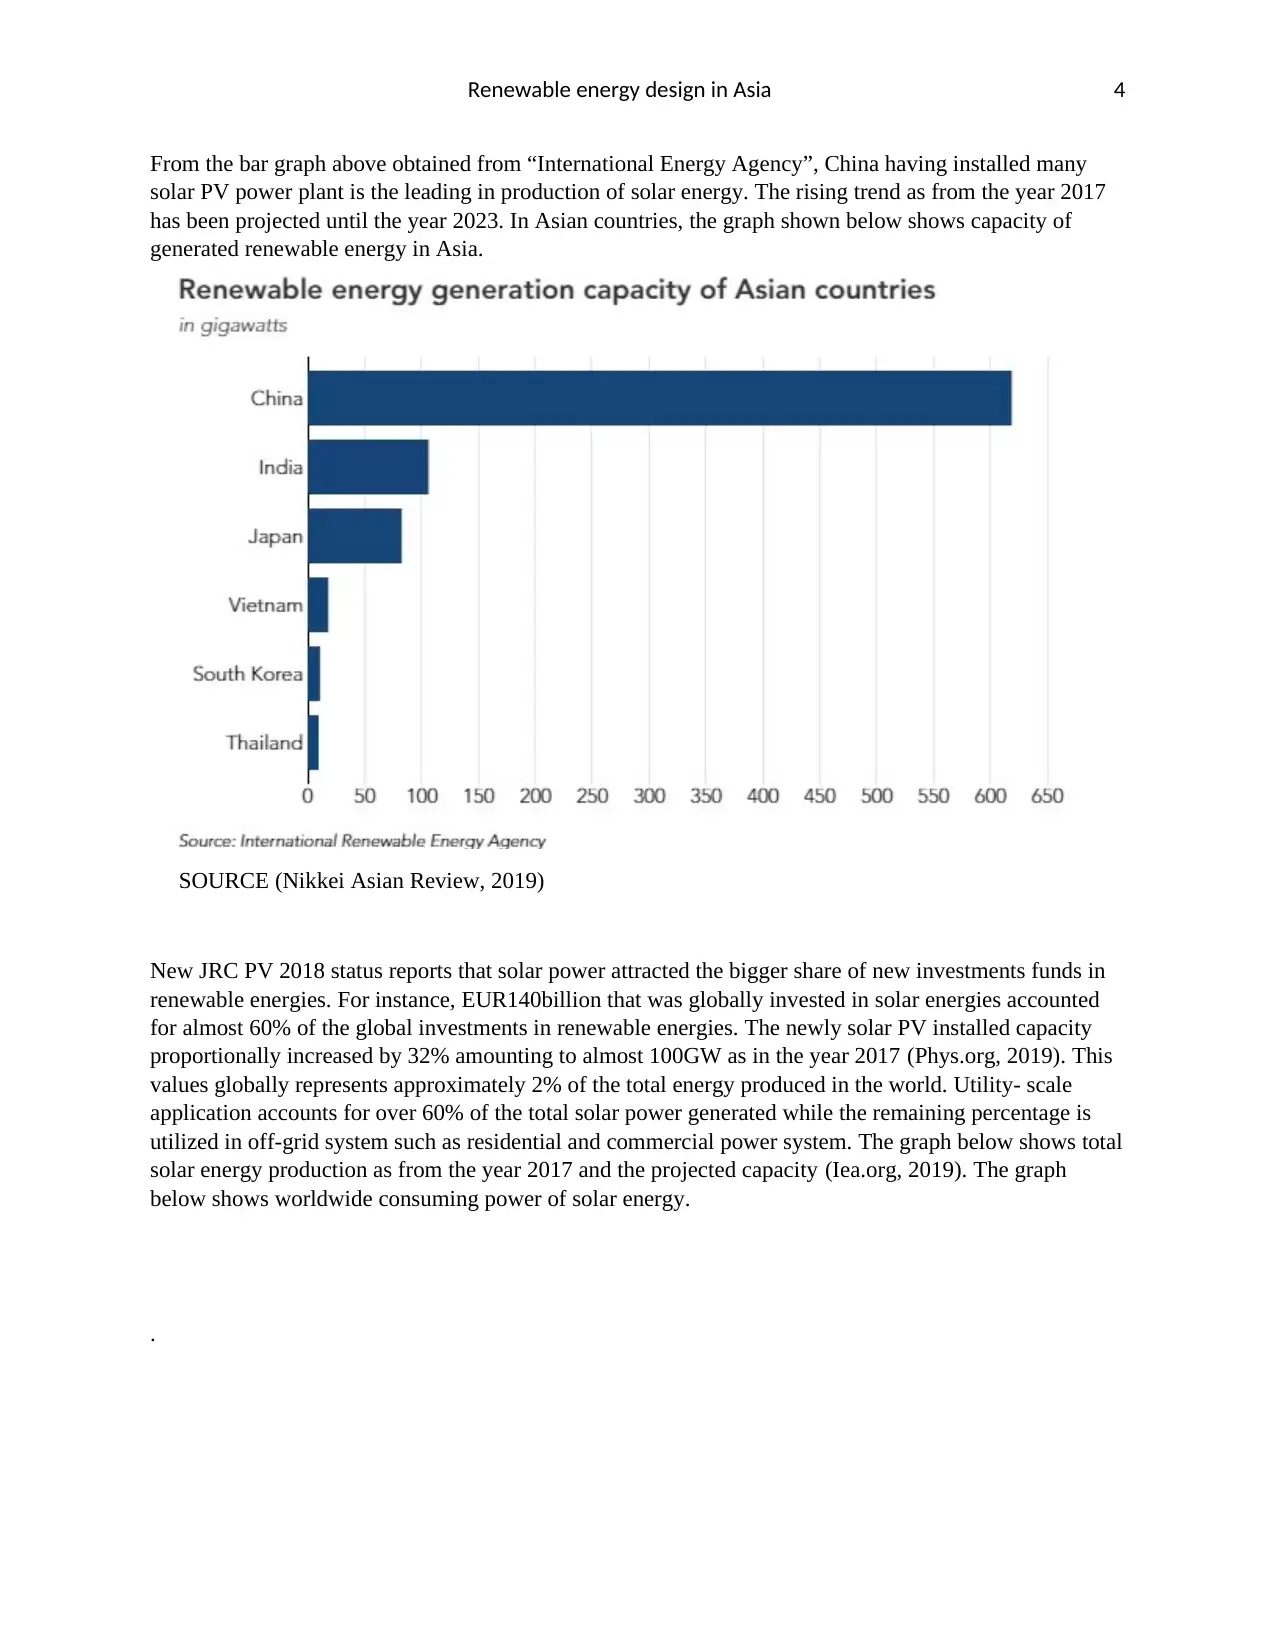
From the bar graph above obtained from “International Energy Agency”, China having installed many
solar PV power plant is the leading in production of solar energy. The rising trend as from the year 2017
has been projected until the year 2023. In Asian countries, the graph shown below shows capacity of
generated renewable energy in Asia.
SOURCE (Nikkei Asian Review, 2019)
New JRC PV 2018 status reports that solar power attracted the bigger share of new investments funds in
renewable energies. For instance, EUR140billion that was globally invested in solar energies accounted
for almost 60% of the global investments in renewable energies. The newly solar PV installed capacity
proportionally increased by 32% amounting to almost 100GW as in the year 2017 (Phys.org, 2019). This
values globally represents approximately 2% of the total energy produced in the world. Utility- scale
application accounts for over 60% of the total solar power generated while the remaining percentage is
utilized in off-grid system such as residential and commercial power system. The graph below shows total
solar energy production as from the year 2017 and the projected capacity (Iea.org, 2019). The graph
below shows worldwide consuming power of solar energy.
.
Paraphrase This Document
Need a fresh take? Get an instant paraphrase of this document with our AI Paraphraser
Renewable energy design in Asia 5
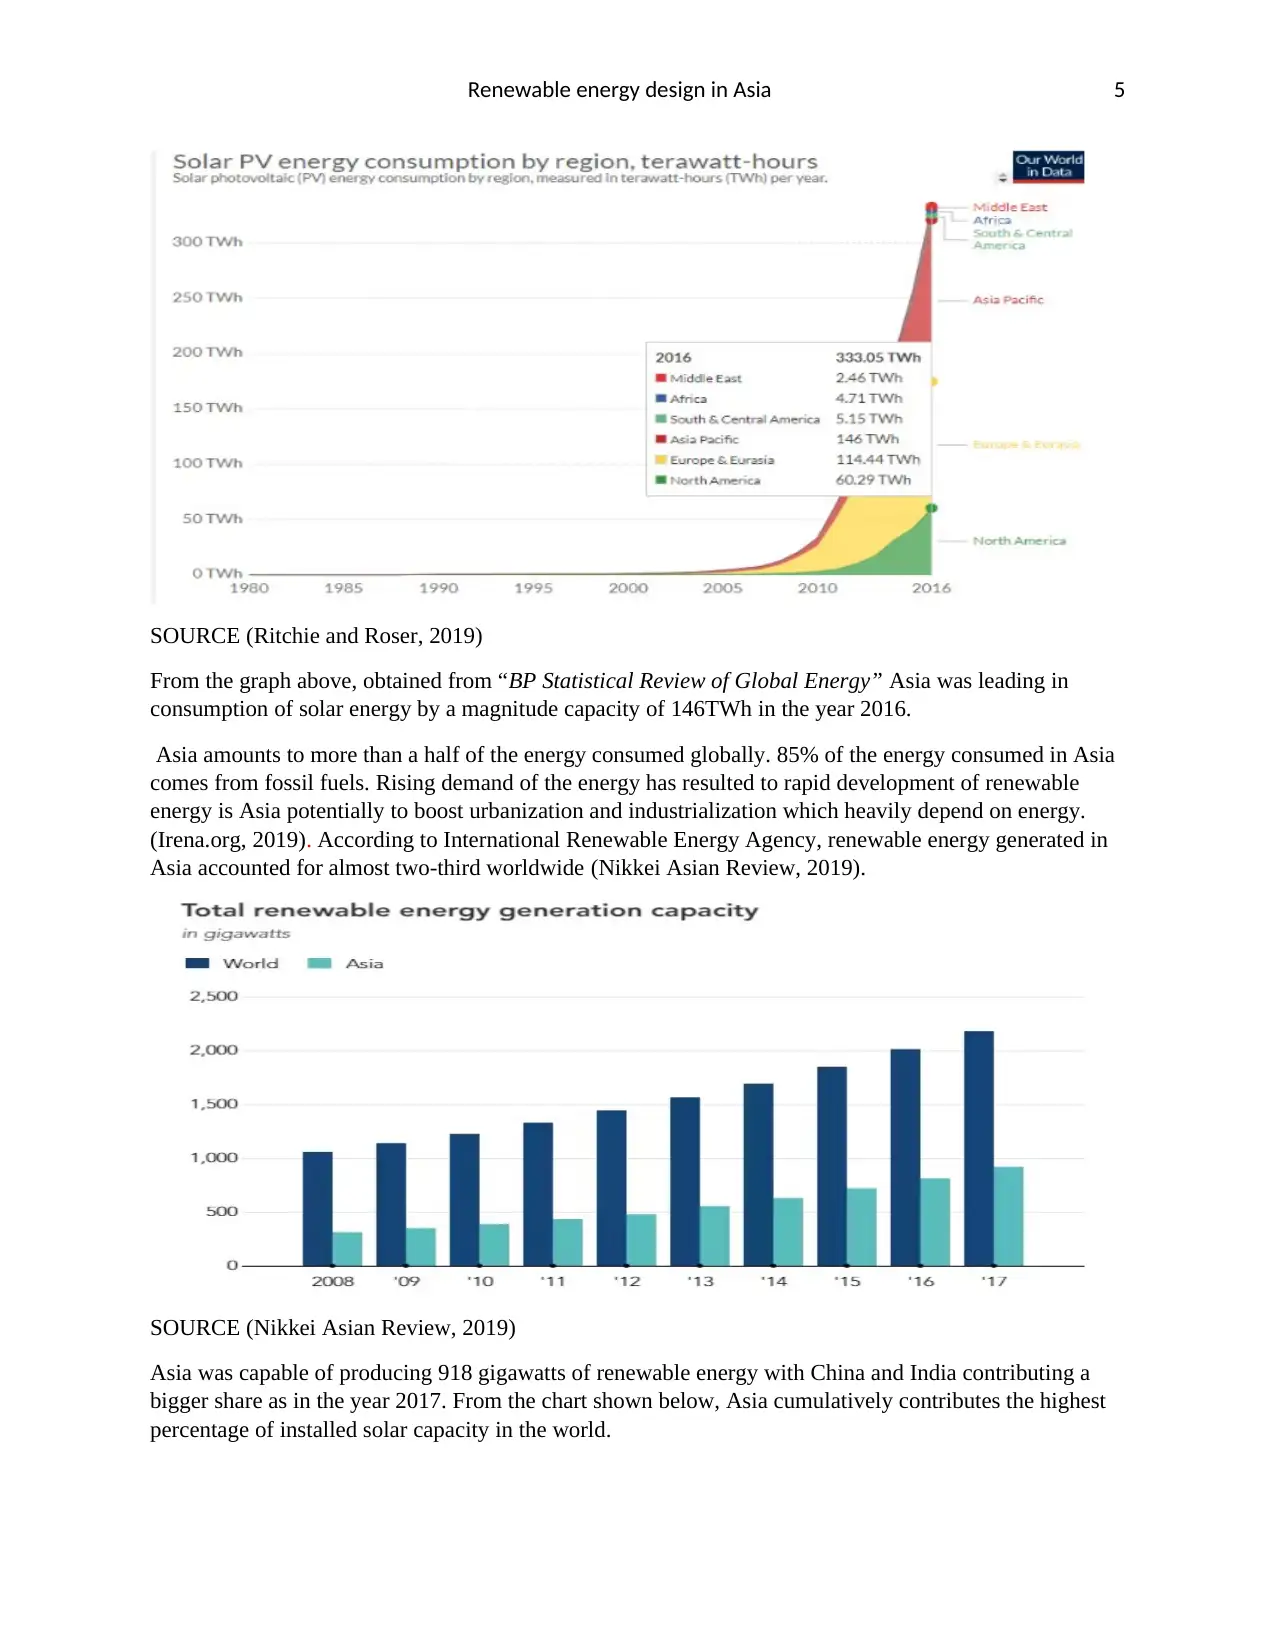
SOURCE (Ritchie and Roser, 2019)
From the graph above, obtained from “BP Statistical Review of Global Energy” Asia was leading in
consumption of solar energy by a magnitude capacity of 146TWh in the year 2016.
Asia amounts to more than a half of the energy consumed globally. 85% of the energy consumed in Asia
comes from fossil fuels. Rising demand of the energy has resulted to rapid development of renewable
energy is Asia potentially to boost urbanization and industrialization which heavily depend on energy.
(Irena.org, 2019). According to International Renewable Energy Agency, renewable energy generated in
Asia accounted for almost two-third worldwide (Nikkei Asian Review, 2019).
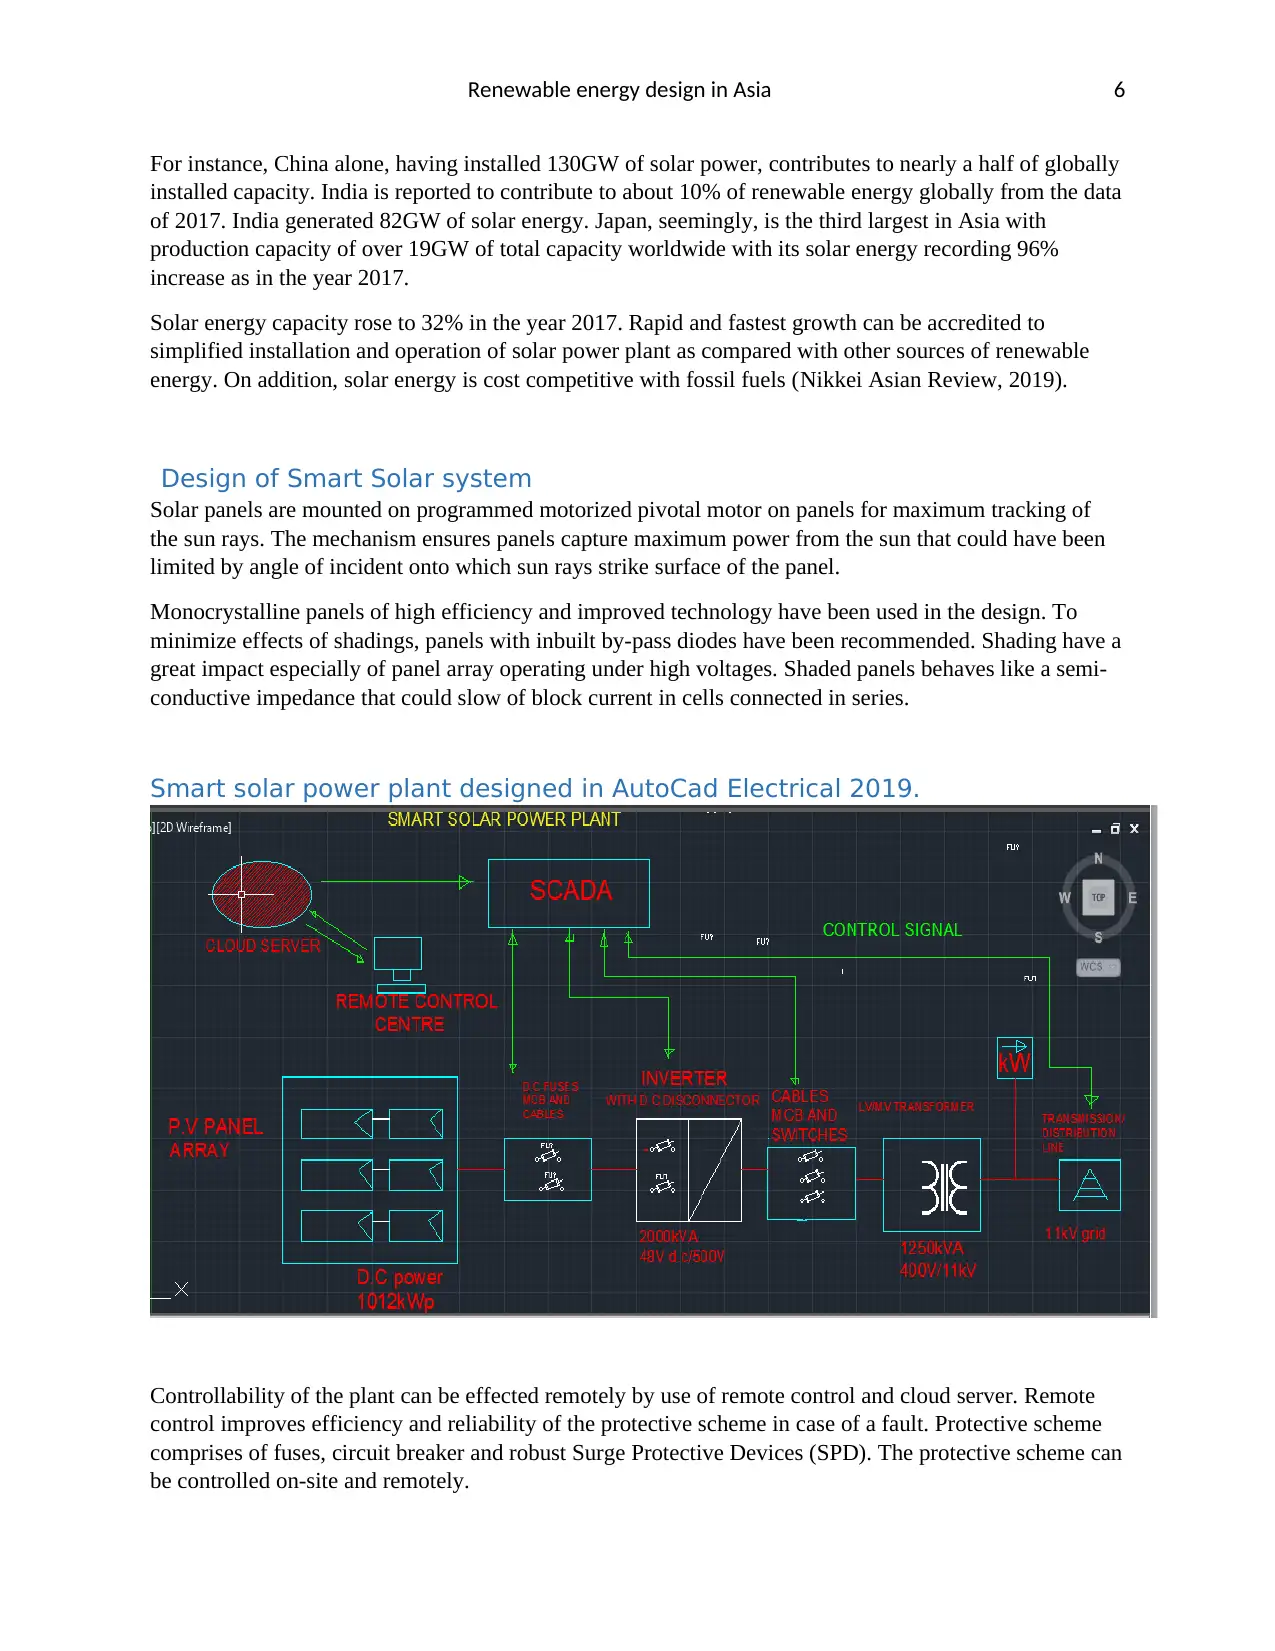
SOURCE (Nikkei Asian Review, 2019)
Asia was capable of producing 918 gigawatts of renewable energy with China and India contributing a
bigger share as in the year 2017. From the chart shown below, Asia cumulatively contributes the highest
percentage of installed solar capacity in the world.
SOURCE (Ritchie and Roser, 2019)
From the graph above, obtained from “BP Statistical Review of Global Energy” Asia was leading in
consumption of solar energy by a magnitude capacity of 146TWh in the year 2016.
Asia amounts to more than a half of the energy consumed globally. 85% of the energy consumed in Asia
comes from fossil fuels. Rising demand of the energy has resulted to rapid development of renewable
energy is Asia potentially to boost urbanization and industrialization which heavily depend on energy.
(Irena.org, 2019). According to International Renewable Energy Agency, renewable energy generated in
Asia accounted for almost two-third worldwide (Nikkei Asian Review, 2019).
SOURCE (Nikkei Asian Review, 2019)
Asia was capable of producing 918 gigawatts of renewable energy with China and India contributing a
bigger share as in the year 2017. From the chart shown below, Asia cumulatively contributes the highest
percentage of installed solar capacity in the world.
Renewable energy design in Asia 6
For instance, China alone, having installed 130GW of solar power, contributes to nearly a half of globally
installed capacity. India is reported to contribute to about 10% of renewable energy globally from the data
of 2017. India generated 82GW of solar energy. Japan, seemingly, is the third largest in Asia with
production capacity of over 19GW of total capacity worldwide with its solar energy recording 96%
increase as in the year 2017.
Solar energy capacity rose to 32% in the year 2017. Rapid and fastest growth can be accredited to
simplified installation and operation of solar power plant as compared with other sources of renewable
energy. On addition, solar energy is cost competitive with fossil fuels (Nikkei Asian Review, 2019).
Design of Smart Solar system
Solar panels are mounted on programmed motorized pivotal motor on panels for maximum tracking of
the sun rays. The mechanism ensures panels capture maximum power from the sun that could have been
limited by angle of incident onto which sun rays strike surface of the panel.
Monocrystalline panels of high efficiency and improved technology have been used in the design. To
minimize effects of shadings, panels with inbuilt by-pass diodes have been recommended. Shading have a
great impact especially of panel array operating under high voltages. Shaded panels behaves like a semi-
conductive impedance that could slow of block current in cells connected in series.
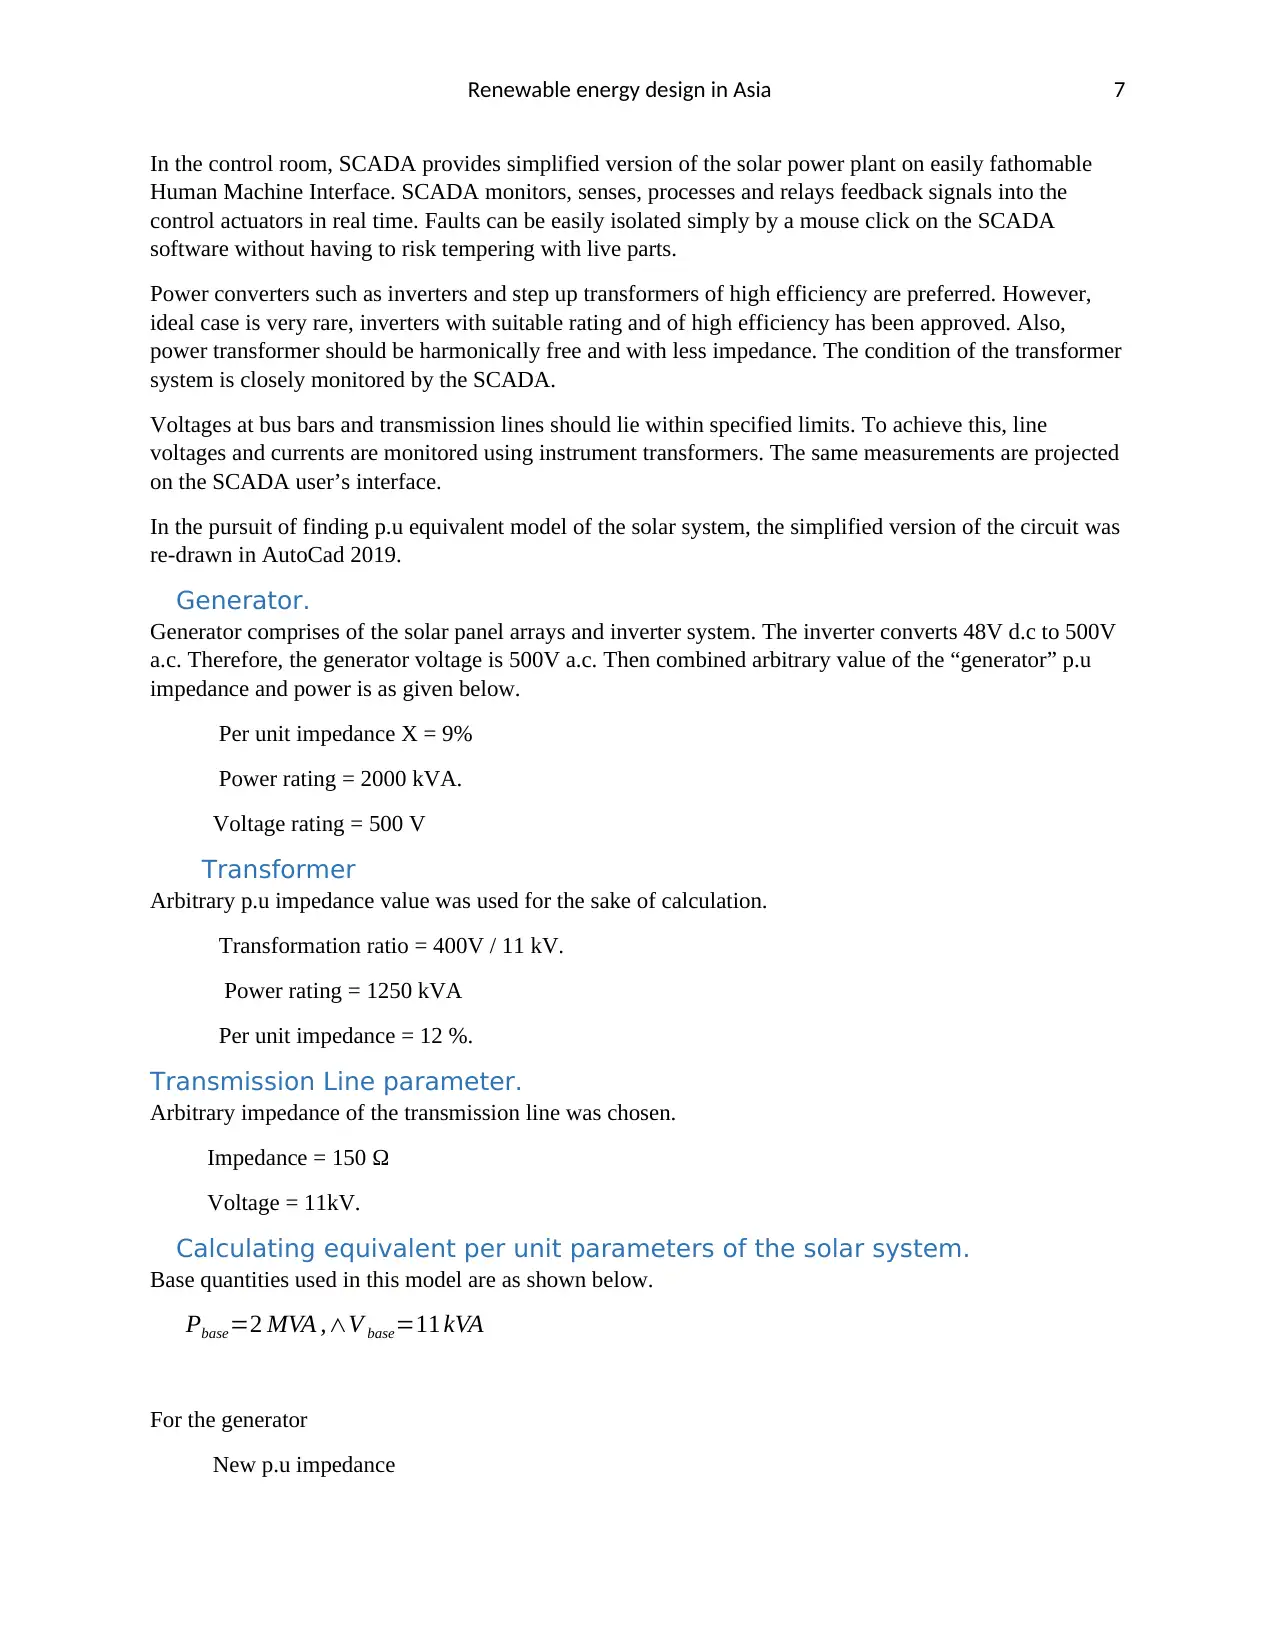
Smart solar power plant designed in AutoCad Electrical 2019.
Controllability of the plant can be effected remotely by use of remote control and cloud server. Remote
control improves efficiency and reliability of the protective scheme in case of a fault. Protective scheme
comprises of fuses, circuit breaker and robust Surge Protective Devices (SPD). The protective scheme can
be controlled on-site and remotely.
For instance, China alone, having installed 130GW of solar power, contributes to nearly a half of globally
installed capacity. India is reported to contribute to about 10% of renewable energy globally from the data
of 2017. India generated 82GW of solar energy. Japan, seemingly, is the third largest in Asia with
production capacity of over 19GW of total capacity worldwide with its solar energy recording 96%
increase as in the year 2017.
Solar energy capacity rose to 32% in the year 2017. Rapid and fastest growth can be accredited to
simplified installation and operation of solar power plant as compared with other sources of renewable
energy. On addition, solar energy is cost competitive with fossil fuels (Nikkei Asian Review, 2019).
Design of Smart Solar system
Solar panels are mounted on programmed motorized pivotal motor on panels for maximum tracking of
the sun rays. The mechanism ensures panels capture maximum power from the sun that could have been
limited by angle of incident onto which sun rays strike surface of the panel.
Monocrystalline panels of high efficiency and improved technology have been used in the design. To
minimize effects of shadings, panels with inbuilt by-pass diodes have been recommended. Shading have a
great impact especially of panel array operating under high voltages. Shaded panels behaves like a semi-
conductive impedance that could slow of block current in cells connected in series.
Smart solar power plant designed in AutoCad Electrical 2019.
Controllability of the plant can be effected remotely by use of remote control and cloud server. Remote
control improves efficiency and reliability of the protective scheme in case of a fault. Protective scheme
comprises of fuses, circuit breaker and robust Surge Protective Devices (SPD). The protective scheme can
be controlled on-site and remotely.
⊘ This is a preview!⊘
Do you want full access?
Subscribe today to unlock all pages.
Trusted by 1+ million students worldwide
Renewable energy design in Asia 7
In the control room, SCADA provides simplified version of the solar power plant on easily fathomable
Human Machine Interface. SCADA monitors, senses, processes and relays feedback signals into the
control actuators in real time. Faults can be easily isolated simply by a mouse click on the SCADA
software without having to risk tempering with live parts.
Power converters such as inverters and step up transformers of high efficiency are preferred. However,
ideal case is very rare, inverters with suitable rating and of high efficiency has been approved. Also,
power transformer should be harmonically free and with less impedance. The condition of the transformer
system is closely monitored by the SCADA.
Voltages at bus bars and transmission lines should lie within specified limits. To achieve this, line
voltages and currents are monitored using instrument transformers. The same measurements are projected
on the SCADA user’s interface.
In the pursuit of finding p.u equivalent model of the solar system, the simplified version of the circuit was
re-drawn in AutoCad 2019.
Generator.
Generator comprises of the solar panel arrays and inverter system. The inverter converts 48V d.c to 500V
a.c. Therefore, the generator voltage is 500V a.c. Then combined arbitrary value of the “generator” p.u
impedance and power is as given below.
Per unit impedance X = 9%
Power rating = 2000 kVA.
Voltage rating = 500 V
Transformer
Arbitrary p.u impedance value was used for the sake of calculation.
Transformation ratio = 400V / 11 kV.
Power rating = 1250 kVA
Per unit impedance = 12 %.
Transmission Line parameter.
Arbitrary impedance of the transmission line was chosen.
Impedance = 150 Ω
Voltage = 11kV.
Calculating equivalent per unit parameters of the solar system.
Base quantities used in this model are as shown below.
Pbase=2 MVA ,∧V base=11 kVA
For the generator
New p.u impedance
Paraphrase This Document
Need a fresh take? Get an instant paraphrase of this document with our AI Paraphraser
Renewable energy design in Asia 8
Zp . u(new)=Z p .u (old)× ( kV old
kV new )
2
( MVAnew
MVAold )
Zp . u(new)=0.09× ( 0.5 kV
11 kVA )
2
( 2 MVA
2 MVA ) = j 0.000186 p . u
New p.u power
Pgen ( p .u)=
( MVAold
MVAnew )=( 2 MVA
2 MVA )=1 p . u
For the transformer
New p.u impedance
Zp . u(new)=Z p .u (old)× ( kV old
kV new )2
( MVAnew
MVAold )
Zp . u(new)=0.12× ( 11 kVA
11 kVA )
2
( 2 MVA
1.25 MVA ) =0.192 p . u
For the transmission line
Zp . u=Zohms × ( MVAbase
kVAbase
2 )
Zp . u=150 Ω × ( 2 MVA
11 kVA2 ) =2.48 p . u
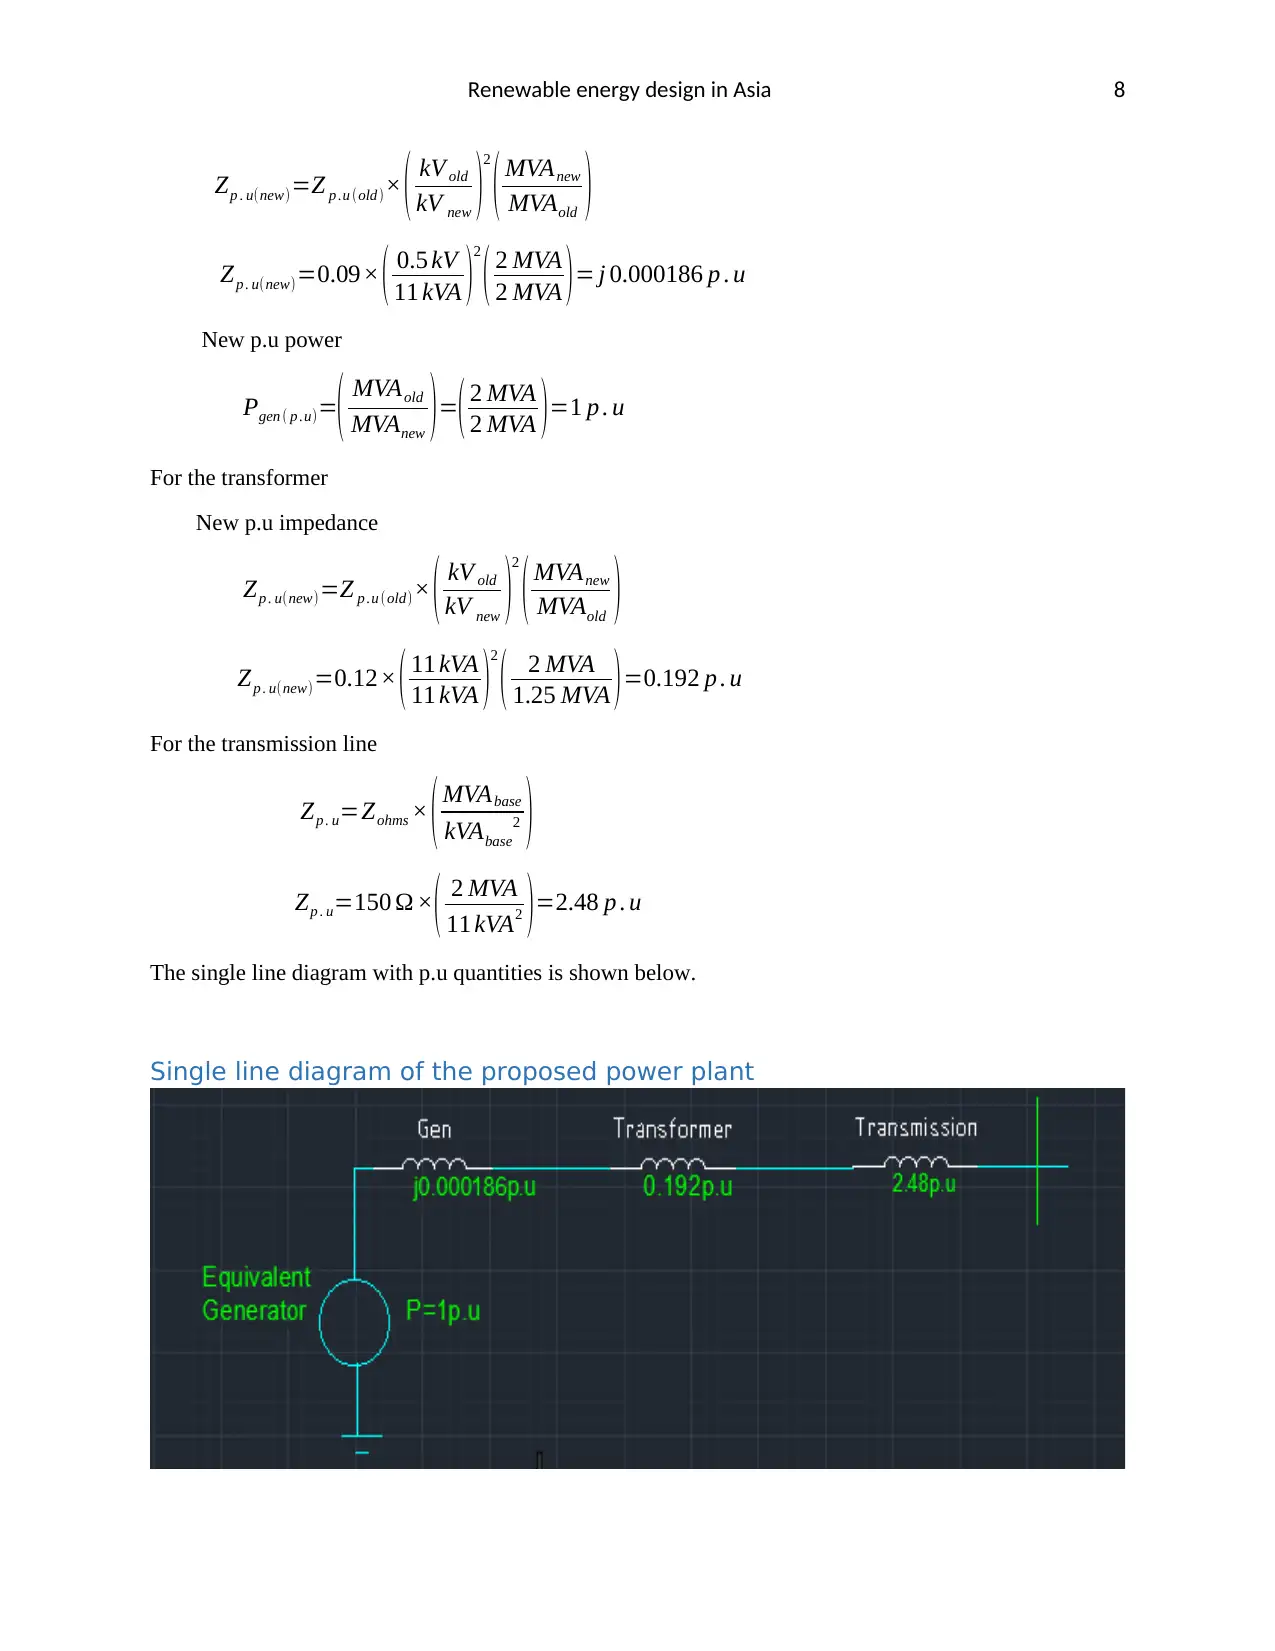
The single line diagram with p.u quantities is shown below.
Single line diagram of the proposed power plant
Zp . u(new)=Z p .u (old)× ( kV old
kV new )
2
( MVAnew
MVAold )
Zp . u(new)=0.09× ( 0.5 kV
11 kVA )
2
( 2 MVA
2 MVA ) = j 0.000186 p . u
New p.u power
Pgen ( p .u)=
( MVAold
MVAnew )=( 2 MVA
2 MVA )=1 p . u
For the transformer
New p.u impedance
Zp . u(new)=Z p .u (old)× ( kV old
kV new )2
( MVAnew
MVAold )
Zp . u(new)=0.12× ( 11 kVA
11 kVA )
2
( 2 MVA
1.25 MVA ) =0.192 p . u
For the transmission line
Zp . u=Zohms × ( MVAbase
kVAbase
2 )
Zp . u=150 Ω × ( 2 MVA
11 kVA2 ) =2.48 p . u
The single line diagram with p.u quantities is shown below.
Single line diagram of the proposed power plant
Renewable energy design in Asia 9
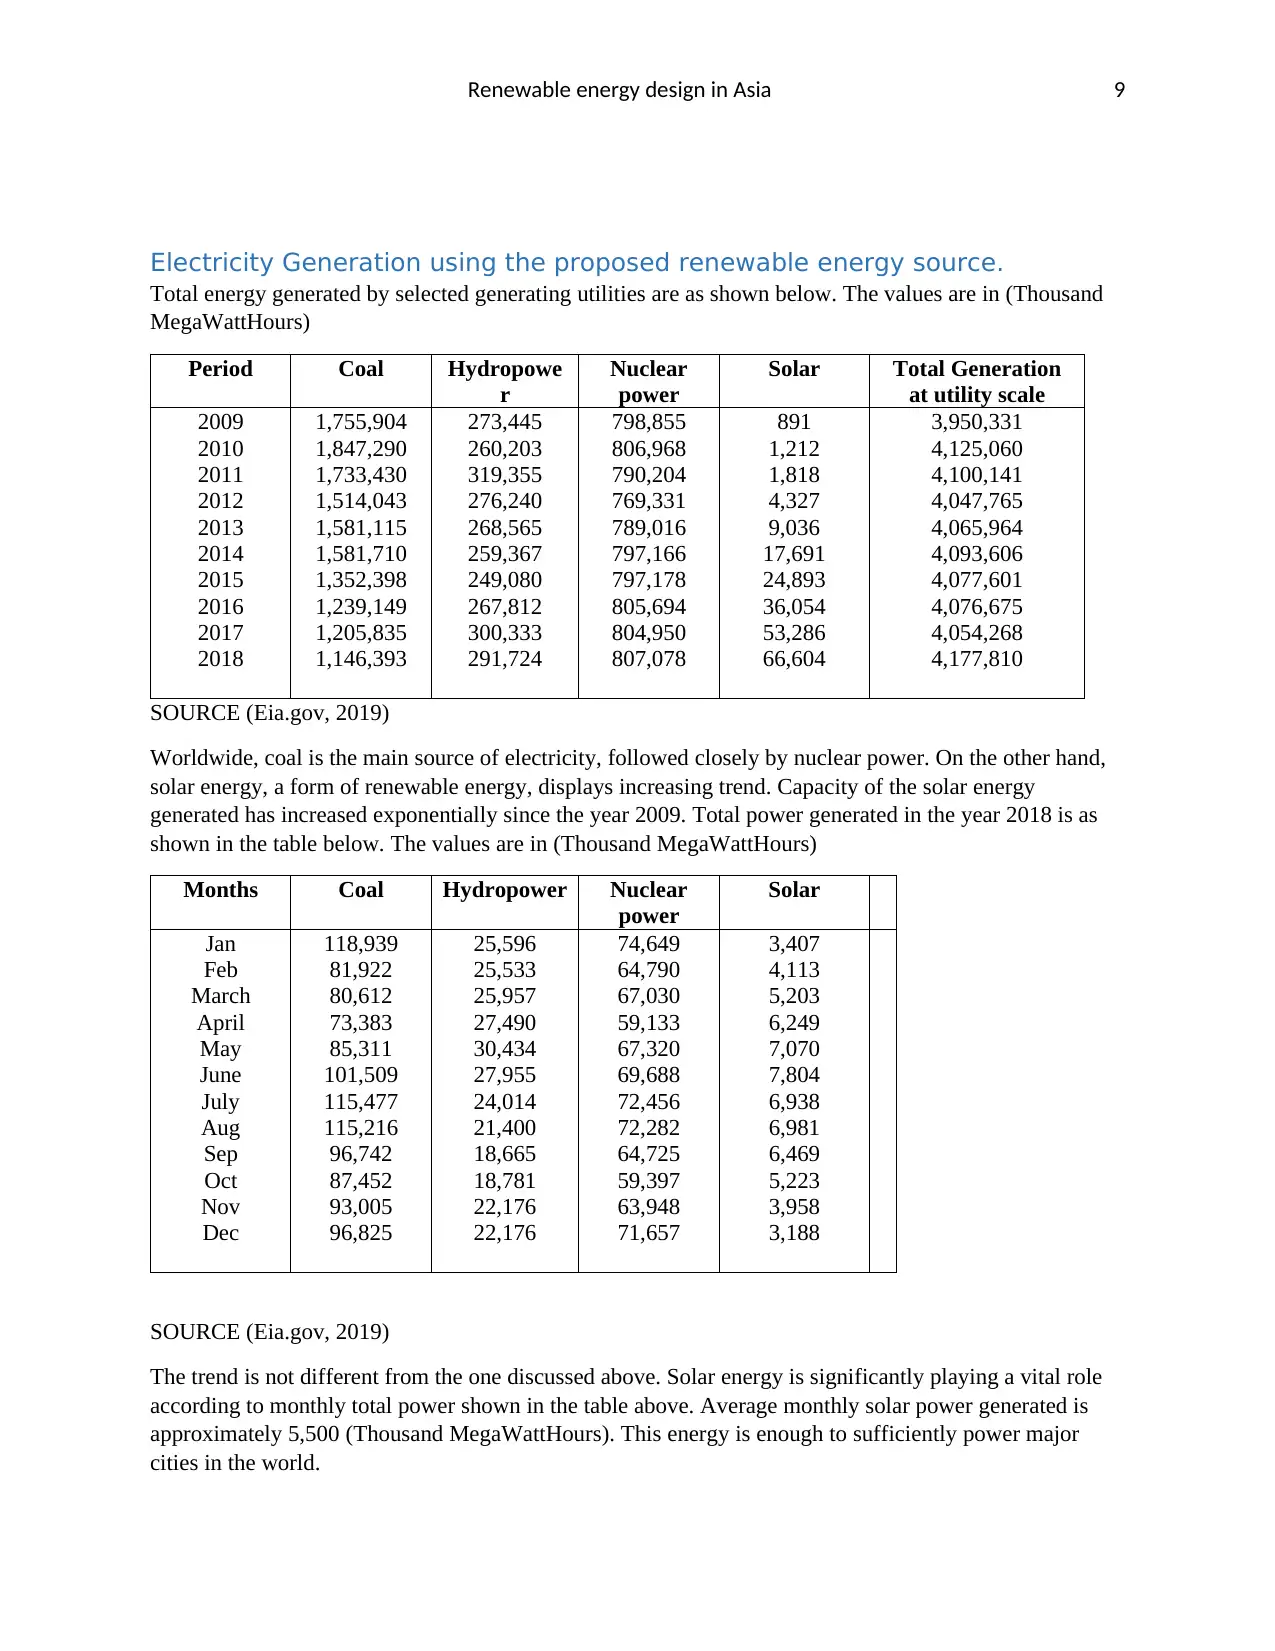
Electricity Generation using the proposed renewable energy source.
Total energy generated by selected generating utilities are as shown below. The values are in (Thousand
MegaWattHours)
Period Coal Hydropowe
r
Nuclear
power
Solar Total Generation
at utility scale
2009
2010
2011
2012
2013
2014
2015
2016
2017
2018
1,755,904
1,847,290
1,733,430
1,514,043
1,581,115
1,581,710
1,352,398
1,239,149
1,205,835
1,146,393
273,445
260,203
319,355
276,240
268,565
259,367
249,080
267,812
300,333
291,724
798,855
806,968
790,204
769,331
789,016
797,166
797,178
805,694
804,950
807,078
891
1,212
1,818
4,327
9,036
17,691
24,893
36,054
53,286
66,604
3,950,331
4,125,060
4,100,141
4,047,765
4,065,964
4,093,606
4,077,601
4,076,675
4,054,268
4,177,810
SOURCE (Eia.gov, 2019)
Worldwide, coal is the main source of electricity, followed closely by nuclear power. On the other hand,
solar energy, a form of renewable energy, displays increasing trend. Capacity of the solar energy
generated has increased exponentially since the year 2009. Total power generated in the year 2018 is as
shown in the table below. The values are in (Thousand MegaWattHours)
Months Coal Hydropower Nuclear
power
Solar
Jan
Feb
March
April
May
June
July
Aug
Sep
Oct
Nov
Dec
118,939
81,922
80,612
73,383
85,311
101,509
115,477
115,216
96,742
87,452
93,005
96,825
25,596
25,533
25,957
27,490
30,434
27,955
24,014
21,400
18,665
18,781
22,176
22,176
74,649
64,790
67,030
59,133
67,320
69,688
72,456
72,282
64,725
59,397
63,948
71,657
3,407
4,113
5,203
6,249
7,070
7,804
6,938
6,981
6,469
5,223
3,958
3,188
SOURCE (Eia.gov, 2019)
The trend is not different from the one discussed above. Solar energy is significantly playing a vital role
according to monthly total power shown in the table above. Average monthly solar power generated is
approximately 5,500 (Thousand MegaWattHours). This energy is enough to sufficiently power major
cities in the world.
⊘ This is a preview!⊘
Do you want full access?
Subscribe today to unlock all pages.
Trusted by 1+ million students worldwide
Renewable energy design in Asia 10
In the design work, cost of installation was estimated. The power plant is supposed to pay-off after 5
years. The relations were then later used to derive suitable tariff of the solar energy generated as shown
below.
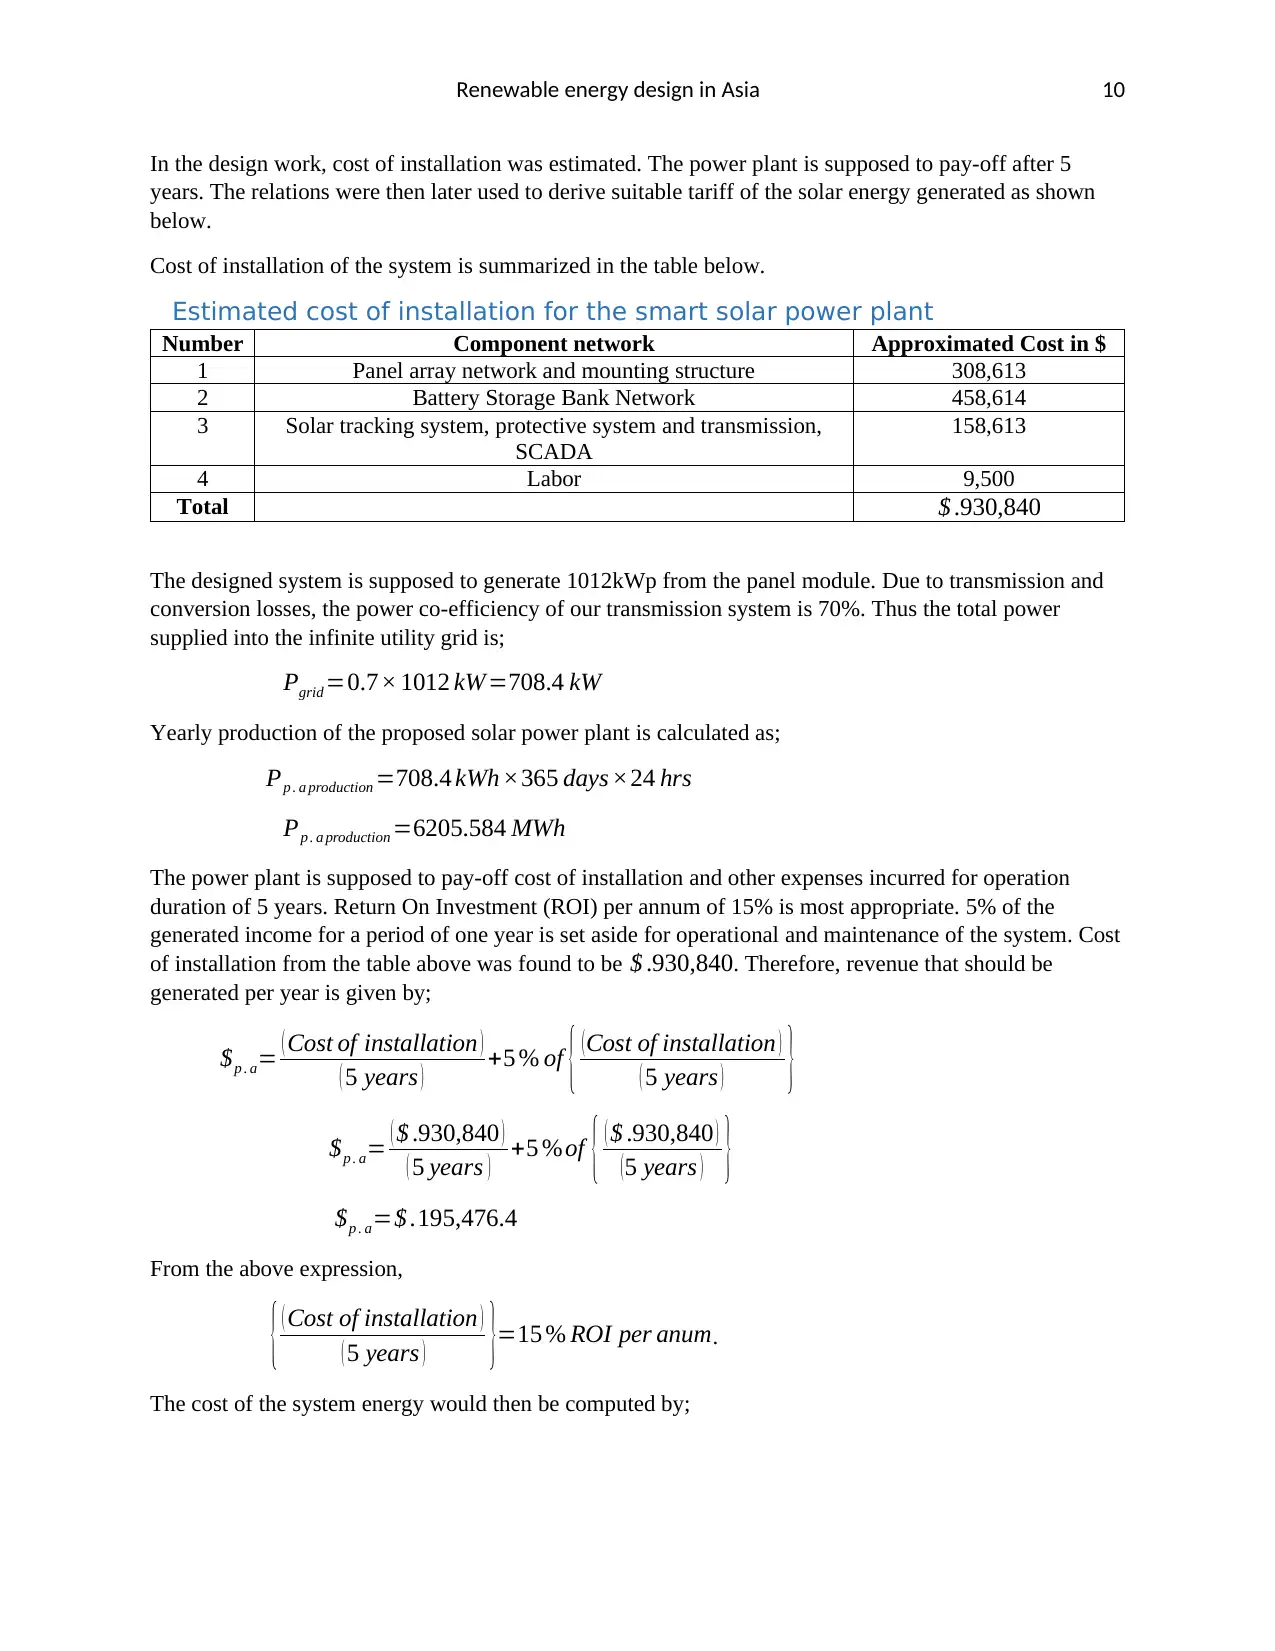
Cost of installation of the system is summarized in the table below.
Estimated cost of installation for the smart solar power plant
Number Component network Approximated Cost in $
1 Panel array network and mounting structure 308,613
2 Battery Storage Bank Network 458,614
3 Solar tracking system, protective system and transmission,
SCADA
158,613
4 Labor 9,500
Total $ .930,840
The designed system is supposed to generate 1012kWp from the panel module. Due to transmission and
conversion losses, the power co-efficiency of our transmission system is 70%. Thus the total power
supplied into the infinite utility grid is;
Pgrid =0.7× 10¹² kW=708.4 kW
Yearly production of the proposed solar power plant is calculated as;
Pp . a production =708.4 kWh ×365 days ×24 hrs
Pp . a production =6205.584 MWh
The power plant is supposed to pay-off cost of installation and other expenses incurred for operation
duration of 5 years. Return On Investment (ROI) per annum of 15% is most appropriate. 5% of the
generated income for a period of one year is set aside for operational and maintenance of the system. Cost
of installation from the table above was found to be $ .930,840. Therefore, revenue that should be
generated per year is given by;
$p . a= ( Cost of installation )
( 5 years ) +5 % of { (Cost of installation )
( 5 years ) }
$p . a= ( $ .930,840 )
( 5 years ) +5 %of { ( $ .930,840 )
(5 years ) }
$p . a=$ .195,476.4
From the above expression,
{ ( Cost of installation )
( 5 years ) }=15 % ROI per anum.
The cost of the system energy would then be computed by;
In the design work, cost of installation was estimated. The power plant is supposed to pay-off after 5
years. The relations were then later used to derive suitable tariff of the solar energy generated as shown
below.
Cost of installation of the system is summarized in the table below.
Estimated cost of installation for the smart solar power plant
Number Component network Approximated Cost in $
1 Panel array network and mounting structure 308,613
2 Battery Storage Bank Network 458,614
3 Solar tracking system, protective system and transmission,
SCADA
158,613
4 Labor 9,500
Total $ .930,840
The designed system is supposed to generate 1012kWp from the panel module. Due to transmission and
conversion losses, the power co-efficiency of our transmission system is 70%. Thus the total power
supplied into the infinite utility grid is;
Pgrid =0.7× 10¹² kW=708.4 kW
Yearly production of the proposed solar power plant is calculated as;
Pp . a production =708.4 kWh ×365 days ×24 hrs
Pp . a production =6205.584 MWh
The power plant is supposed to pay-off cost of installation and other expenses incurred for operation
duration of 5 years. Return On Investment (ROI) per annum of 15% is most appropriate. 5% of the
generated income for a period of one year is set aside for operational and maintenance of the system. Cost
of installation from the table above was found to be $ .930,840. Therefore, revenue that should be
generated per year is given by;
$p . a= ( Cost of installation )
( 5 years ) +5 % of { (Cost of installation )
( 5 years ) }
$p . a= ( $ .930,840 )
( 5 years ) +5 %of { ( $ .930,840 )
(5 years ) }
$p . a=$ .195,476.4
From the above expression,
{ ( Cost of installation )
( 5 years ) }=15 % ROI per anum.
The cost of the system energy would then be computed by;
Paraphrase This Document
Need a fresh take? Get an instant paraphrase of this document with our AI Paraphraser
Renewable energy design in Asia 11
$/kWh= [ { Revenue¿ be generated per year }
{ kWh generated per year } ]
$/kWh= [ { $ . 195,476.4 }
{6205584 kWh } ]=0.03 $ /kWh
Therefore, the tariff of the designed system is 0.03 $/kWh
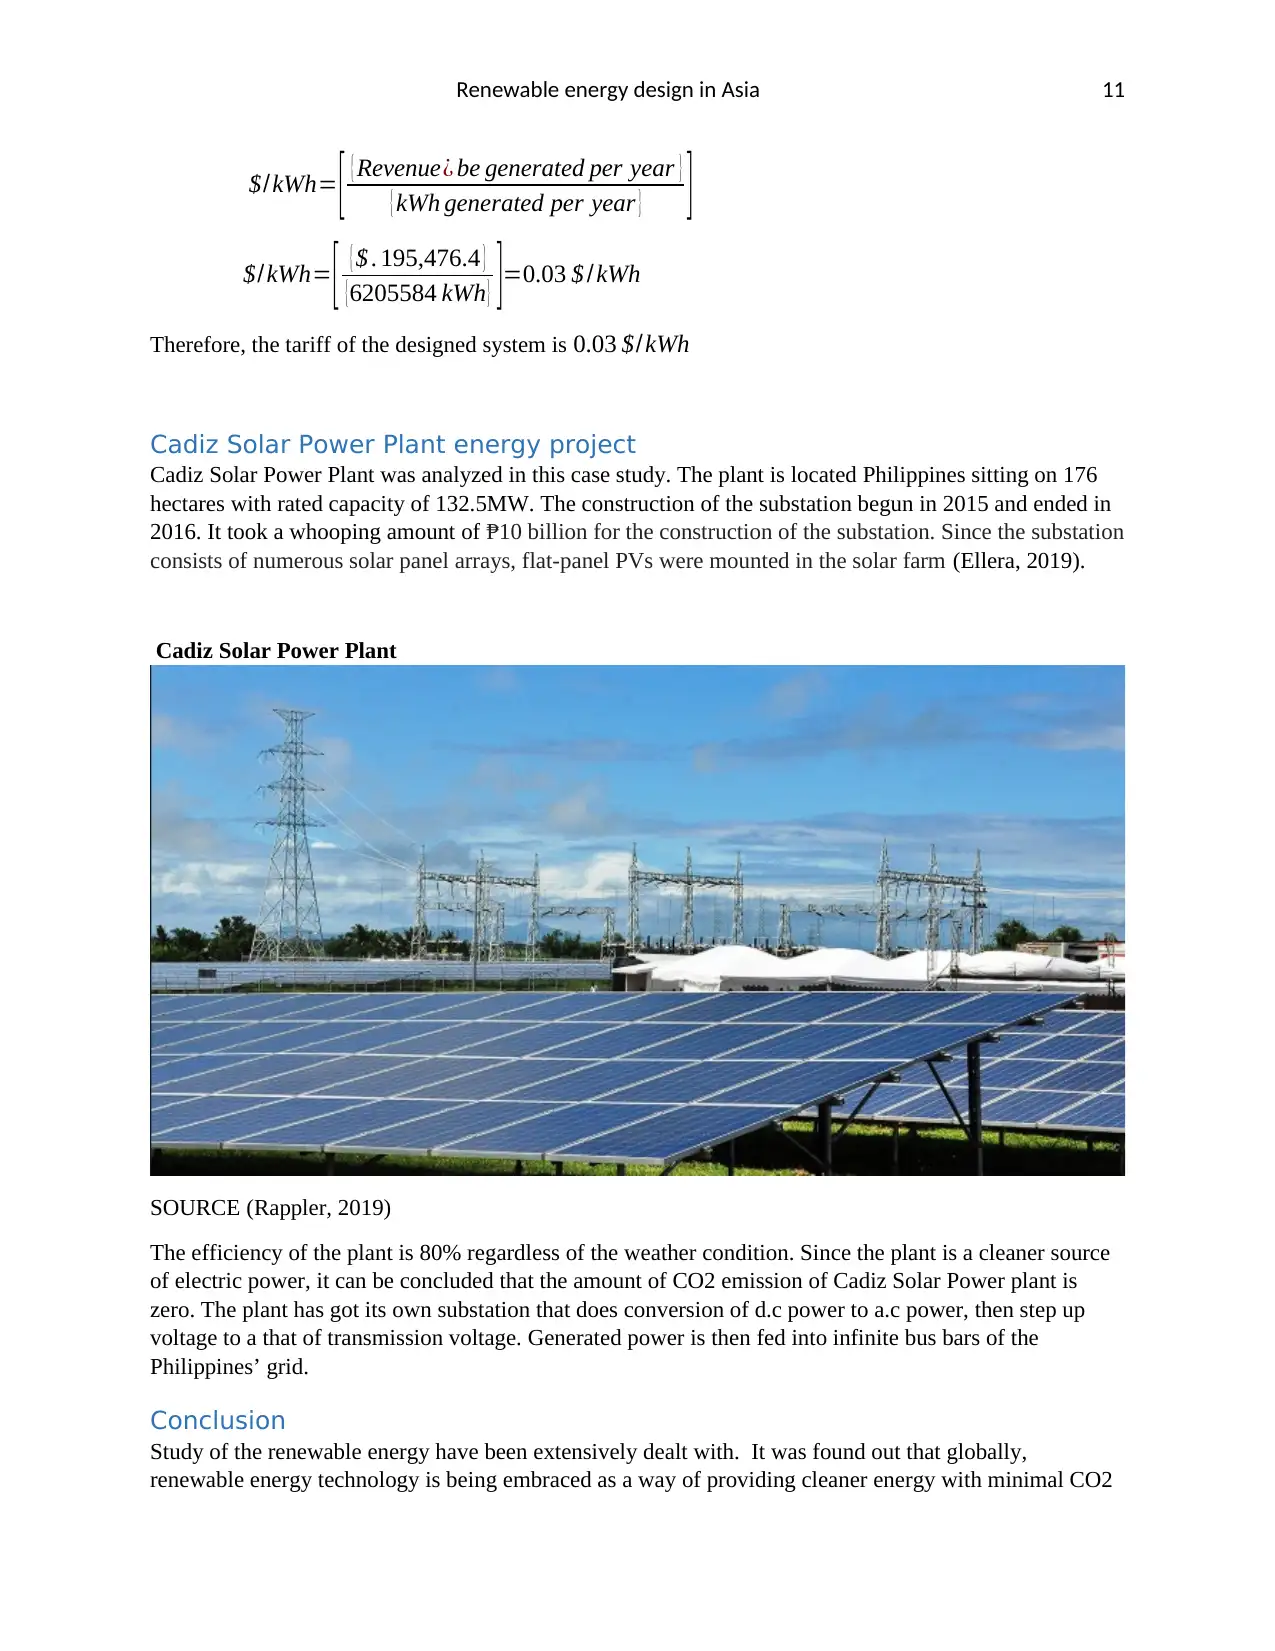
Cadiz Solar Power Plant energy project
Cadiz Solar Power Plant was analyzed in this case study. The plant is located Philippines sitting on 176
hectares with rated capacity of 132.5MW. The construction of the substation begun in 2015 and ended in
2016. It took a whooping amount of ₱10 billion for the construction of the substation. Since the substation
consists of numerous solar panel arrays, flat-panel PVs were mounted in the solar farm (Ellera, 2019).
Cadiz Solar Power Plant
SOURCE (Rappler, 2019)
The efficiency of the plant is 80% regardless of the weather condition. Since the plant is a cleaner source
of electric power, it can be concluded that the amount of CO2 emission of Cadiz Solar Power plant is
zero. The plant has got its own substation that does conversion of d.c power to a.c power, then step up
voltage to a that of transmission voltage. Generated power is then fed into infinite bus bars of the
Philippines’ grid.
Conclusion
Study of the renewable energy have been extensively dealt with. It was found out that globally,
renewable energy technology is being embraced as a way of providing cleaner energy with minimal CO2
$/kWh= [ { Revenue¿ be generated per year }
{ kWh generated per year } ]
$/kWh= [ { $ . 195,476.4 }
{6205584 kWh } ]=0.03 $ /kWh
Therefore, the tariff of the designed system is 0.03 $/kWh
Cadiz Solar Power Plant energy project
Cadiz Solar Power Plant was analyzed in this case study. The plant is located Philippines sitting on 176
hectares with rated capacity of 132.5MW. The construction of the substation begun in 2015 and ended in
2016. It took a whooping amount of ₱10 billion for the construction of the substation. Since the substation
consists of numerous solar panel arrays, flat-panel PVs were mounted in the solar farm (Ellera, 2019).
Cadiz Solar Power Plant
SOURCE (Rappler, 2019)
The efficiency of the plant is 80% regardless of the weather condition. Since the plant is a cleaner source
of electric power, it can be concluded that the amount of CO2 emission of Cadiz Solar Power plant is
zero. The plant has got its own substation that does conversion of d.c power to a.c power, then step up
voltage to a that of transmission voltage. Generated power is then fed into infinite bus bars of the
Philippines’ grid.
Conclusion
Study of the renewable energy have been extensively dealt with. It was found out that globally,
renewable energy technology is being embraced as a way of providing cleaner energy with minimal CO2
Renewable energy design in Asia 12
emission into the atmosphere. The trend of renewable energy has been seen as always advancing. For
instance, solar energy, which was primarily dealt with has been described as a cost-competitive source of
electric power compared to other sources. Smart solar power plant was also designed. Description on how
automated system together with the cloud server synchronize and response for optimum power output has
also been realized. The designed system can be controlled remotely thereby enhancing response speed in
case of faults. Cost analysis and suitable tariff was also determined. A case study of Cadiz Solar plant has
been relatively compared with the designed system.
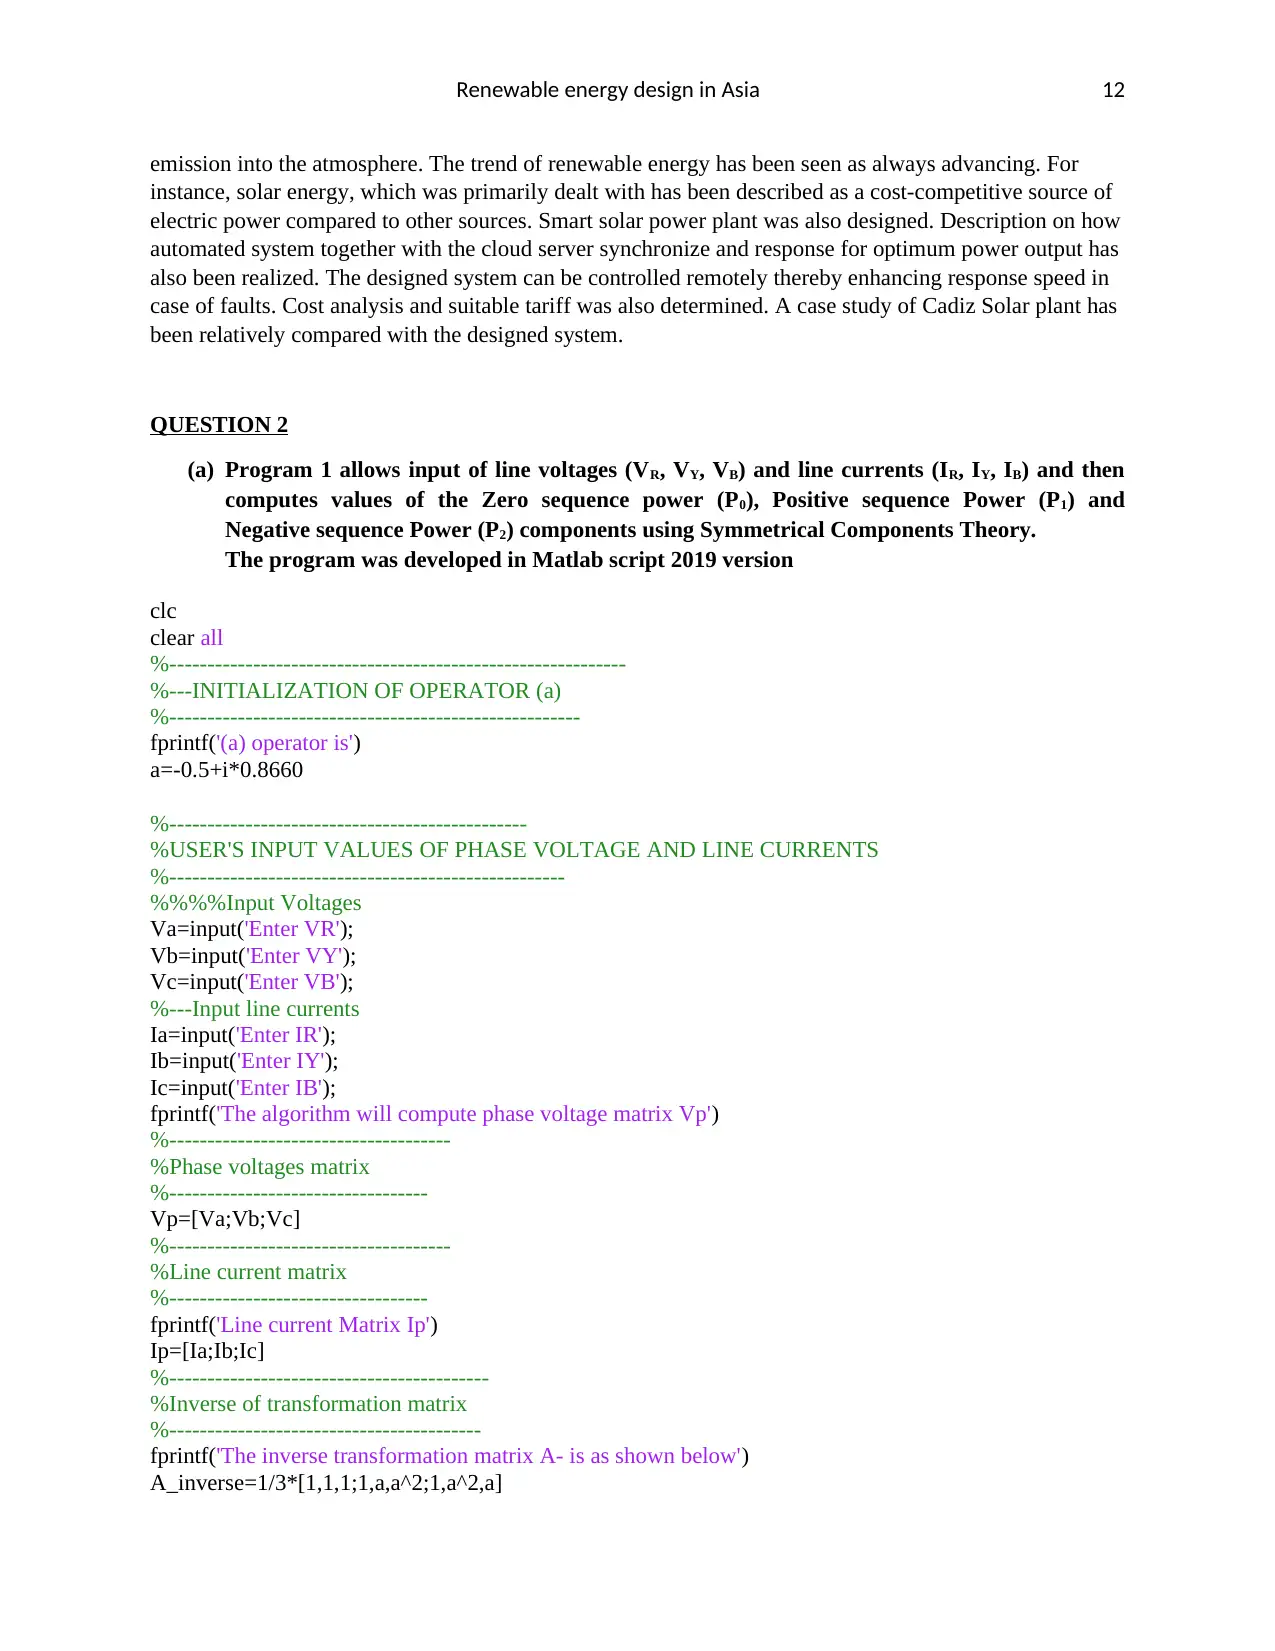
QUESTION 2
(a) Program 1 allows input of line voltages (VR, VY, VB) and line currents (IR, IY, IB) and then
computes values of the Zero sequence power (P0), Positive sequence Power (P1) and
Negative sequence Power (P2) components using Symmetrical Components Theory.
The program was developed in Matlab script 2019 version
clc
clear all
%------------------------------------------------------------
%---INITIALIZATION OF OPERATOR (a)
%------------------------------------------------------
fprintf('(a) operator is')
a=-0.5+i*0.8660
%-----------------------------------------------
%USER'S INPUT VALUES OF PHASE VOLTAGE AND LINE CURRENTS
%----------------------------------------------------
%%%%Input Voltages
Va=input('Enter VR');
Vb=input('Enter VY');
Vc=input('Enter VB');
%---Input line currents
Ia=input('Enter IR');
Ib=input('Enter IY');
Ic=input('Enter IB');
fprintf('The algorithm will compute phase voltage matrix Vp')
%-------------------------------------
%Phase voltages matrix
%----------------------------------
Vp=[Va;Vb;Vc]
%-------------------------------------
%Line current matrix
%----------------------------------
fprintf('Line current Matrix Ip')
Ip=[Ia;Ib;Ic]
%------------------------------------------
%Inverse of transformation matrix
%-----------------------------------------
fprintf('The inverse transformation matrix A- is as shown below')
A_inverse=1/3*[1,1,1;1,a,a^2;1,a^2,a]
emission into the atmosphere. The trend of renewable energy has been seen as always advancing. For
instance, solar energy, which was primarily dealt with has been described as a cost-competitive source of
electric power compared to other sources. Smart solar power plant was also designed. Description on how
automated system together with the cloud server synchronize and response for optimum power output has
also been realized. The designed system can be controlled remotely thereby enhancing response speed in
case of faults. Cost analysis and suitable tariff was also determined. A case study of Cadiz Solar plant has
been relatively compared with the designed system.
QUESTION 2
(a) Program 1 allows input of line voltages (VR, VY, VB) and line currents (IR, IY, IB) and then
computes values of the Zero sequence power (P0), Positive sequence Power (P1) and
Negative sequence Power (P2) components using Symmetrical Components Theory.
The program was developed in Matlab script 2019 version
clc
clear all
%------------------------------------------------------------
%---INITIALIZATION OF OPERATOR (a)
%------------------------------------------------------
fprintf('(a) operator is')
a=-0.5+i*0.8660
%-----------------------------------------------
%USER'S INPUT VALUES OF PHASE VOLTAGE AND LINE CURRENTS
%----------------------------------------------------
%%%%Input Voltages
Va=input('Enter VR');
Vb=input('Enter VY');
Vc=input('Enter VB');
%---Input line currents
Ia=input('Enter IR');
Ib=input('Enter IY');
Ic=input('Enter IB');
fprintf('The algorithm will compute phase voltage matrix Vp')
%-------------------------------------
%Phase voltages matrix
%----------------------------------
Vp=[Va;Vb;Vc]
%-------------------------------------
%Line current matrix
%----------------------------------
fprintf('Line current Matrix Ip')
Ip=[Ia;Ib;Ic]
%------------------------------------------
%Inverse of transformation matrix
%-----------------------------------------
fprintf('The inverse transformation matrix A- is as shown below')
A_inverse=1/3*[1,1,1;1,a,a^2;1,a^2,a]
⊘ This is a preview!⊘
Do you want full access?
Subscribe today to unlock all pages.
Trusted by 1+ million students worldwide
1 out of 23
Related Documents


Your All-in-One AI-Powered Toolkit for Academic Success.
+13062052269
info@desklib.com
Available 24*7 on WhatsApp / Email
![[object Object]](/_next/static/media/star-bottom.7253800d.svg)
Unlock your academic potential
Copyright © 2020–2026 A2Z Services. All Rights Reserved. Developed and managed by ZUCOL.