Detailed Report on Statistical Analysis of Asian and French Cuisine

Verified

Added on  2023/06/10

|11
|1993
|190
Report
AI Summary
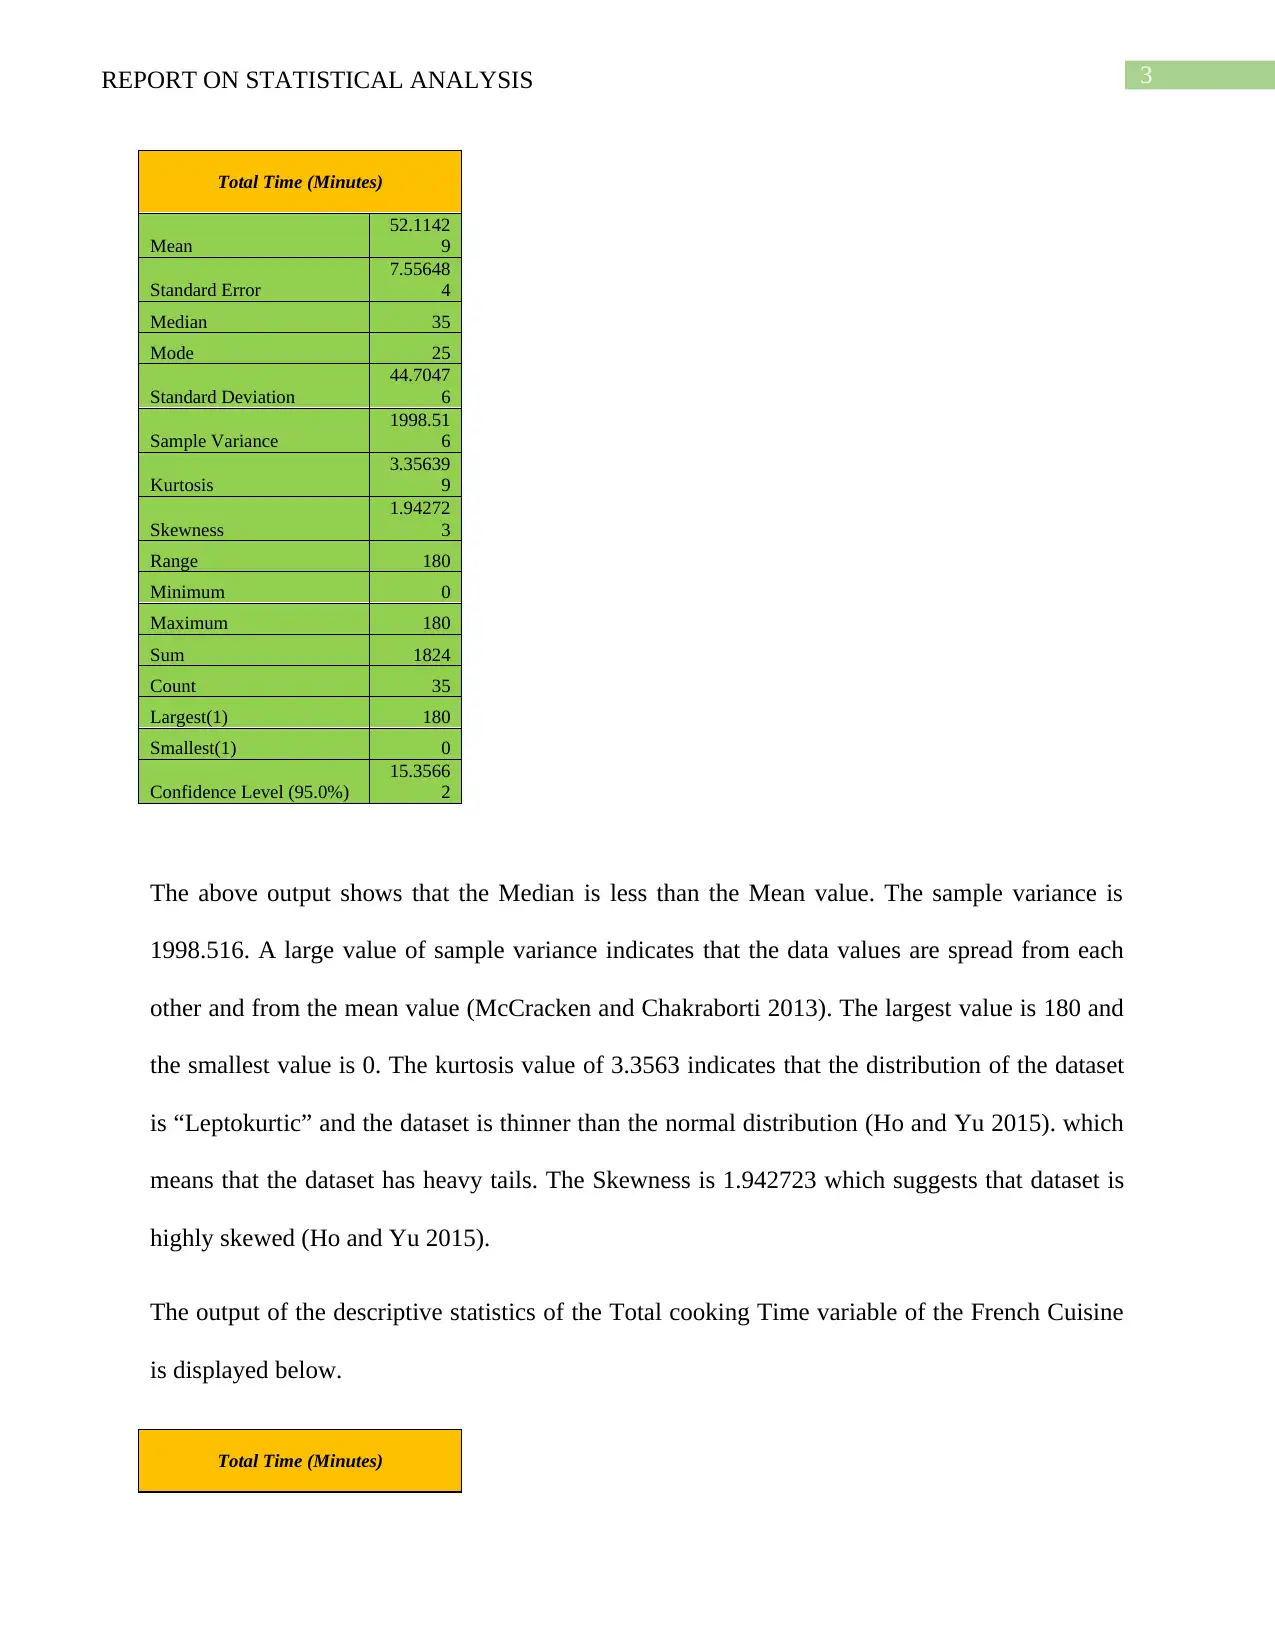
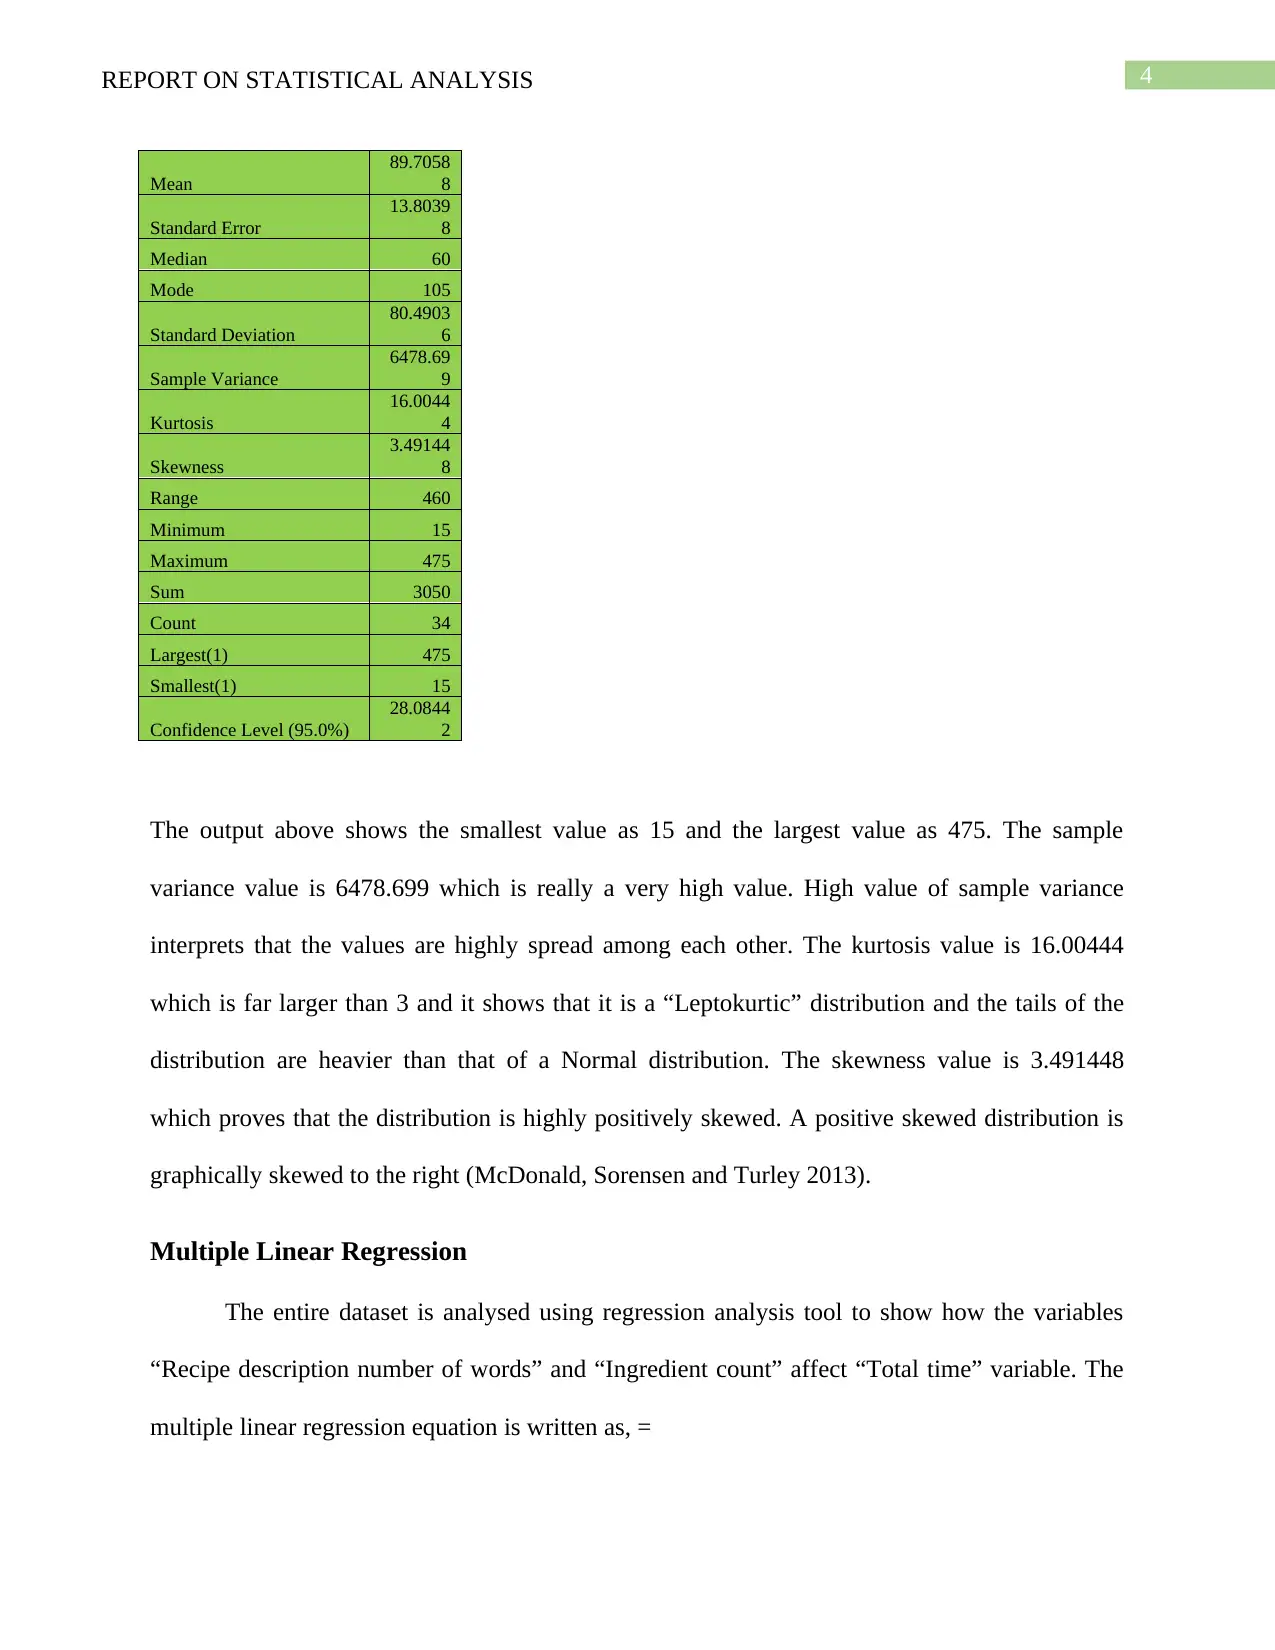
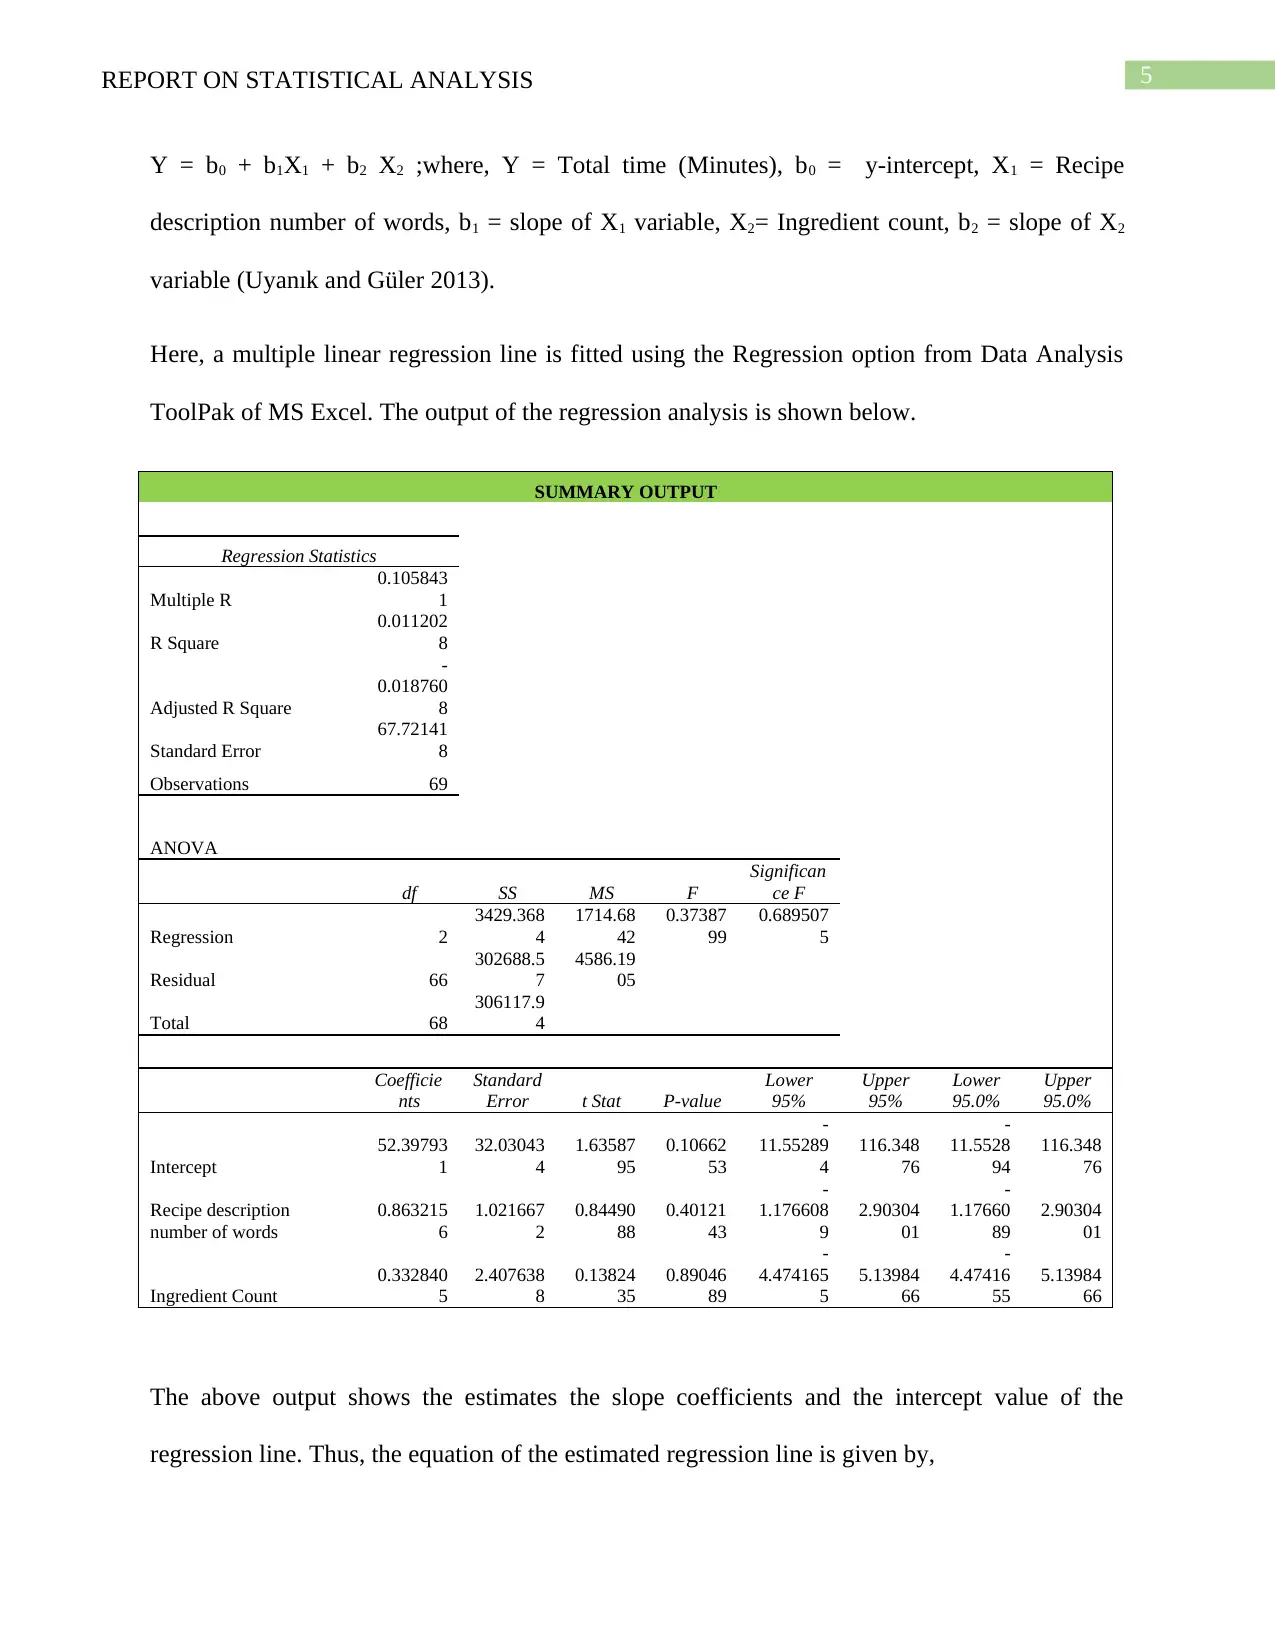
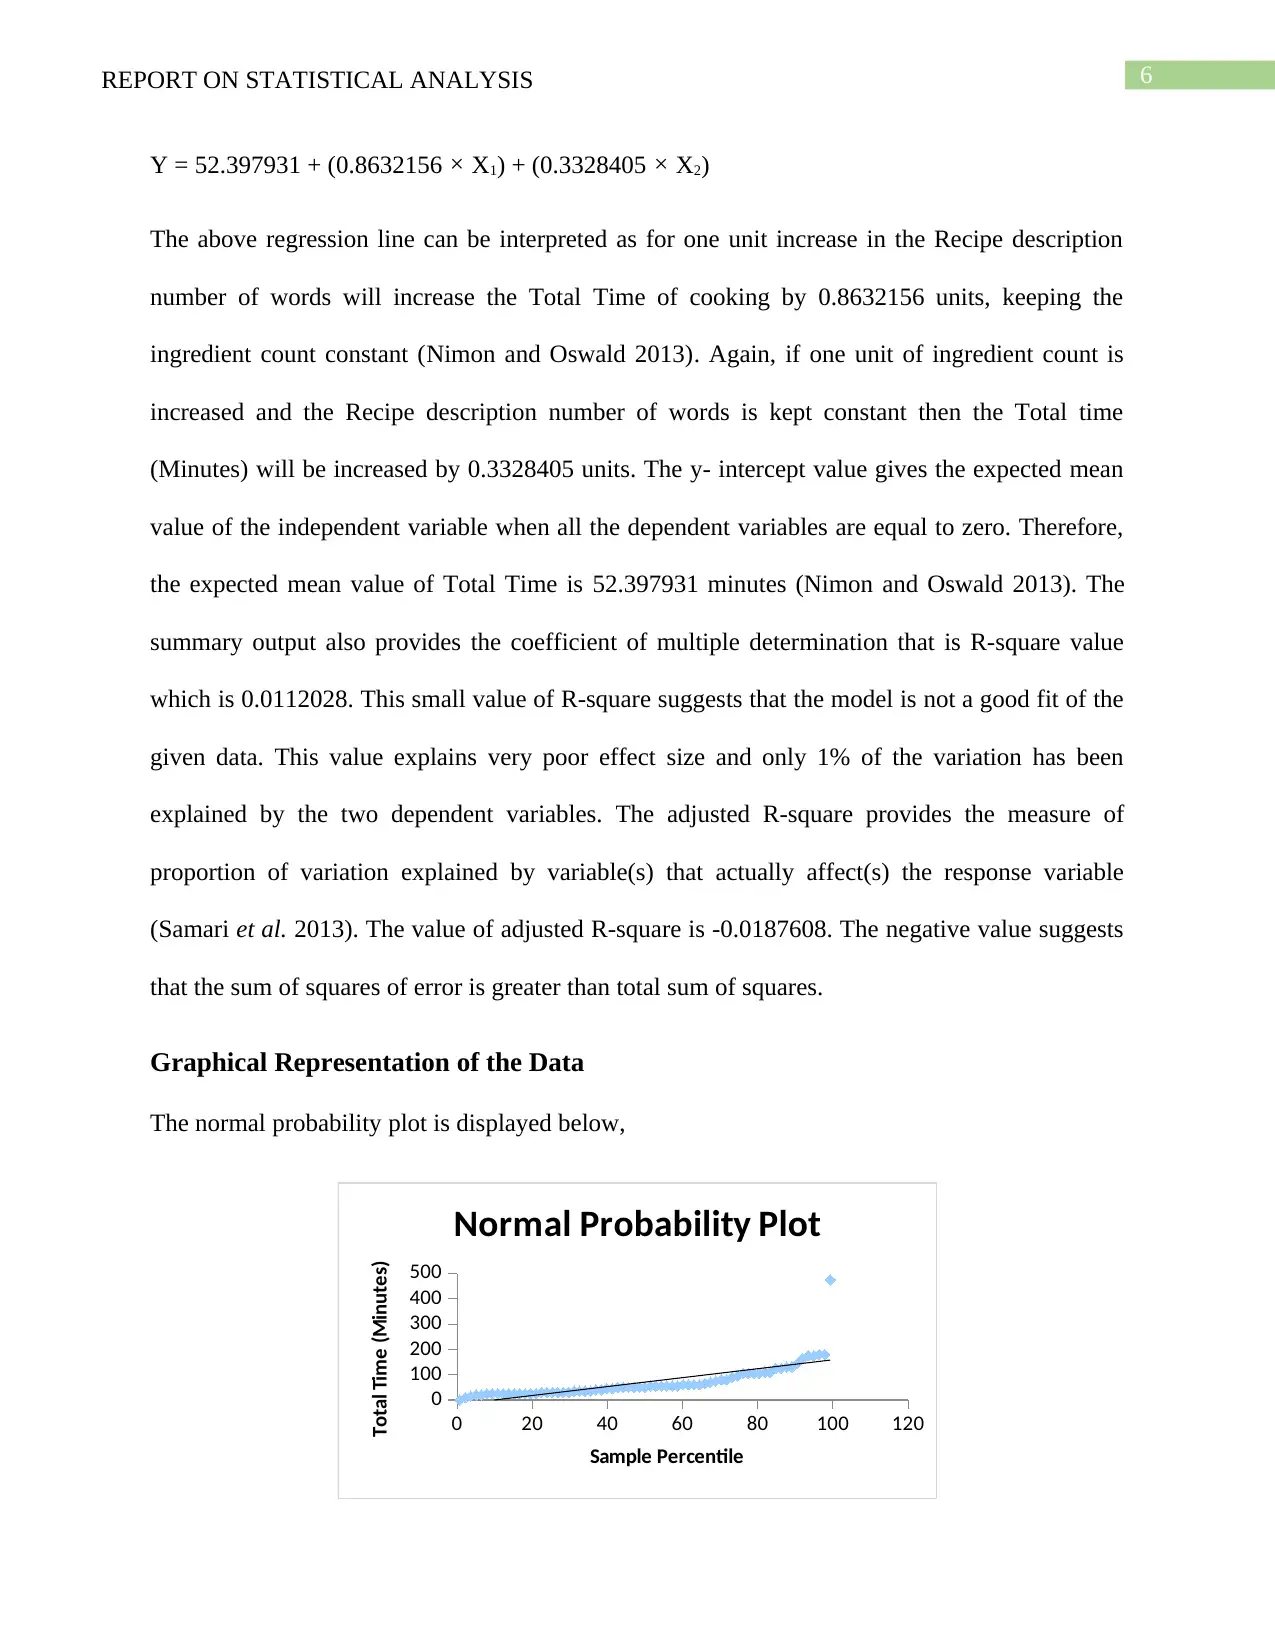
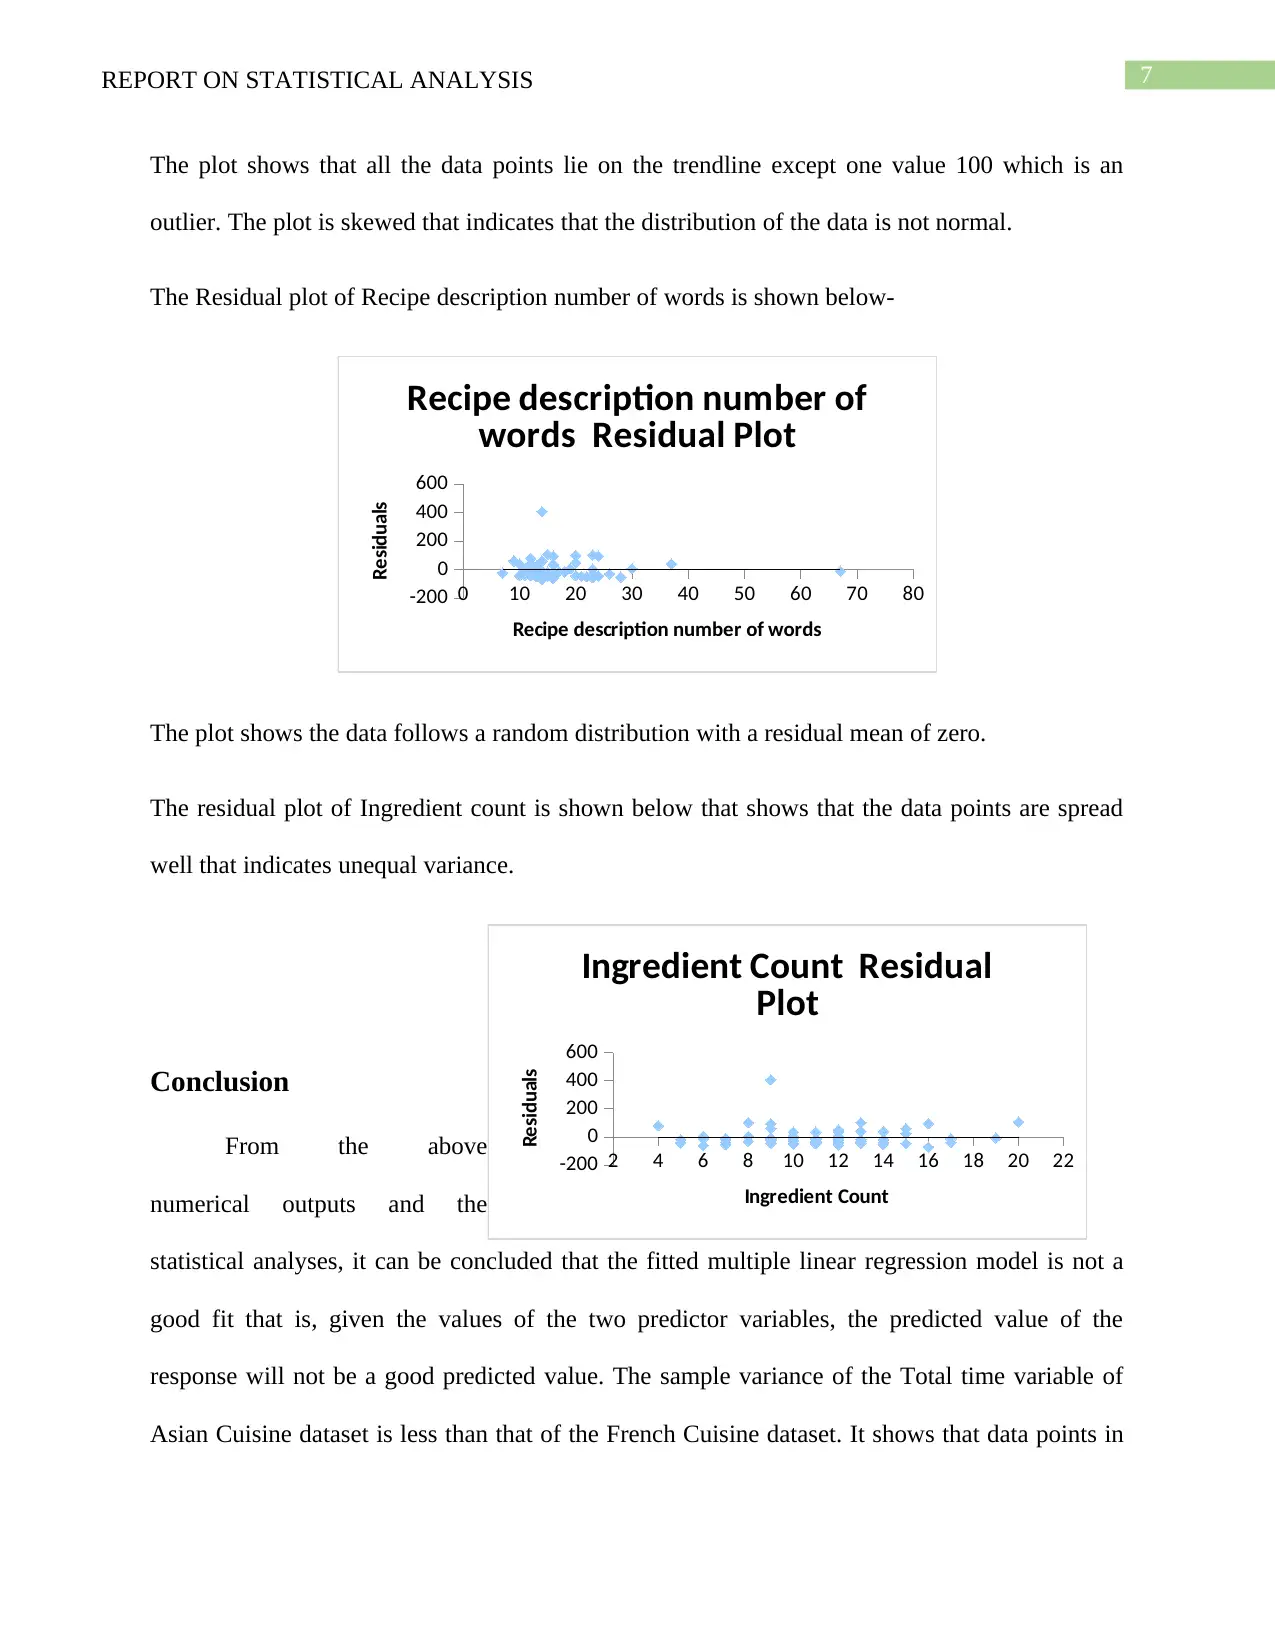
This report presents a statistical analysis of cuisine data collected from taste.com.au in 2018, focusing on Asian and French cuisines. The analysis includes descriptive statistics for variables like 'Total Time,' revealing insights into the distribution and variance of cooking times for both cuisine types. Multiple linear regression is employed to assess the impact of 'Recipe description number of words' and 'Ingredient count' on 'Total time,' although the model demonstrates a poor fit. Graphical representations, including normal probability plots and residual plots, further illustrate data characteristics and model limitations. The report concludes that while changes in recipe description length and ingredient count do affect total cooking time, the effect is not statistically significant, and the fitted regression model is not a reliable predictor.
Document Page
Running head: REPORT ON STATISTICAL ANALYSIS
Report On Statistical Analysis
Name of the Student:
Name of the University:
Author Note:
tabler-icon-diamond-filled.svg

Paraphrase This Document

Need a fresh take? Get an instant paraphrase of this document with our AI Paraphraser
Document Page
1REPORT ON STATISTICAL ANALYSIS
Table of Contents
Introduction......................................................................................................................................2
Discussion........................................................................................................................................2
Descriptive Statistics...................................................................................................................2
Multiple Linear Regression.........................................................................................................4
Graphical Representation of the Data..........................................................................................6
Conclusion.......................................................................................................................................7
References........................................................................................................................................9
Document Page
2REPORT ON STATISTICAL ANALYSIS
Introduction
The report is based on the statistical analysis of a random sample of a secondary data of
69 observations, collected from taste.com.au website in 2018. The dataset consist of information
about Asian and French Cuisine and there are 3 categorical variables (Recipe flavor, Cuisine
origin, and Recipe difficulty) and 5 quantitative variables (Recipe description number of words,
Prep time, Cook time, Total time, and ingredient count). The data is statistically analysed using
MS Excel and then all the conclusions are summarised.
Discussion
The dataset is first recorded in the Excel sheet and then the data is segregated on the basis
of the type of Cuisine Origin. There are two values of the Cuisine Origin variable which are
Asian cuisine and French cuisine. Thus, the dataset is divided into two groups and the two
separate groups of data are analysed using the Data Analysis ToolPak in MS Excel (Carlberg
2014). There are 35 observations of Asian Cuisine and 36 observations of French Cuisine.
Descriptive Statistics
The Descriptive Statistics of “Total Time (Minutes)” variable are evaluated for both the
datasets of the two groups by clicking the “Descriptive Statistics” option of “Data Analysis”
menu from the Data tab (Walkenbach 2013). It provides a thorough analysis of the data,
providing the highest and smallest values, measures of location (Mean, Median, and Mode) and
measures of dispersion (Standard deviation, Variance, Skewness, Kurtosis, and Range)
(Wildemuth 2016).
The output of the descriptive statistics of Asian Cuisine data is shown below-
Document Page
3REPORT ON STATISTICAL ANALYSIS
Total Time (Minutes)
Mean
52.1142
9
Standard Error
7.55648
4
Median 35
Mode 25
Standard Deviation
44.7047
6
Sample Variance
1998.51
6
Kurtosis
3.35639
9
Skewness
1.94272
3
Range 180
Minimum 0
Maximum 180
Sum 1824
Count 35
Largest(1) 180
Smallest(1) 0
Confidence Level (95.0%)
15.3566
2
The above output shows that the Median is less than the Mean value. The sample variance is
1998.516. A large value of sample variance indicates that the data values are spread from each
other and from the mean value (McCracken and Chakraborti 2013). The largest value is 180 and
the smallest value is 0. The kurtosis value of 3.3563 indicates that the distribution of the dataset
is “Leptokurtic” and the dataset is thinner than the normal distribution (Ho and Yu 2015). which
means that the dataset has heavy tails. The Skewness is 1.942723 which suggests that dataset is
highly skewed (Ho and Yu 2015).
The output of the descriptive statistics of the Total cooking Time variable of the French Cuisine
is displayed below.
Total Time (Minutes)
tabler-icon-diamond-filled.svg

Paraphrase This Document

Need a fresh take? Get an instant paraphrase of this document with our AI Paraphraser
Document Page
4REPORT ON STATISTICAL ANALYSIS
Mean
89.7058
8
Standard Error
13.8039
8
Median 60
Mode 105
Standard Deviation
80.4903
6
Sample Variance
6478.69
9
Kurtosis
16.0044
4
Skewness
3.49144
8
Range 460
Minimum 15
Maximum 475
Sum 3050
Count 34
Largest(1) 475
Smallest(1) 15
Confidence Level (95.0%)
28.0844
2
The output above shows the smallest value as 15 and the largest value as 475. The sample
variance value is 6478.699 which is really a very high value. High value of sample variance
interprets that the values are highly spread among each other. The kurtosis value is 16.00444
which is far larger than 3 and it shows that it is a “Leptokurtic” distribution and the tails of the
distribution are heavier than that of a Normal distribution. The skewness value is 3.491448
which proves that the distribution is highly positively skewed. A positive skewed distribution is
graphically skewed to the right (McDonald, Sorensen and Turley 2013).
Multiple Linear Regression
The entire dataset is analysed using regression analysis tool to show how the variables
“Recipe description number of words” and “Ingredient count” affect “Total time” variable. The
multiple linear regression equation is written as, =
Document Page
5REPORT ON STATISTICAL ANALYSIS
Y = b0 + b1X1 + b2 X2 ;where, Y = Total time (Minutes), b0 = y-intercept, X1 = Recipe
description number of words, b1 = slope of X1 variable, X2= Ingredient count, b2 = slope of X2
variable (Uyanık and Güler 2013).
Here, a multiple linear regression line is fitted using the Regression option from Data Analysis
ToolPak of MS Excel. The output of the regression analysis is shown below.
SUMMARY OUTPUT
Regression Statistics
Multiple R
0.105843
1
R Square
0.011202
8
Adjusted R Square
-
0.018760
8
Standard Error
67.72141
8
Observations 69
ANOVA
df SS MS F
Significan
ce F
Regression 2
3429.368
4
1714.68
42
0.37387
99
0.689507
5
Residual 66
302688.5
7
4586.19
05
Total 68
306117.9
4
Coefficie
nts
Standard
Error t Stat P-value
Lower
95%
Upper
95%
Lower
95.0%
Upper
95.0%
Intercept
52.39793
1
32.03043
4
1.63587
95
0.10662
53
-
11.55289
4
116.348
76
-
11.5528
94
116.348
76
Recipe description
number of words
0.863215
6
1.021667
2
0.84490
88
0.40121
43
-
1.176608
9
2.90304
01
-
1.17660
89
2.90304
01
Ingredient Count
0.332840
5
2.407638
8
0.13824
35
0.89046
89
-
4.474165
5
5.13984
66
-
4.47416
55
5.13984
66
The above output shows the estimates the slope coefficients and the intercept value of the
regression line. Thus, the equation of the estimated regression line is given by,
Document Page
6REPORT ON STATISTICAL ANALYSIS
Y = 52.397931 + (0.8632156 × X1) + (0.3328405 × X2)
The above regression line can be interpreted as for one unit increase in the Recipe description
number of words will increase the Total Time of cooking by 0.8632156 units, keeping the
ingredient count constant (Nimon and Oswald 2013). Again, if one unit of ingredient count is
increased and the Recipe description number of words is kept constant then the Total time
(Minutes) will be increased by 0.3328405 units. The y- intercept value gives the expected mean
value of the independent variable when all the dependent variables are equal to zero. Therefore,
the expected mean value of Total Time is 52.397931 minutes (Nimon and Oswald 2013). The
summary output also provides the coefficient of multiple determination that is R-square value
which is 0.0112028. This small value of R-square suggests that the model is not a good fit of the
given data. This value explains very poor effect size and only 1% of the variation has been
explained by the two dependent variables. The adjusted R-square provides the measure of
proportion of variation explained by variable(s) that actually affect(s) the response variable
(Samari et al. 2013). The value of adjusted R-square is -0.0187608. The negative value suggests
that the sum of squares of error is greater than total sum of squares.
Graphical Representation of the Data
The normal probability plot is displayed below,
0 20 40 60 80 100 120
0
100
200
300
400
500
Normal Probability Plot
Sample Percentile
Total Time (Minutes)
tabler-icon-diamond-filled.svg

Paraphrase This Document

Need a fresh take? Get an instant paraphrase of this document with our AI Paraphraser
Document Page
7REPORT ON STATISTICAL ANALYSIS
The plot shows that all the data points lie on the trendline except one value 100 which is an
outlier. The plot is skewed that indicates that the distribution of the data is not normal.
The Residual plot of Recipe description number of words is shown below-
0 10 20 30 40 50 60 70 80-200
0
200
400
600
Recipe description number of
words Residual Plot
Recipe description number of words
Residuals
The plot shows the data follows a random distribution with a residual mean of zero.
The residual plot of Ingredient count is shown below that shows that the data points are spread
well that indicates unequal variance.
Conclusion
From the above
numerical outputs and the
statistical analyses, it can be concluded that the fitted multiple linear regression model is not a
good fit that is, given the values of the two predictor variables, the predicted value of the
response will not be a good predicted value. The sample variance of the Total time variable of
Asian Cuisine dataset is less than that of the French Cuisine dataset. It shows that data points in
2 4 6 8 10 12 14 16 18 20 22-200
0
200
400
600
Ingredient Count Residual
Plot
Ingredient Count
Residuals
Document Page
8REPORT ON STATISTICAL ANALYSIS
case of Asian Cuisine data is less spread than that of the French Cuisine dataset. Moreover, the
value of skewness of Asian Cuisines data is less than that of the French Cuisine data that
indicates the data distribution is more positively skewed in case of French Cuisine data than the
distribution of the Asian Cuisine data. Finally, it can be said that the change in the value of the
variables Recipe description number of words and Ingredient count affect the Total time. With
the increase of these two variables, the Total time also hgets increased. However, the increase is
not significant.
Document Page
9REPORT ON STATISTICAL ANALYSIS
References
Carlberg, C., 2014. Statistical analysis: microsoft excel 2013. Que Publishing.
Ho, A.D. and Yu, C.C., 2015. Descriptive statistics for modern test score distributions:
Skewness, kurtosis, discreteness, and ceiling effects. Educational and Psychological
Measurement, 75(3), pp.365-388.
McCracken, A.K. and Chakraborti, S., 2013. Control charts for joint monitoring of mean and
variance: an overview. Quality Technology & Quantitative Management, 10(1), pp.17-36.
McDonald, J.B., Sorensen, J. and Turley, P.A., 2013. Skewness and kurtosis properties of
income distribution models. Review of Income and Wealth, 59(2), pp.360-374.
Nimon, K.F. and Oswald, F.L., 2013. Understanding the results of multiple linear regression:
Beyond standardized regression coefficients. Organizational Research Methods, 16(4), pp.650-
674.
Nimon, K.F. and Oswald, F.L., 2013. Understanding the results of multiple linear regression:
Beyond standardized regression coefficients. Organizational Research Methods, 16(4), pp.650-
674.
Samari, M., Ghodrati, N., Esmaeilifar, R., Olfat, P. and Shafiei, M.W.M., 2013. The
investigation of the barriers in developing green building in Malaysia. Modern Applied Science,
7(2), p.1.
Uyanık, G.K. and Güler, N., 2013. A study on multiple linear regression analysis. Procedia-
Social and Behavioral Sciences, 106, pp.234-240.
Walkenbach, J., 2013. Excel 2003 bible (Vol. 36). John Wiley & Sons.
tabler-icon-diamond-filled.svg

Paraphrase This Document

Need a fresh take? Get an instant paraphrase of this document with our AI Paraphraser
Document Page
10REPORT ON STATISTICAL ANALYSIS
Wildemuth, B.M. ed., 2016. Applications of social research methods to questions in information
and library science. ABC-CLIO.
chevron_up_icon
1 out of 11
circle_padding
hide_on_mobile
zoom_out_icon
[object Object]