Detailed Financial Ratio Analysis Report of ASOS plc (2019-2020)

Verified

Added on  2023/06/12

|6
|1198
|195
Report
AI Summary
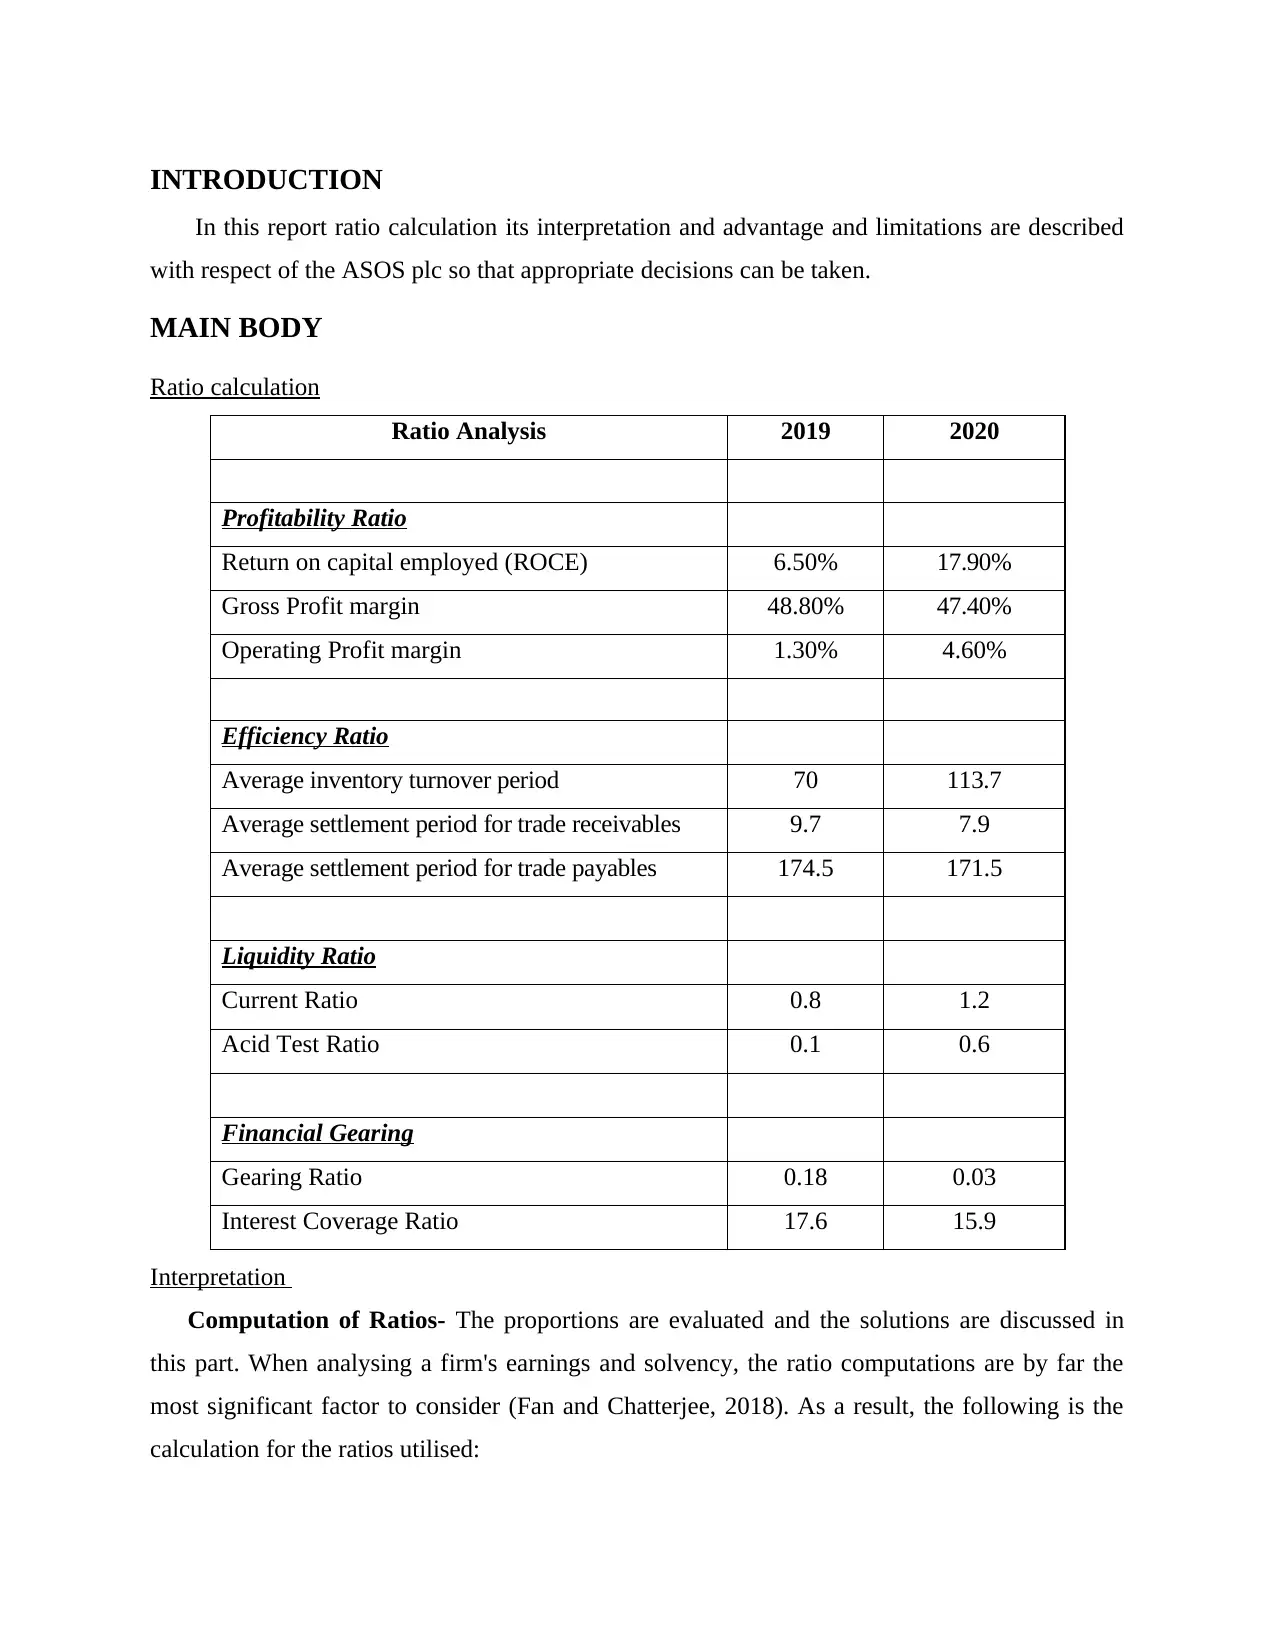
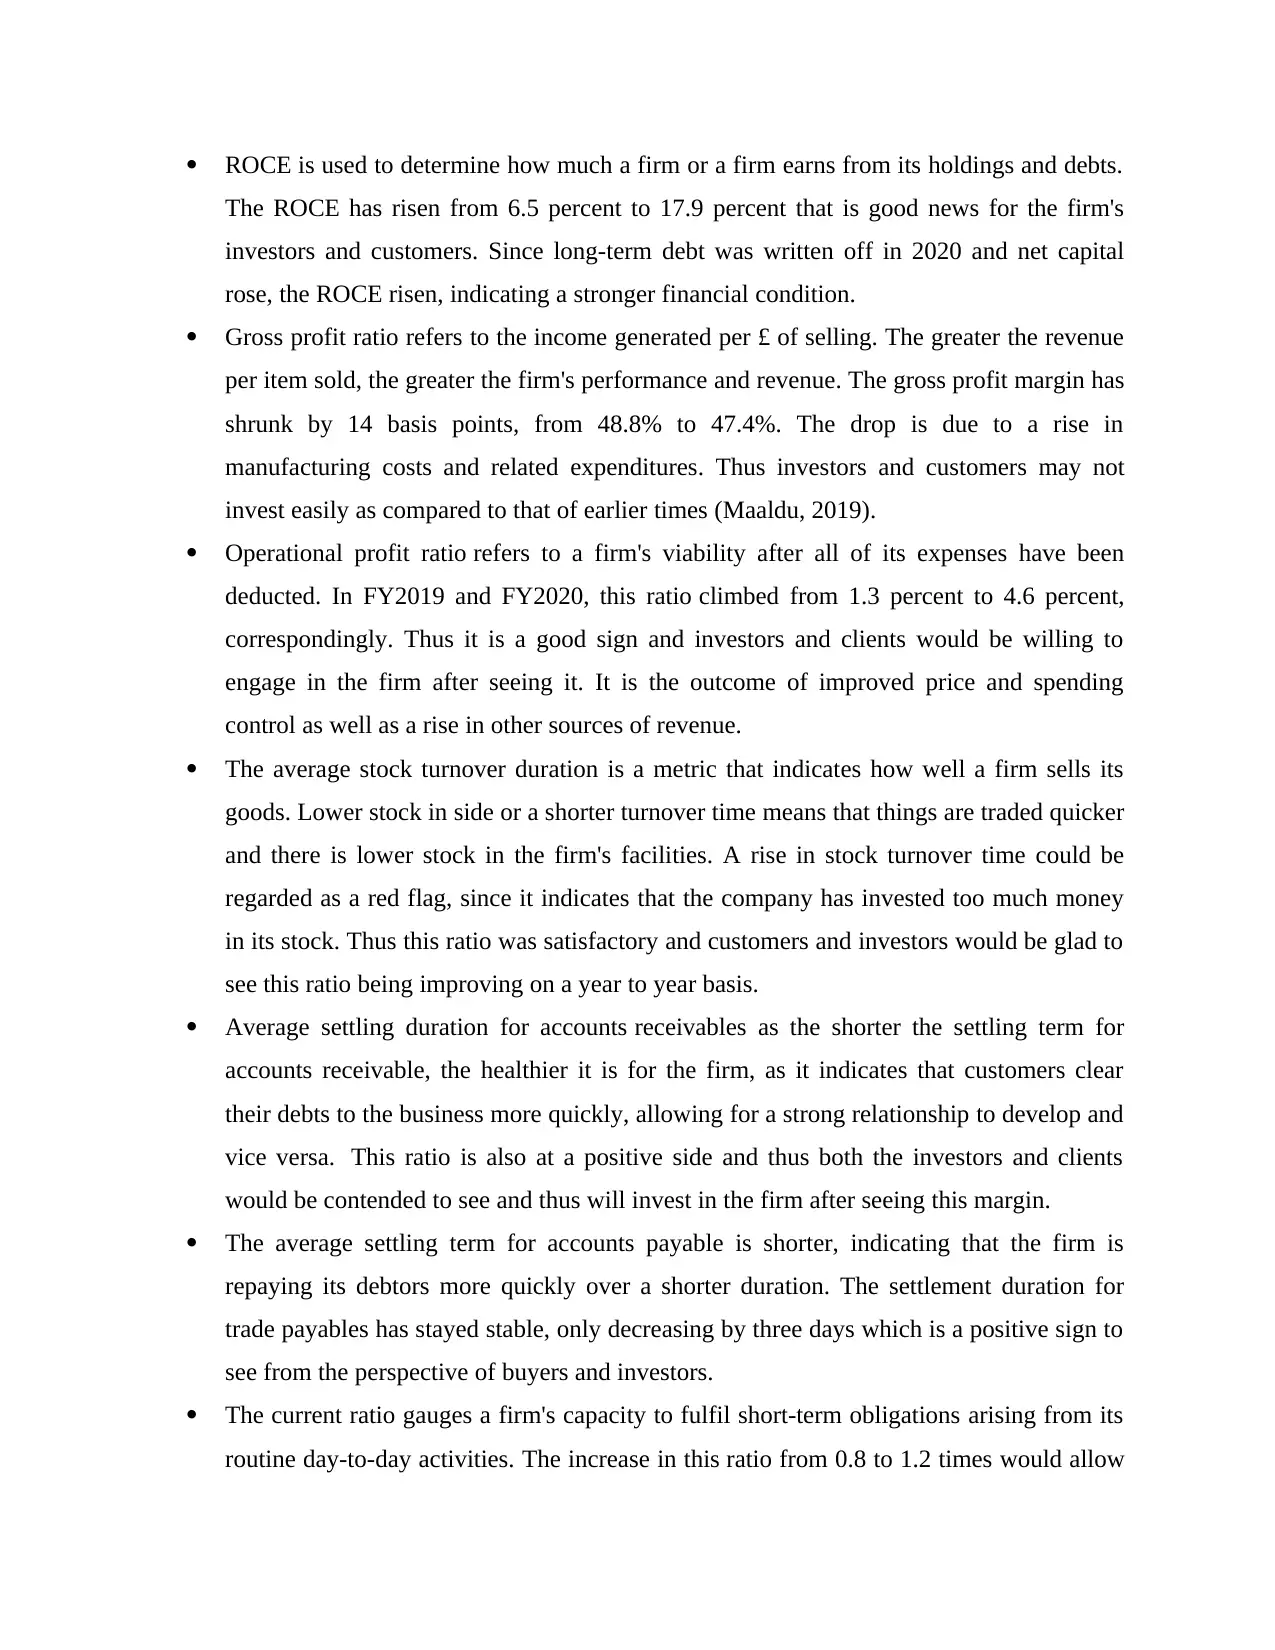
This report provides a financial ratio analysis of ASOS plc for the years 2019 and 2020. It includes calculations and interpretations of key ratios such as Return on Capital Employed (ROCE), Gross Profit Margin, Operating Profit Margin, Inventory Turnover Period, Average Settlement Periods for Trade Receivables and Payables, Current Ratio, Acid Test Ratio, Gearing Ratio, and Interest Coverage Ratio. The analysis indicates improvements in ROCE, Operating Profit Margin, and Current Ratio, suggesting better financial health. However, the Gross Profit Margin decreased slightly. The report also discusses the advantages and limitations of using financial ratios for decision-making, concluding that while ratios offer valuable insights, they should be used cautiously due to the unpredictable nature of future events. Desklib offers a platform to explore this and similar solved assignments.
Document Page
Project One - Financial
Ratios Report
tabler-icon-diamond-filled.svg

Paraphrase This Document

Need a fresh take? Get an instant paraphrase of this document with our AI Paraphraser
Document Page
Contents
Contents...........................................................................................................................................2
INTRODUCTION...........................................................................................................................1
MAIN BODY..................................................................................................................................1
Ratio calculation..........................................................................................................................1
Interpretation................................................................................................................................1
Advantages and limitations of ratios...........................................................................................3
CONCLUSION................................................................................................................................3
REFERENCES................................................................................................................................4
Document Page
INTRODUCTION
In this report ratio calculation its interpretation and advantage and limitations are described
with respect of the ASOS plc so that appropriate decisions can be taken.
MAIN BODY
Ratio calculation
Ratio Analysis 2019 2020
Profitability Ratio
Return on capital employed (ROCE) 6.50% 17.90%
Gross Profit margin 48.80% 47.40%
Operating Profit margin 1.30% 4.60%
Efficiency Ratio
Average inventory turnover period 70 113.7
Average settlement period for trade receivables 9.7 7.9
Average settlement period for trade payables 174.5 171.5
Liquidity Ratio
Current Ratio 0.8 1.2
Acid Test Ratio 0.1 0.6
Financial Gearing
Gearing Ratio 0.18 0.03
Interest Coverage Ratio 17.6 15.9
Interpretation
Computation of Ratios- The proportions are evaluated and the solutions are discussed in
this part. When analysing a firm's earnings and solvency, the ratio computations are by far the
most significant factor to consider (Fan and Chatterjee, 2018). As a result, the following is the
calculation for the ratios utilised:
Document Page
ROCE is used to determine how much a firm or a firm earns from its holdings and debts.
The ROCE has risen from 6.5 percent to 17.9 percent that is good news for the firm's
investors and customers. Since long-term debt was written off in 2020 and net capital
rose, the ROCE risen, indicating a stronger financial condition.
Gross profit ratio refers to the income generated per £ of selling. The greater the revenue
per item sold, the greater the firm's performance and revenue. The gross profit margin has
shrunk by 14 basis points, from 48.8% to 47.4%. The drop is due to a rise in
manufacturing costs and related expenditures. Thus investors and customers may not
invest easily as compared to that of earlier times (Maaldu, 2019).
Operational profit ratio refers to a firm's viability after all of its expenses have been
deducted. In FY2019 and FY2020, this ratio climbed from 1.3 percent to 4.6 percent,
correspondingly. Thus it is a good sign and investors and clients would be willing to
engage in the firm after seeing it. It is the outcome of improved price and spending
control as well as a rise in other sources of revenue.
The average stock turnover duration is a metric that indicates how well a firm sells its
goods. Lower stock in side or a shorter turnover time means that things are traded quicker
and there is lower stock in the firm's facilities. A rise in stock turnover time could be
regarded as a red flag, since it indicates that the company has invested too much money
in its stock. Thus this ratio was satisfactory and customers and investors would be glad to
see this ratio being improving on a year to year basis.
Average settling duration for accounts receivables as the shorter the settling term for
accounts receivable, the healthier it is for the firm, as it indicates that customers clear
their debts to the business more quickly, allowing for a strong relationship to develop and
vice versa. This ratio is also at a positive side and thus both the investors and clients
would be contended to see and thus will invest in the firm after seeing this margin.
The average settling term for accounts payable is shorter, indicating that the firm is
repaying its debtors more quickly over a shorter duration. The settlement duration for
trade payables has stayed stable, only decreasing by three days which is a positive sign to
see from the perspective of buyers and investors.
The current ratio gauges a firm's capacity to fulfil short-term obligations arising from its
routine day-to-day activities. The increase in this ratio from 0.8 to 1.2 times would allow
tabler-icon-diamond-filled.svg

Paraphrase This Document

Need a fresh take? Get an instant paraphrase of this document with our AI Paraphraser
Document Page
for improved volatility monitoring. A rise in this ratio indicates that the business has
more and greater flexibility which will attract both investors and clients (Morris and
Daley, 2017).
The acid test ratio is the current ratio minus stock balances. A corporation with too much
stock is likewise at risk. Lowering the acid test indicates that too much investment is
invested in stock, which would affect the business if the stock becomes outdated and thus
this ratio is not satisfactory which hence will make investors and buyers restrain from
engaging with the firm.
The gearing ratio is a metric of the firm's fiscal reliance in order to finance its day-to-day
operations. The drop in this ratio is a favourable trend, indicating that borrowing has been
paid on schedule and that loan has been removed from the income statement, indicating
less dependence on borrowing and greater emphasis on equities as a source of finance
and thus will entice investors and customers to do engage in the company.
Interest Coverage proportion indicates the extent to which a firm's interest expenses
coming from borrowing could be covered. The fall in this ratio from 17.6 to 15.9 is due to
a reduction in borrowing on the income statement as well as prompt loan repayment,
resulting in less existing credit on the income statement every year. Thus it can entice
both investors and buyers to make an appropriate investment in the firm.
Advantages and limitations of ratios
There are many advantages of ratios as one being that it helps in an evaluation of the past
and future so that appropriate decisions can be taken in the present (Njeru, 2016). The
disadvantage of it is that the future is unforeseen and thus it is not beneficial to plan for the
things that are not necessary to happen thus only adding to the cost.
CONCLUSION
It can be concluded from the above that the firm is performing well in the market and thus
only a few changes here and there can make the firm stay ahead of all its competitors in the long
run scenario.
Document Page
REFERENCES
Books and journals
Fan, L. and Chatterjee, S., 2018. Application of situational stimuli for examining the
effectiveness of financial education: A behavioral finance perspective. Journal of
Behavioral and Experimental Finance. 17. pp.68-75.
Maaldu, E.B., 2019. FINANCIAL MANAGEMENT PRACTICES AND FINANCIAL
SUSTAINABILITY OF LOCAL NON-GOVERNMENTAL ORGANIZATIONS (Doctoral
dissertation).
Morris, J.R. and Daley, J.P., 2017. Introduction to financial models for management and
planning. CRC press.
Njeru, M.D., 2016. Effect of Liquidity Management on financial performance of Deposit Taking
Saving and credit co-operative society in Kenya (Doctoral dissertation, Business
Administration (Finance), JKUAT).
chevron_up_icon
1 out of 6
circle_padding
hide_on_mobile
zoom_out_icon
[object Object]