SBM3201 Management Accounting: Assessment 3 Finance Report
VerifiedAdded on 2022/09/26
|16
|3245
|18
Report
AI Summary
This report presents a detailed analysis of Tinka Tokyo Truck Manufacturing Co.'s financial performance, including cost of goods manufactured, cost of goods sold, and income statements. The report calculates and interprets key financial metrics, such as gross profit and net income, providing insights into the company's efficiency and profitability. It examines direct and indirect costs, analyzing manufacturing overheads, direct labor, and raw materials. The analysis further explores the company's inventory management, identifying areas for improvement like Work-In-Progress. The report also differentiates between manufacturing and production costs and provides recommendations for enhancing operational efficiency and profitability, including reducing batch sizes and improving administrative charges. The analysis also considers the impact of income taxes on the company's net income and concludes that the company has been profitable overall and needs to be continued in the way it has been doing.
Running head: ASSESSMENT 3
Assessment 3
Name of the Student
Name of the University
Author Note
Assessment 3
Name of the Student
Name of the University
Author Note
Paraphrase This Document
Need a fresh take? Get an instant paraphrase of this document with our AI Paraphraser
1ASSESSMENT 3
Table of Contents
Answer to Question 1......................................................................................................................2
a. Cost of Goods Manufactured Statement...............................................................................2
b. Cost of Goods Sold Statement..............................................................................................3
c. Income Statement.................................................................................................................4
Analysis........................................................................................................................................5
Answer to Question 2......................................................................................................................8
References..................................................................................................................................12
2ASSESSMENT 3
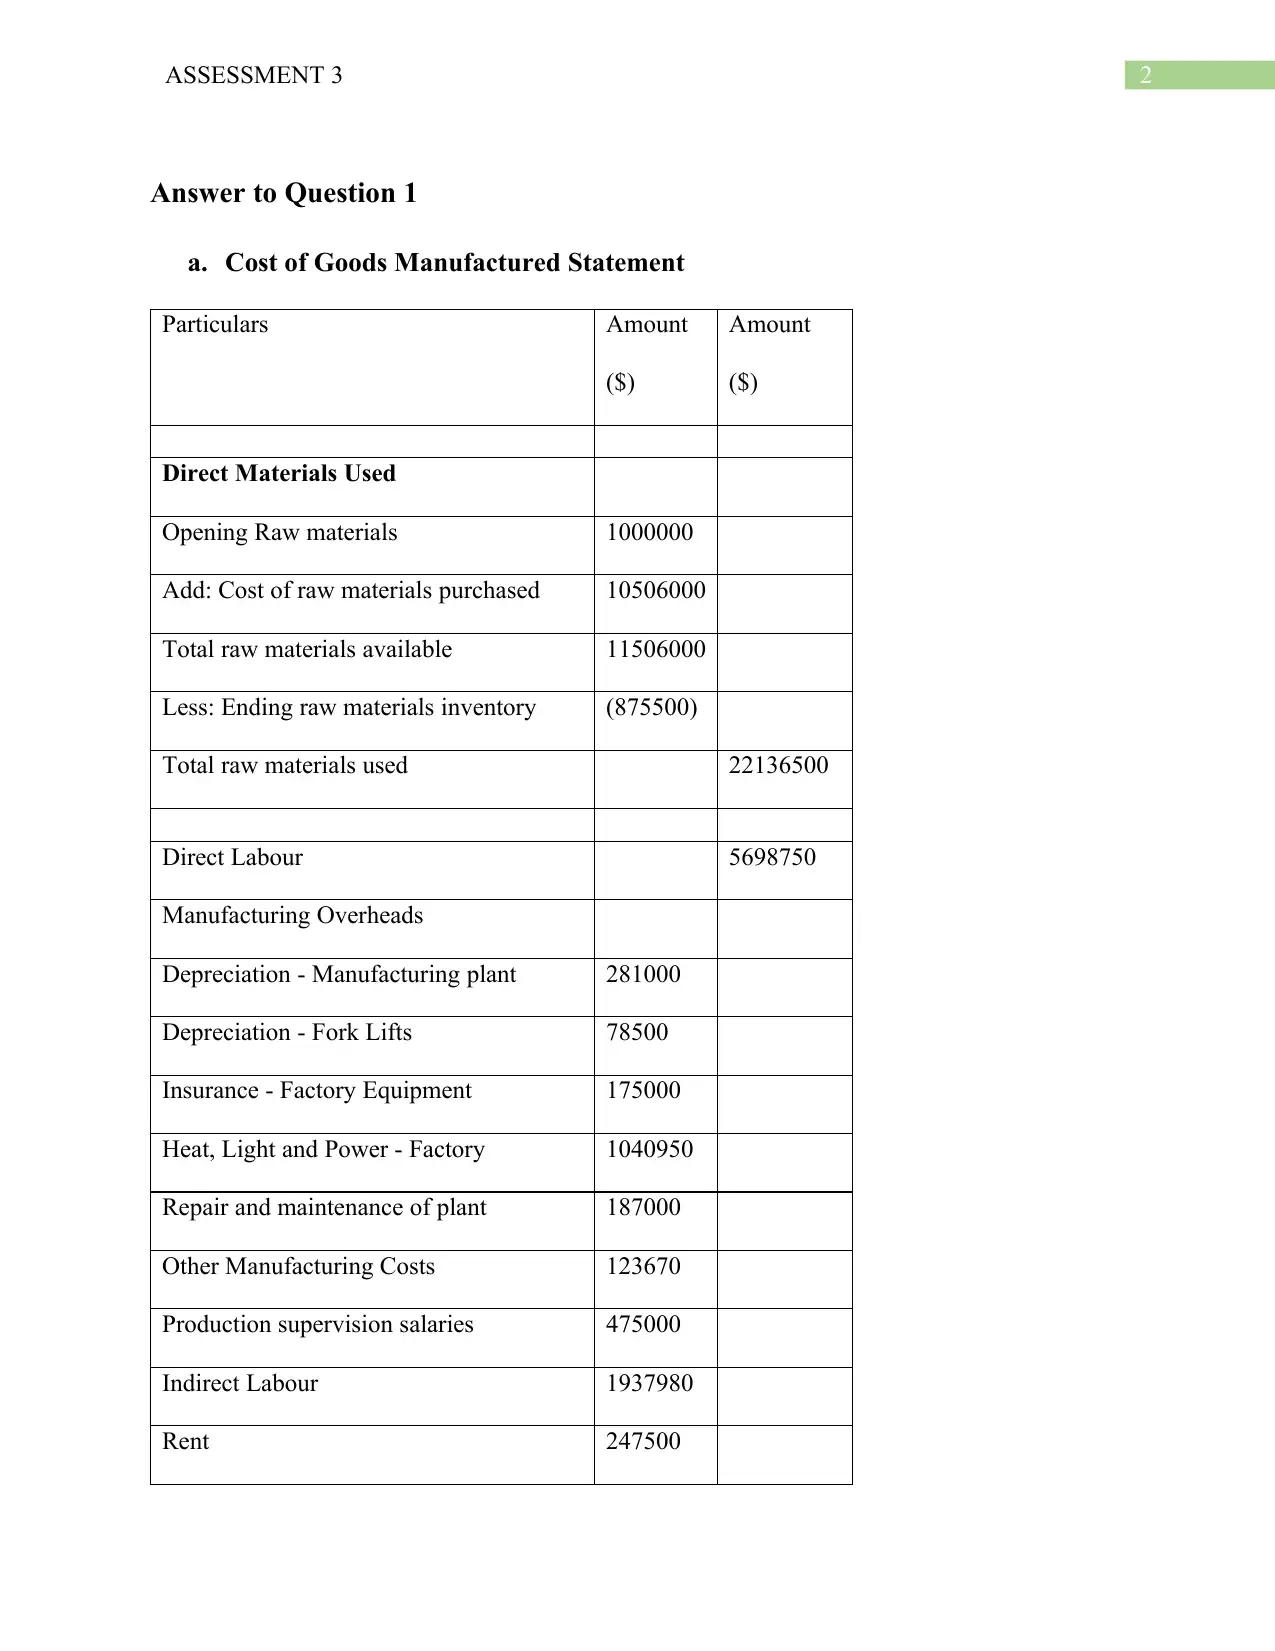
Answer to Question 1
a. Cost of Goods Manufactured Statement
Particulars Amount
($)
Amount
($)
Direct Materials Used
Opening Raw materials 1000000
Add: Cost of raw materials purchased 10506000
Total raw materials available 11506000
Less: Ending raw materials inventory (875500)
Total raw materials used 22136500
Direct Labour 5698750
Manufacturing Overheads
Depreciation - Manufacturing plant 281000
Depreciation - Fork Lifts 78500
Insurance - Factory Equipment 175000
Heat, Light and Power - Factory 1040950
Repair and maintenance of plant 187000
Other Manufacturing Costs 123670
Production supervision salaries 475000
Indirect Labour 1937980
Rent 247500
⊘ This is a preview!⊘
Do you want full access?
Subscribe today to unlock all pages.
Trusted by 1+ million students worldwide
3ASSESSMENT 3
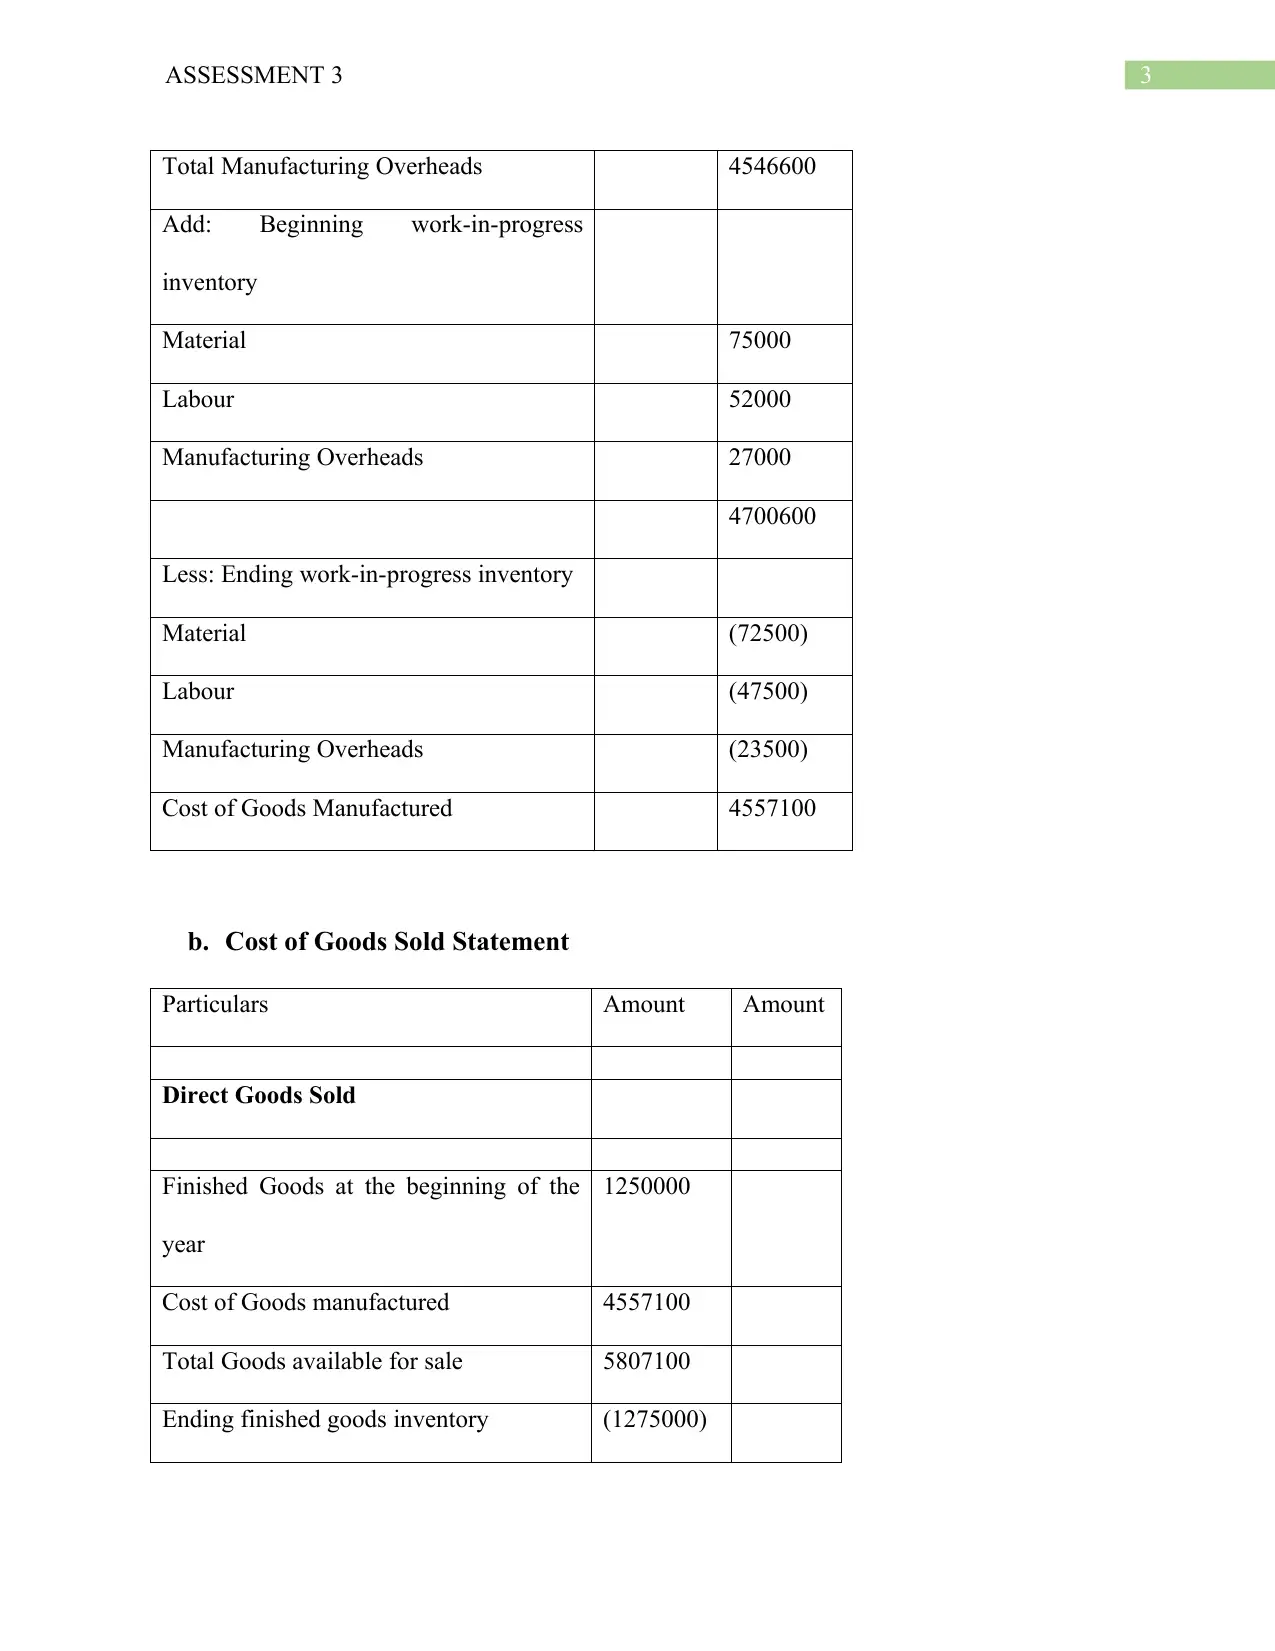
Total Manufacturing Overheads 4546600
Add: Beginning work-in-progress
inventory
Material 75000
Labour 52000
Manufacturing Overheads 27000
4700600
Less: Ending work-in-progress inventory
Material (72500)
Labour (47500)
Manufacturing Overheads (23500)
Cost of Goods Manufactured 4557100
b. Cost of Goods Sold Statement
Particulars Amount Amount
Direct Goods Sold
Finished Goods at the beginning of the
year
1250000
Cost of Goods manufactured 4557100
Total Goods available for sale 5807100
Ending finished goods inventory (1275000)
Paraphrase This Document
Need a fresh take? Get an instant paraphrase of this document with our AI Paraphraser
4ASSESSMENT 3
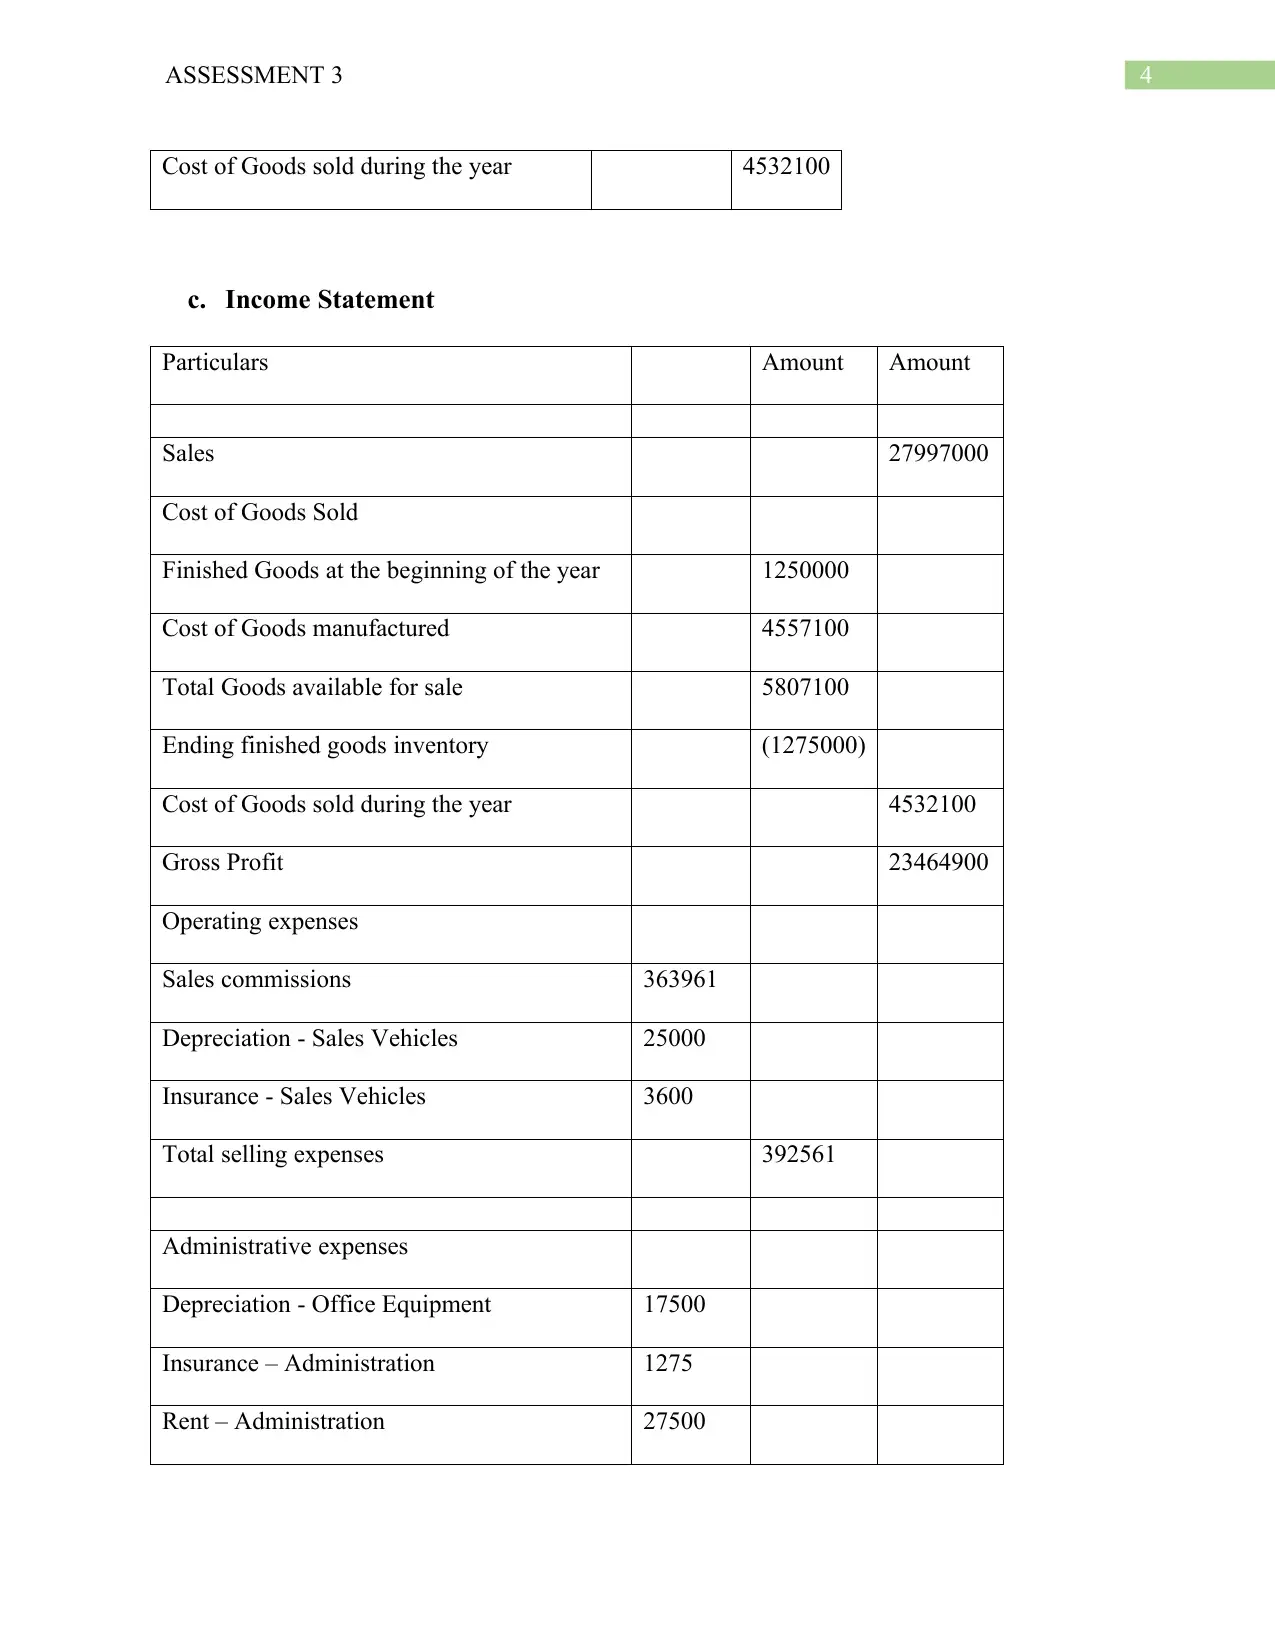
Cost of Goods sold during the year 4532100
c. Income Statement
Particulars Amount Amount
Sales 27997000
Cost of Goods Sold
Finished Goods at the beginning of the year 1250000
Cost of Goods manufactured 4557100
Total Goods available for sale 5807100
Ending finished goods inventory (1275000)
Cost of Goods sold during the year 4532100
Gross Profit 23464900
Operating expenses
Sales commissions 363961
Depreciation - Sales Vehicles 25000
Insurance - Sales Vehicles 3600
Total selling expenses 392561
Administrative expenses
Depreciation - Office Equipment 17500
Insurance – Administration 1275
Rent – Administration 27500
Cost of Goods sold during the year 4532100
c. Income Statement
Particulars Amount Amount
Sales 27997000
Cost of Goods Sold
Finished Goods at the beginning of the year 1250000
Cost of Goods manufactured 4557100
Total Goods available for sale 5807100
Ending finished goods inventory (1275000)
Cost of Goods sold during the year 4532100
Gross Profit 23464900
Operating expenses
Sales commissions 363961
Depreciation - Sales Vehicles 25000
Insurance - Sales Vehicles 3600
Total selling expenses 392561
Administrative expenses
Depreciation - Office Equipment 17500
Insurance – Administration 1275
Rent – Administration 27500
5ASSESSMENT 3
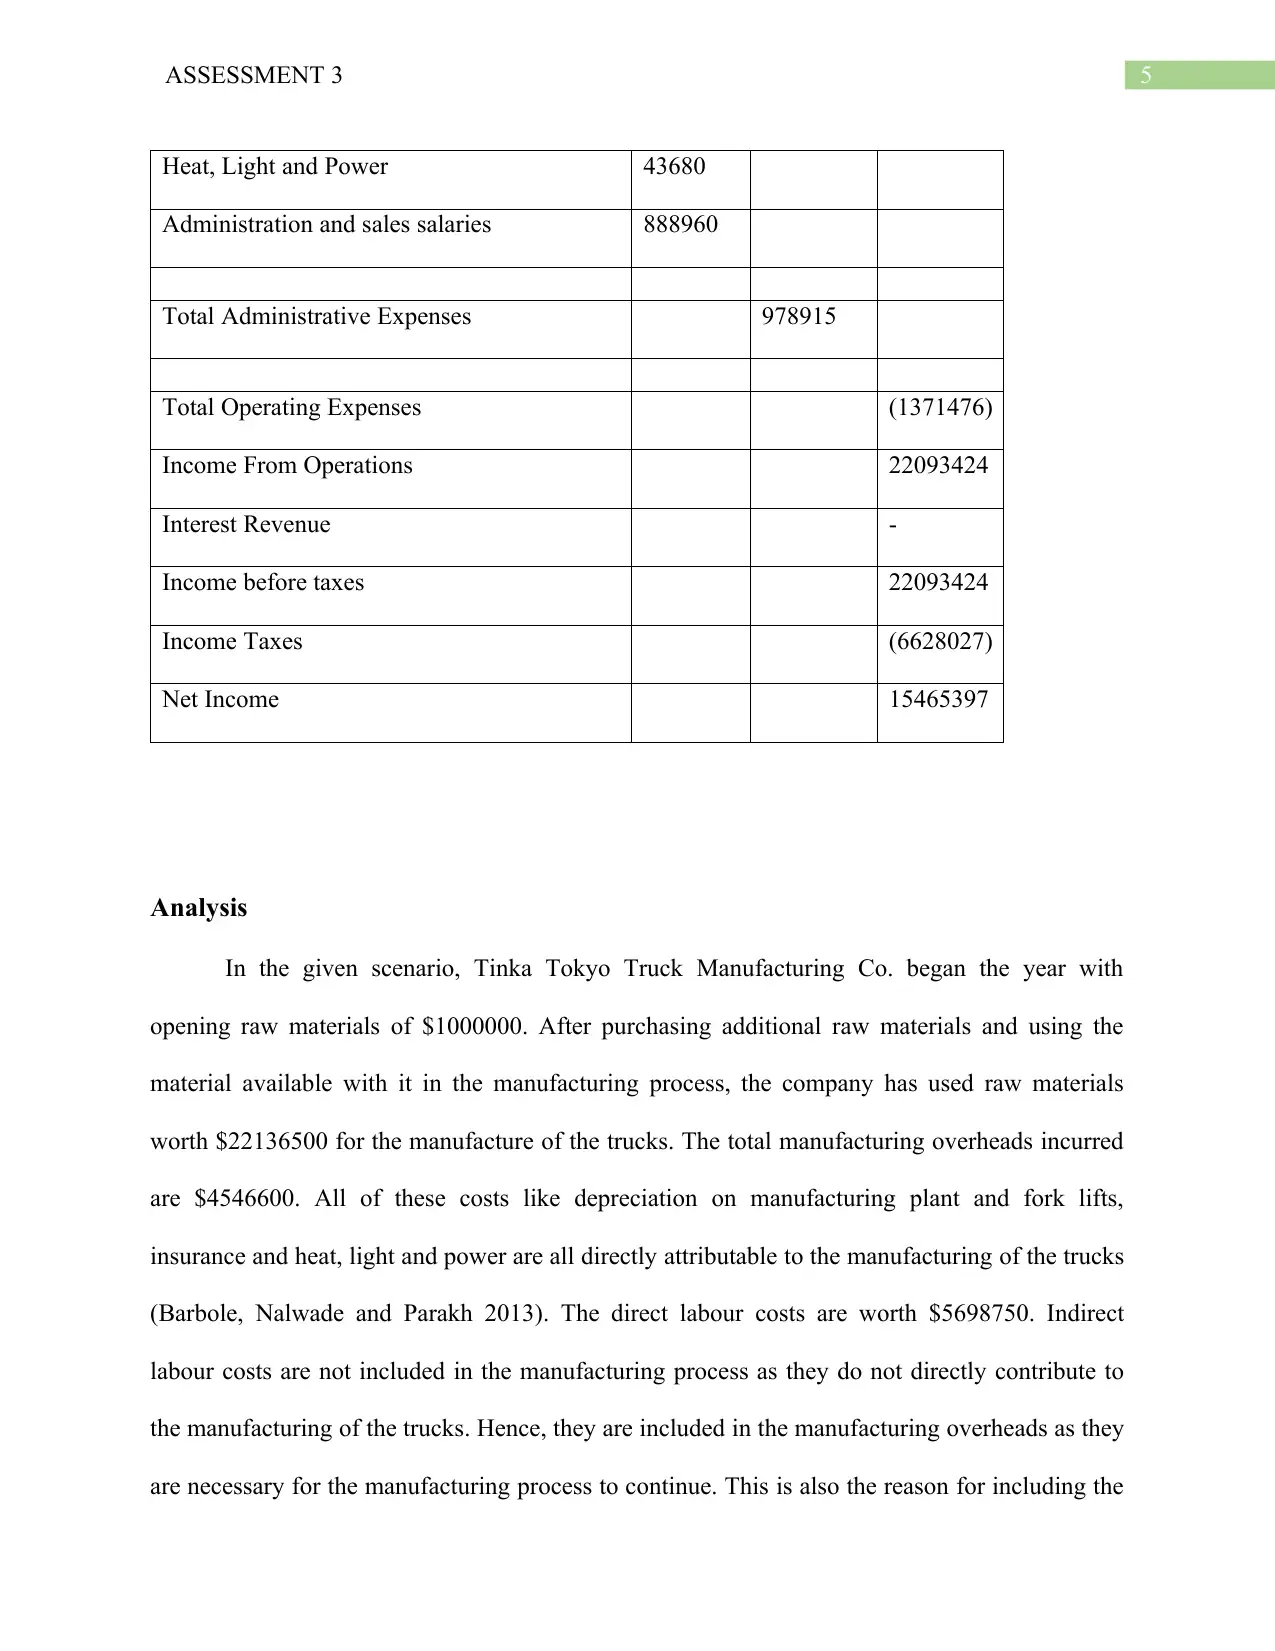
Heat, Light and Power 43680
Administration and sales salaries 888960
Total Administrative Expenses 978915
Total Operating Expenses (1371476)
Income From Operations 22093424
Interest Revenue -
Income before taxes 22093424
Income Taxes (6628027)
Net Income 15465397
Analysis
In the given scenario, Tinka Tokyo Truck Manufacturing Co. began the year with
opening raw materials of $1000000. After purchasing additional raw materials and using the
material available with it in the manufacturing process, the company has used raw materials
worth $22136500 for the manufacture of the trucks. The total manufacturing overheads incurred
are $4546600. All of these costs like depreciation on manufacturing plant and fork lifts,
insurance and heat, light and power are all directly attributable to the manufacturing of the trucks
(Barbole, Nalwade and Parakh 2013). The direct labour costs are worth $5698750. Indirect
labour costs are not included in the manufacturing process as they do not directly contribute to
the manufacturing of the trucks. Hence, they are included in the manufacturing overheads as they
are necessary for the manufacturing process to continue. This is also the reason for including the
⊘ This is a preview!⊘
Do you want full access?
Subscribe today to unlock all pages.
Trusted by 1+ million students worldwide
6ASSESSMENT 3
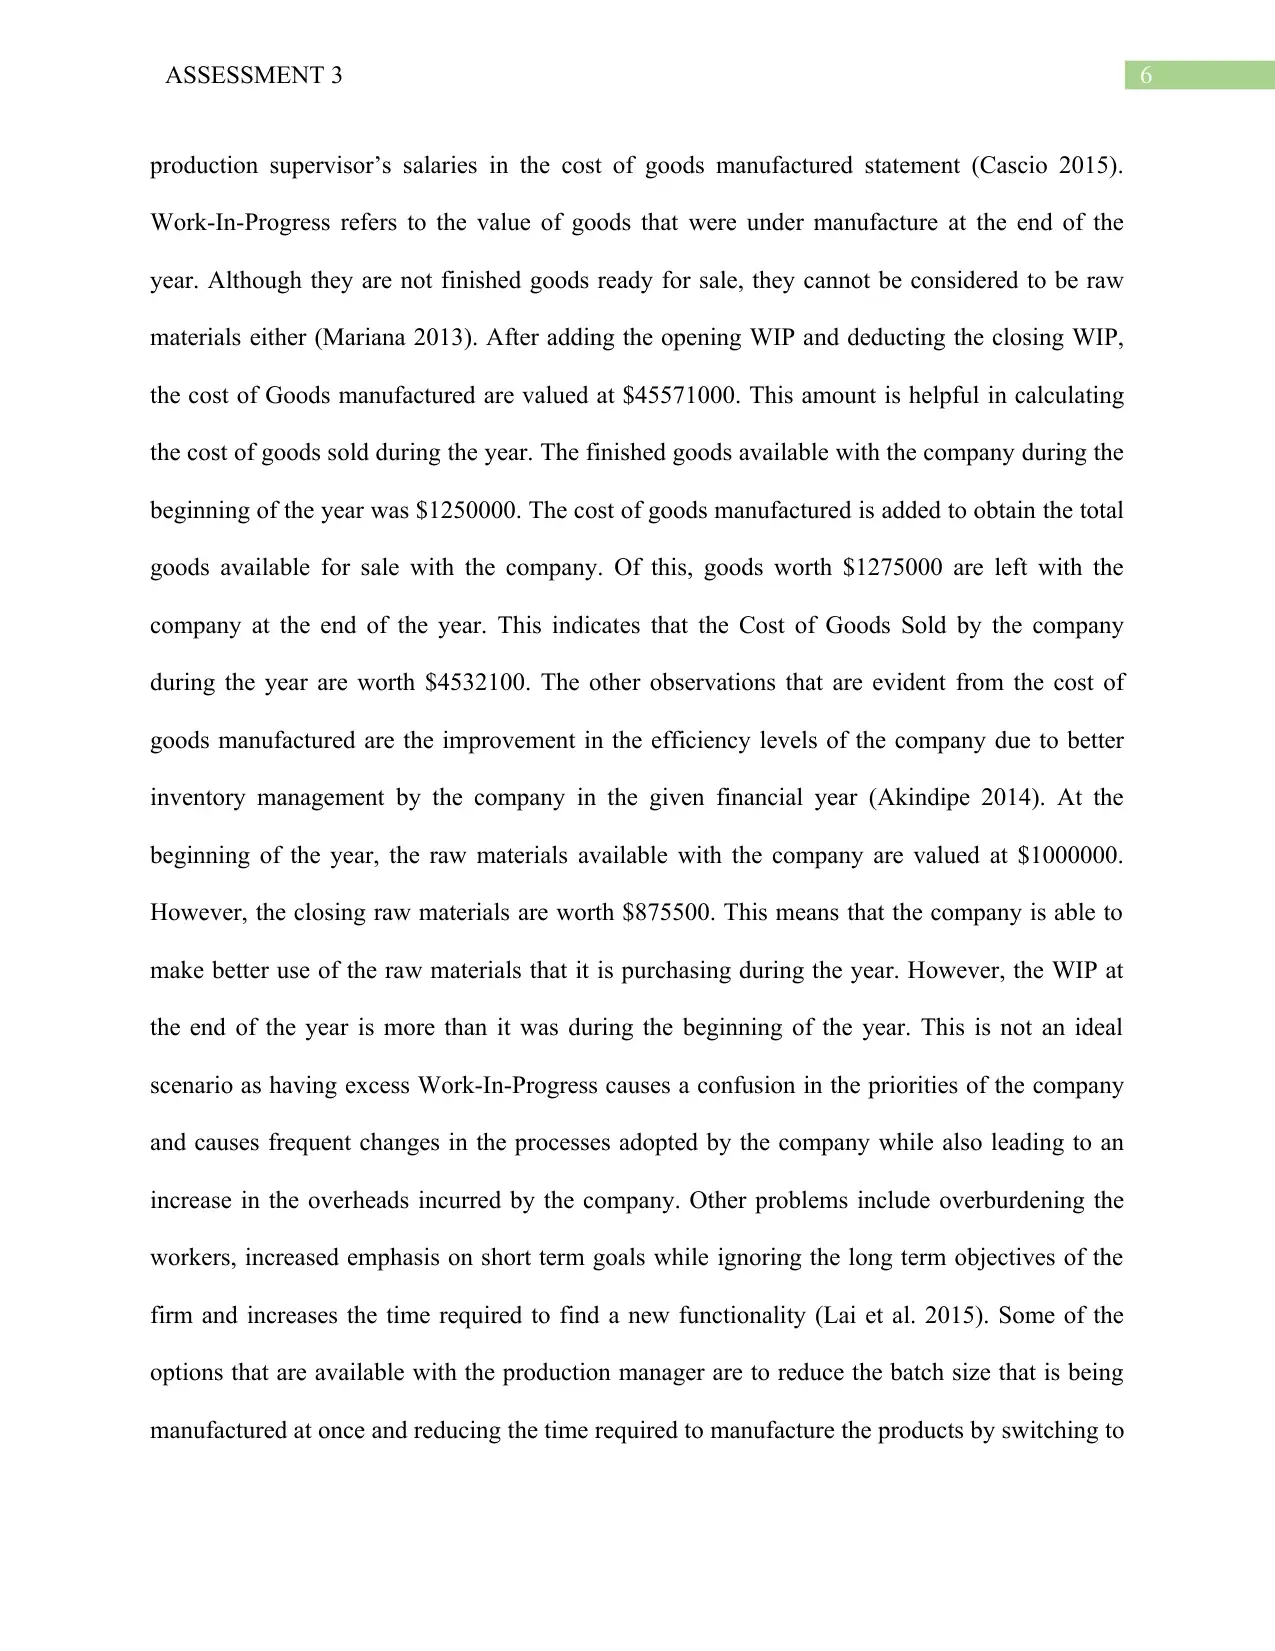
production supervisor’s salaries in the cost of goods manufactured statement (Cascio 2015).
Work-In-Progress refers to the value of goods that were under manufacture at the end of the
year. Although they are not finished goods ready for sale, they cannot be considered to be raw
materials either (Mariana 2013). After adding the opening WIP and deducting the closing WIP,
the cost of Goods manufactured are valued at $45571000. This amount is helpful in calculating
the cost of goods sold during the year. The finished goods available with the company during the
beginning of the year was $1250000. The cost of goods manufactured is added to obtain the total
goods available for sale with the company. Of this, goods worth $1275000 are left with the
company at the end of the year. This indicates that the Cost of Goods Sold by the company
during the year are worth $4532100. The other observations that are evident from the cost of
goods manufactured are the improvement in the efficiency levels of the company due to better
inventory management by the company in the given financial year (Akindipe 2014). At the
beginning of the year, the raw materials available with the company are valued at $1000000.
However, the closing raw materials are worth $875500. This means that the company is able to
make better use of the raw materials that it is purchasing during the year. However, the WIP at
the end of the year is more than it was during the beginning of the year. This is not an ideal
scenario as having excess Work-In-Progress causes a confusion in the priorities of the company
and causes frequent changes in the processes adopted by the company while also leading to an
increase in the overheads incurred by the company. Other problems include overburdening the
workers, increased emphasis on short term goals while ignoring the long term objectives of the
firm and increases the time required to find a new functionality (Lai et al. 2015). Some of the
options that are available with the production manager are to reduce the batch size that is being
manufactured at once and reducing the time required to manufacture the products by switching to
Paraphrase This Document
Need a fresh take? Get an instant paraphrase of this document with our AI Paraphraser
7ASSESSMENT 3
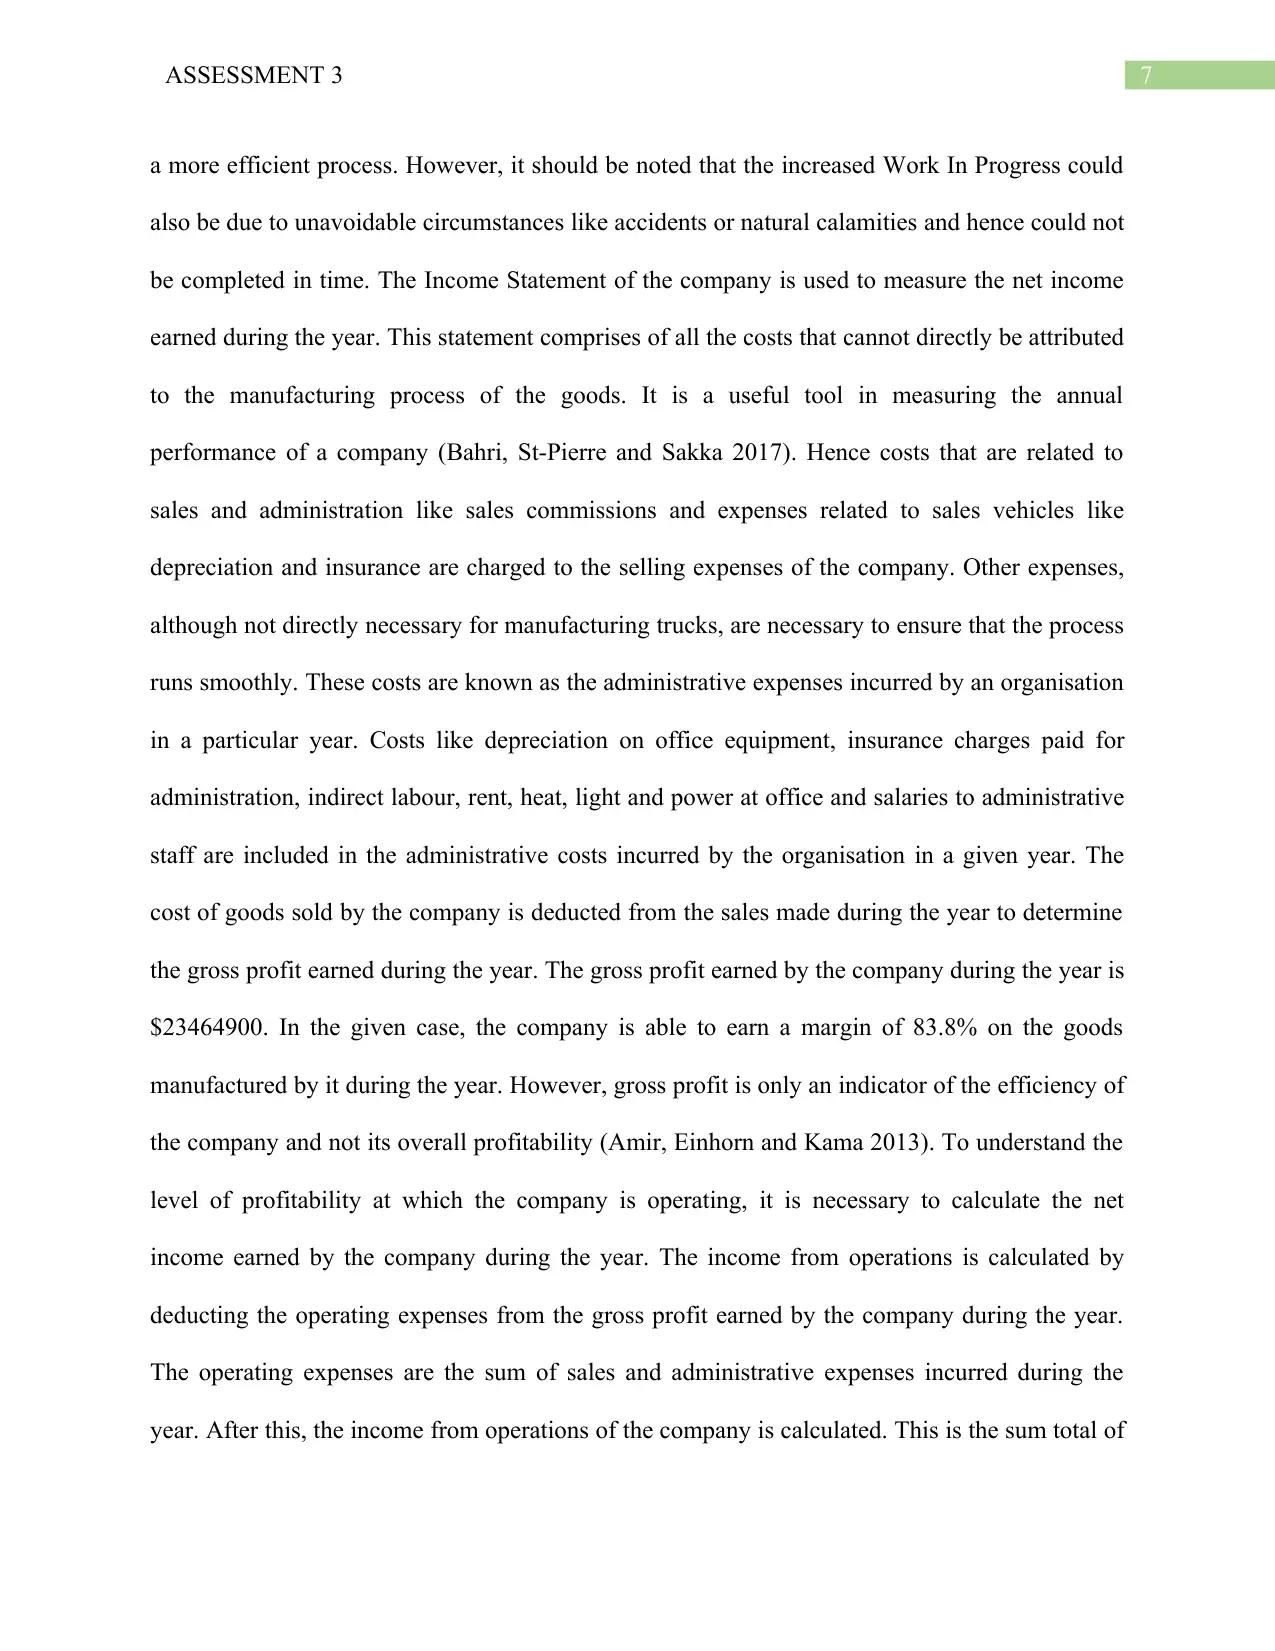
a more efficient process. However, it should be noted that the increased Work In Progress could
also be due to unavoidable circumstances like accidents or natural calamities and hence could not
be completed in time. The Income Statement of the company is used to measure the net income
earned during the year. This statement comprises of all the costs that cannot directly be attributed
to the manufacturing process of the goods. It is a useful tool in measuring the annual
performance of a company (Bahri, St-Pierre and Sakka 2017). Hence costs that are related to
sales and administration like sales commissions and expenses related to sales vehicles like
depreciation and insurance are charged to the selling expenses of the company. Other expenses,
although not directly necessary for manufacturing trucks, are necessary to ensure that the process
runs smoothly. These costs are known as the administrative expenses incurred by an organisation
in a particular year. Costs like depreciation on office equipment, insurance charges paid for
administration, indirect labour, rent, heat, light and power at office and salaries to administrative
staff are included in the administrative costs incurred by the organisation in a given year. The
cost of goods sold by the company is deducted from the sales made during the year to determine
the gross profit earned during the year. The gross profit earned by the company during the year is
$23464900. In the given case, the company is able to earn a margin of 83.8% on the goods
manufactured by it during the year. However, gross profit is only an indicator of the efficiency of
the company and not its overall profitability (Amir, Einhorn and Kama 2013). To understand the
level of profitability at which the company is operating, it is necessary to calculate the net
income earned by the company during the year. The income from operations is calculated by
deducting the operating expenses from the gross profit earned by the company during the year.
The operating expenses are the sum of sales and administrative expenses incurred during the
year. After this, the income from operations of the company is calculated. This is the sum total of
8ASSESSMENT 3
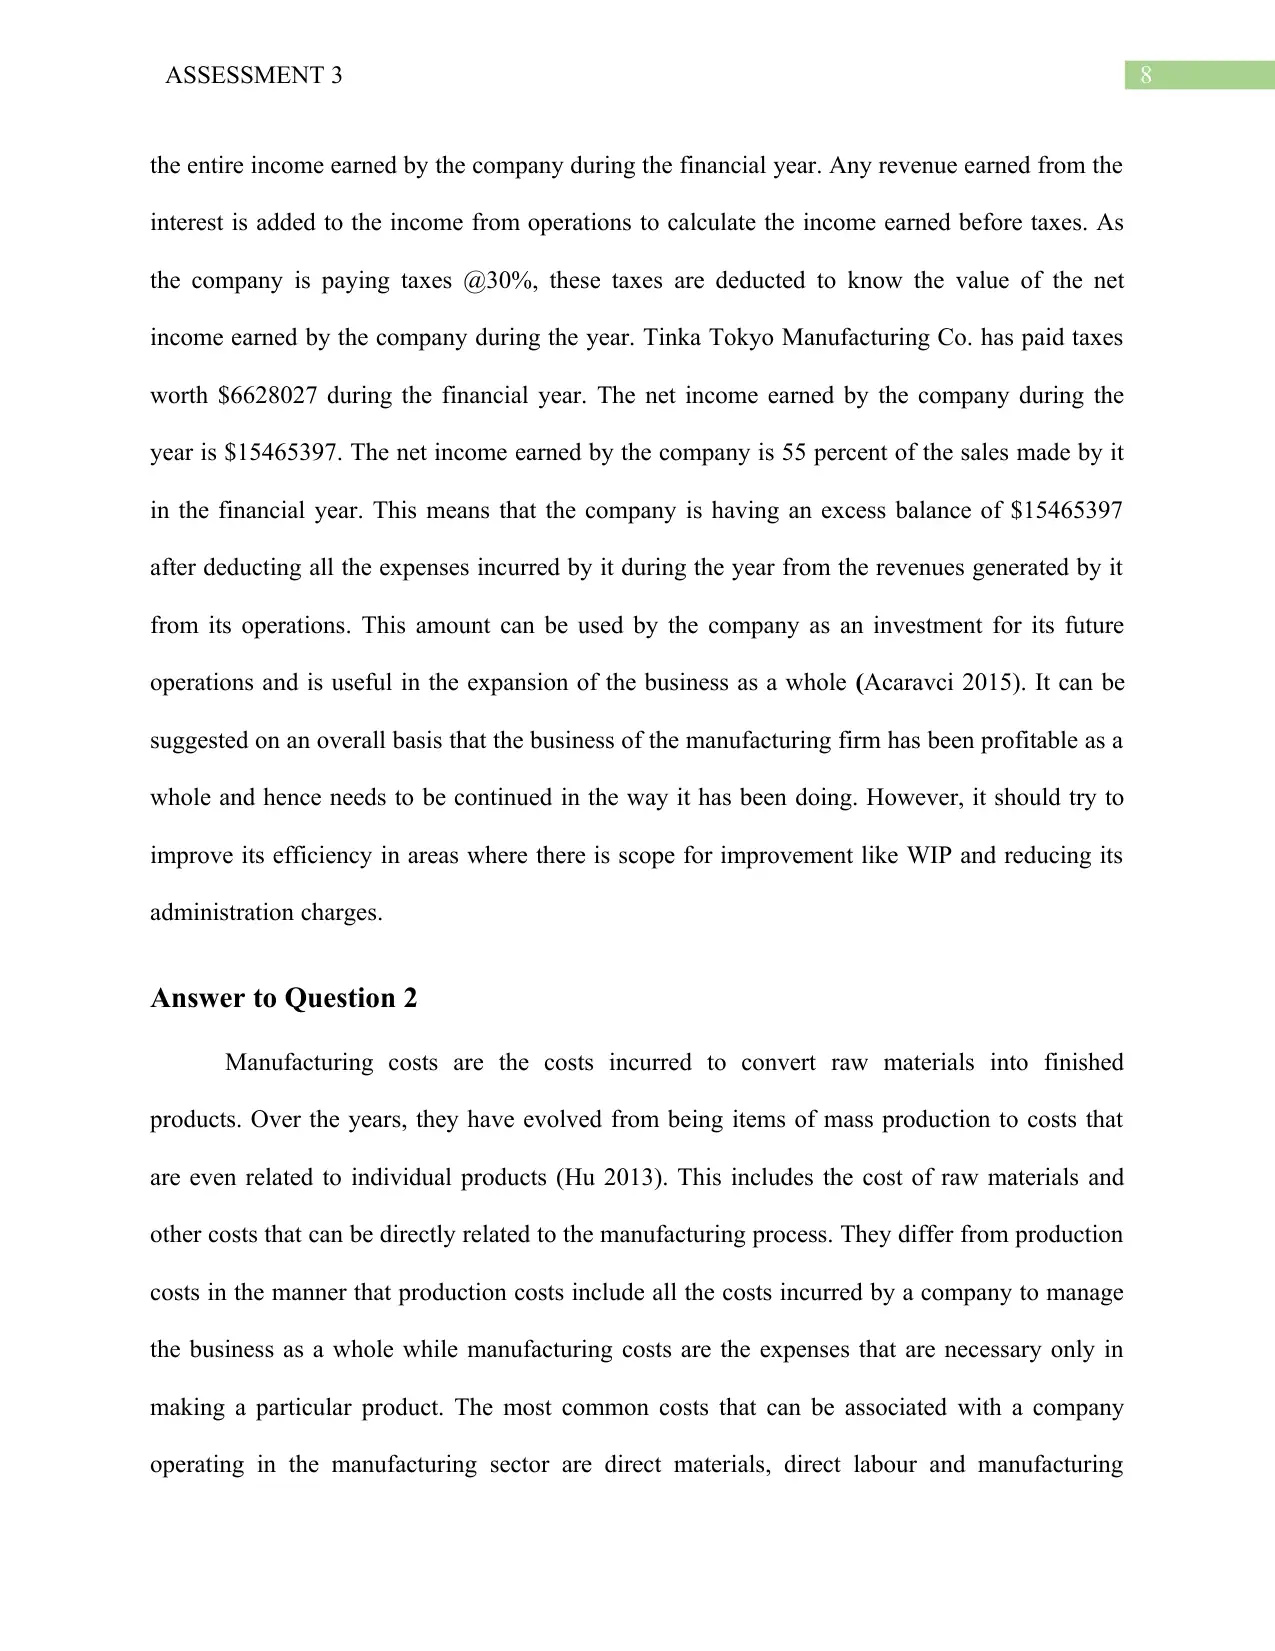
the entire income earned by the company during the financial year. Any revenue earned from the
interest is added to the income from operations to calculate the income earned before taxes. As
the company is paying taxes @30%, these taxes are deducted to know the value of the net
income earned by the company during the year. Tinka Tokyo Manufacturing Co. has paid taxes
worth $6628027 during the financial year. The net income earned by the company during the
year is $15465397. The net income earned by the company is 55 percent of the sales made by it
in the financial year. This means that the company is having an excess balance of $15465397
after deducting all the expenses incurred by it during the year from the revenues generated by it
from its operations. This amount can be used by the company as an investment for its future
operations and is useful in the expansion of the business as a whole (Acaravci 2015). It can be
suggested on an overall basis that the business of the manufacturing firm has been profitable as a
whole and hence needs to be continued in the way it has been doing. However, it should try to
improve its efficiency in areas where there is scope for improvement like WIP and reducing its
administration charges.
Answer to Question 2
Manufacturing costs are the costs incurred to convert raw materials into finished
products. Over the years, they have evolved from being items of mass production to costs that
are even related to individual products (Hu 2013). This includes the cost of raw materials and
other costs that can be directly related to the manufacturing process. They differ from production
costs in the manner that production costs include all the costs incurred by a company to manage
the business as a whole while manufacturing costs are the expenses that are necessary only in
making a particular product. The most common costs that can be associated with a company
operating in the manufacturing sector are direct materials, direct labour and manufacturing
⊘ This is a preview!⊘
Do you want full access?
Subscribe today to unlock all pages.
Trusted by 1+ million students worldwide
9ASSESSMENT 3
overheads (Chryssolouris 2013). In calculating the cost of goods manufactured in a year, it is
important to differentiate between the direct and indirect costs. This is to be able to easily
differentiate between the costs that need to be reduced to produce a particular product at a lesser
cost. Direct material costs are the costs of raw materials that can be directly identified in the final
product. For example, cost of iron required to manufacture a crane. Indirect materials involve
those items that cannot be directly identified in a product but are necessary to bring the material
to a usable state. Various functions are applied to the direct materials like welding, cutting and
bending that are not directly traceable in a product but are necessary (Henri, Boiral and Roy
2016). These costs come under the indirect material required for production. Direct labour is the
amount of wages or other monetary benefits earned by individuals who directly contribute to the
manufacturing process. This includes individuals who are physically involved in the production
like manual labour or contract labour who are responsible for ensuring that the manufacturing is
taking place in a proper manner. Indirect labour consists of people responsible for carrying the
goods from the place of purchase to the factory, material handling labourers and supervisors that
are responsible for bringing a product to its finished state (Cushen and Thompson 2016).
Manufacturing overheads includes the costs that cannot be attributed to both material and labour
costs but are necessary for the production process to take place. These costs include depreciation
and repairs and maintenance of plant and equipment, insurance paid for factory premises,
salaries to supervisors and production heads who take care of the production process as a whole.
Other costs include heat, lighting and power in factory and rent paid for the factory or machinery
being used in the manufacture of the final products. Indirect labour costs, like costs associated
with workers that are involved in the supervision of the production process and handling of
materials are also included in the manufacturing overheads (Oluwagbemiga, Olugbenga and
Paraphrase This Document
Need a fresh take? Get an instant paraphrase of this document with our AI Paraphraser
10ASSESSMENT 3
Zaccheaus 2014). Indirect materials that cannot directly be traced in the materials manufactured
during the year like diesel, grease and coal in machinery are charged under the manufacturing
overheads.
Capacity refers to the amount of goods that can be manufactured by a company in a given
financial year by taking all the constraints like availability of space, labour, materials and access
to capital into consideration. Theoretical capacity of a manufacturer refers to the amount of
production that can be achieved in a given year if all the machinery and labour that are being
used in the production process performed at their optimal capacity on a continuous basis
throughout the duration of the production process (DRURY 2013). Theoretical capacity is also
known as the ideal capacity. Practical capacity refers to the amount of goods that a company or
manufacturer can produce in a given year by taking the availability of materials, labour hours
and machine hours into consideration. This is always less than or equal to the ideal capacity. In
case of manufacturing concerns, the practical or ideal capacity are calculated using different
units of measurement like machine hours, number of units of a product etc. Differences in
practical and theoretical capacity occur due to a number of reasons (Schröter et al. 2014). They
include repairs and maintenance related to the machinery, shutdown of the plant on account of
holidays, wrong estimation of the theoretical capacity by the accountants, and other factors
responsible for causing downtime. In cases where practical capacity differs from theoretical
capacity due to wrong estimations, there is a need to review the policies followed by the
accountant. The review conducted by them include a review of the annual machine hours for
which a machinery can be used for production and the expected level of production that can be
achieved by the company in the future. In order to determine an effective system of
manufacturing in a company, there are various techniques. Some of them include Quality Circle,
11ASSESSMENT 3
Kanban system and 5S housekeeping. One of the modern techniques that is used to reduce
wastage and improve the practical capacity of an organisation is lean manufacturing (Rahman,
Sharif and Esa 2013). These are a set of tools that help in the reduction of wastage and improve
the quality and price of the product. Some of the recent researches show that the phenomenon of
sticky costs is due to the deliberate management decision making while also considering
adjustment costs. However, it has been found that these costs show a much more asymmetric
behaviour and cannot be attributed directly to the capacity of the organisation (Banker et al.
2014). Hence, there is a requirement of new methods that take the uncertain nature of business
costs into account and should be useful in the estimation of future capacity in an accurate
manner. In conclusion, it can be said that in the modern day business organisations, allocating
the manufacturing costs has become increasingly complex there is a need for an updated method
that measures these costs appropriately. Apart from that, it should also be able to allocate them in
a proper way to determine the capacity of an organisation in a more reliable manner.
⊘ This is a preview!⊘
Do you want full access?
Subscribe today to unlock all pages.
Trusted by 1+ million students worldwide
1 out of 16
Related Documents


Your All-in-One AI-Powered Toolkit for Academic Success.
+13062052269
info@desklib.com
Available 24*7 on WhatsApp / Email
![[object Object]](/_next/static/media/star-bottom.7253800d.svg)
Unlock your academic potential
Copyright © 2020–2026 A2Z Services. All Rights Reserved. Developed and managed by ZUCOL.