University Biodiversity Report: Butterfly Assessment in Monks Wood
VerifiedAdded on 2020/04/15
|16
|3713
|53
Report
AI Summary
This report presents an assessment of butterfly biodiversity in Monks Wood spanning 40 years. It examines the total number of individuals, species, species diversity, and species evenness, utilizing the Shannon Weaver Index and PAST software for data analysis. The study investigates time-related patterns and the influence of the North Atlantic Oscillation (NAO) on butterfly populations. The findings reveal the presence of 32 butterfly species, with variations in population sizes over the years, potentially linked to NAO indices. The report compares diversity metrics between 1976 and 2016, highlighting changes in species diversity and evenness. It discusses the impact of environmental factors, such as weather patterns and pollution, on butterfly life cycles and diversity, providing a comprehensive overview of the long-term trends in butterfly populations within the Monks Wood nature reserve.

Running head: BIODIVERSITY
Assessment of Butterfly biodiversity in Monks Wood
Name of the Student:
Name of the University:
Author Note:
Assessment of Butterfly biodiversity in Monks Wood
Name of the Student:
Name of the University:
Author Note:
Paraphrase This Document
Need a fresh take? Get an instant paraphrase of this document with our AI Paraphraser
1BIODIVERSITY
Executive Summary
The report is based on the assessment of the butterfly biodiversity in Monks Wood over the
course of 40 years. The analysis involves calculation of the total number of individuals,
species, species diversity and species evenness. The other objective includes whether the
time related patterns are detectable within the concerned data. The data accumulated is
analyzed using a statistical package called PAleontological STatistics (PAST). The
findings suggest that North Atlantic Oscillation (NAO), both the positive and negative
index played a key role in butterfly biodiversity.
2BIODIVERSITY
Table of Contents
Introduction............................................................................................................................3
Materials and Methods...........................................................................................................4
Results....................................................................................................................................5
Discussion............................................................................................................................10
Conclusion............................................................................................................................12
Reference..............................................................................................................................14
⊘ This is a preview!⊘
Do you want full access?
Subscribe today to unlock all pages.
Trusted by 1+ million students worldwide
3BIODIVERSITY
Introduction
Biodiversity is defined as diversity of the living organisms in marine, terrestrial and
aquatic ecosystems and the ecological complexities of living organisms are part of; this
involves the diversity within the species, among the species in an ecosystem. Biodiversity
or biological diversity is an extended term which can be further divided into three different
types. The types are species diversity, genetic diversity and ecological diversity (Mace,
Norris and Fitter 2012). Species diversity can be explained as the different types of species
that occupy a region. In order to measure the species diversity, species richness which
quantifies the different species, and species evenness is the total number of individuals
within the species population. Genetic diversity is the diversity in the genetic composition
of the species in a population. A diversity exists among the species but a larger extent of
diversity exists within the individuals of a certain species. Ecological diversity is a
diversity that exists in a location or an ecosystem. The importance of biodiversity lies in
the fact that it enhances the ecosystem productivity. In biodiversity, biological organisms
no matter how small it is, contribute to the environment. For example, a greater variety of
crop species means a larger variety of crops, ecosystems that are healthy are competent
enough to cope with the natural disasters. Like the humans that dominate this planet also
needs the to maintain the wildlife to sustain the ecological balance. The factors that affect
the biodiversity include overexploitation, habitat loss, invasive species, climate change
(Cardinale et al. 2012). Overexploitation is the over usage of species without providing the
time period to replenish themselves. Habitat loss is considered as the loss of habitat of the
animals due to continuous deforestation. Invasive species are the plants and the animals
that increase in number due to unhindered competition from the other species. Climate
change is the global or local changes in the climatic phenomenon that hampers and hinders
the natural ecosystem. There are several evidence where the human activities have resulted
in biodiversity loss, such as the overexploitation of the and over usage of the fossil fuel
which has resulted in the rise of pollution. Due to the rise in pollution the global
temperature has increased which again has increased the incidences of major diseases,
global rise in sea level and the rise in storms and landslides (Intergovernmental Panel on
Climate Change 2014). The merit of producing the wild life sanctuaries within the large
urban developments include the benefit of providing a reclamation of the habitat of several
Paraphrase This Document
Need a fresh take? Get an instant paraphrase of this document with our AI Paraphraser
4BIODIVERSITY
endangered animals that were on the verge of getting extinct. Due to continuous
deforestation, a large number of wildlife animals got affected, thus having wild life
sanctuaries within an urban setup will act as a buffer region delivering the ecosystem
services (Ghimire 2013). Even a wild life sanctuary within an urban development adds an
aesthetic appeal to the urban scenario. The aim of this report is to assess the butterfly
biodiversity in Monks Wood over the course of 40 years. The analysis involves calculation
of the total number of individuals, species, species diversity and species evenness. The
other objective includes whether the time related patterns are detectable within the
concerned data. The data accumulated is analyzed using a statistical package called
PAleontological STatistics (PAST).
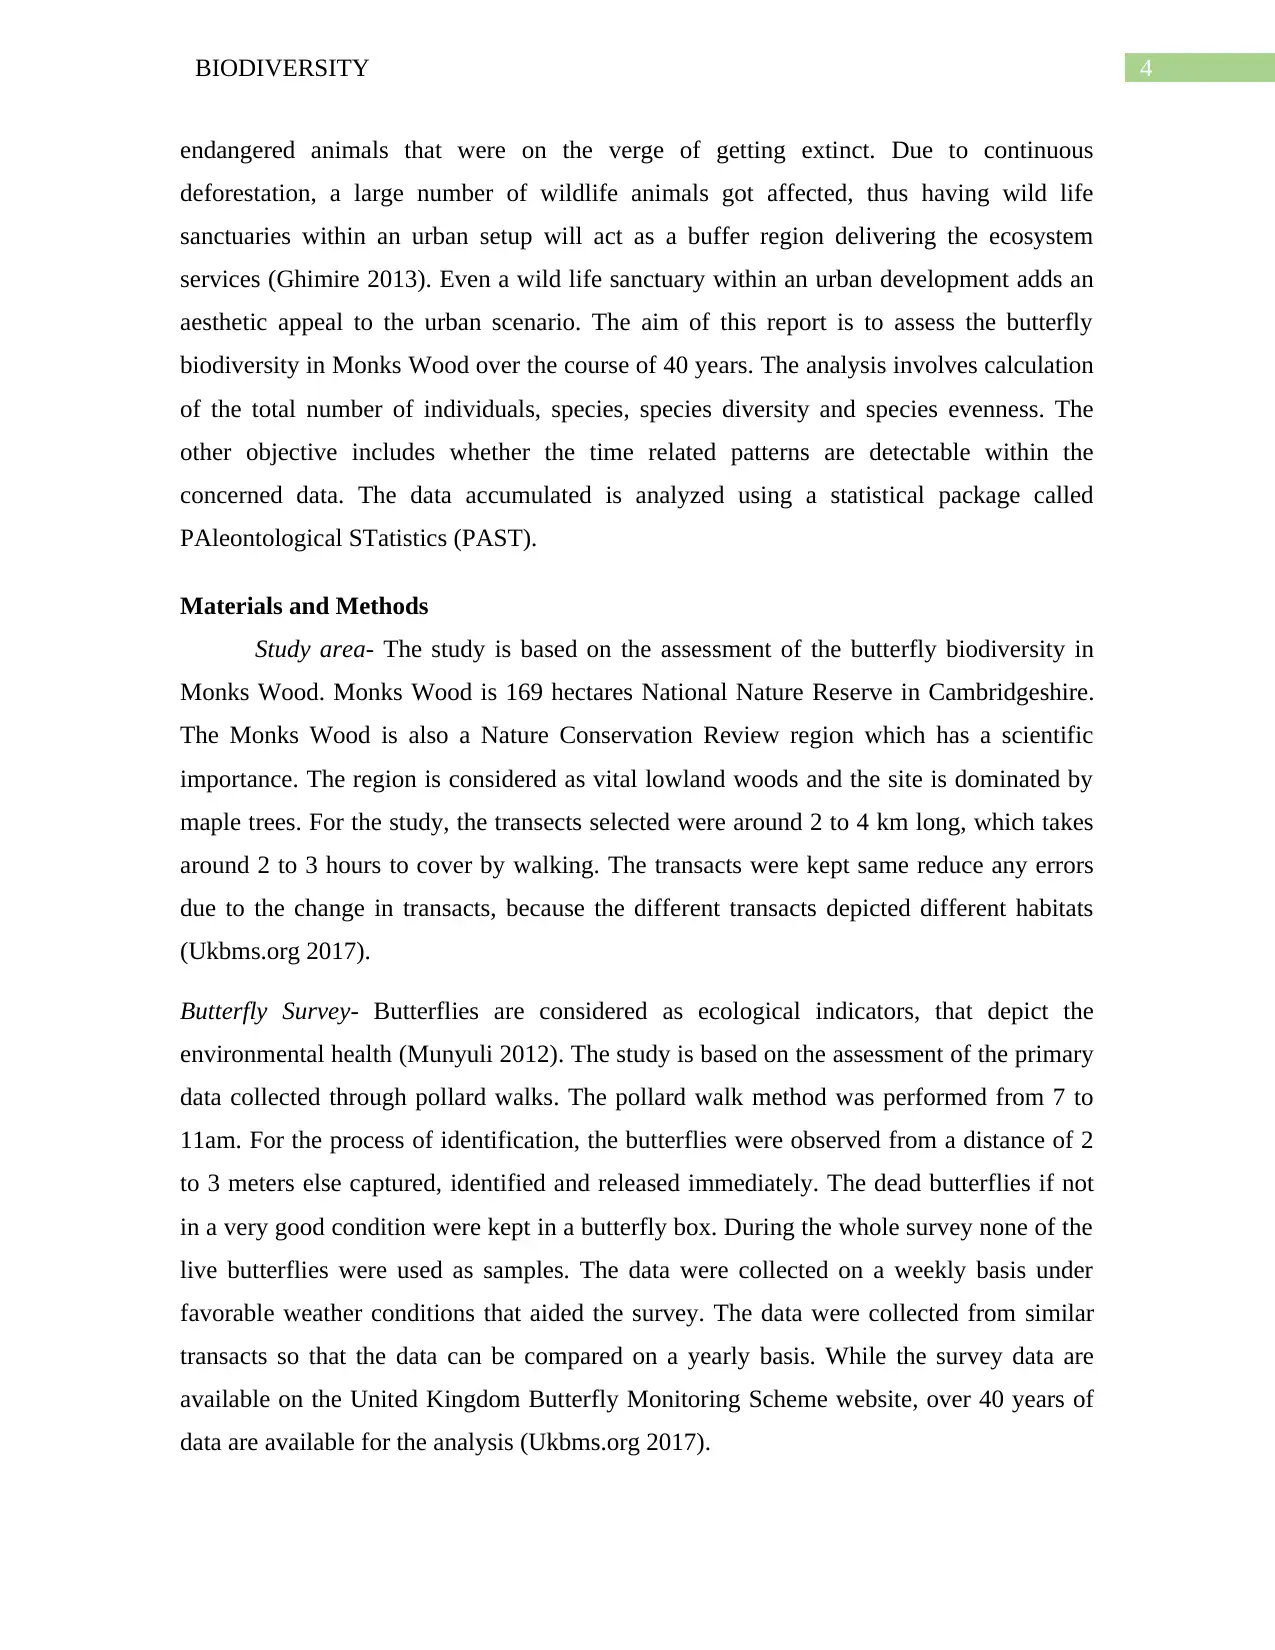
Materials and Methods
Study area- The study is based on the assessment of the butterfly biodiversity in
Monks Wood. Monks Wood is 169 hectares National Nature Reserve in Cambridgeshire.
The Monks Wood is also a Nature Conservation Review region which has a scientific
importance. The region is considered as vital lowland woods and the site is dominated by
maple trees. For the study, the transects selected were around 2 to 4 km long, which takes
around 2 to 3 hours to cover by walking. The transacts were kept same reduce any errors
due to the change in transacts, because the different transacts depicted different habitats
(Ukbms.org 2017).
Butterfly Survey- Butterflies are considered as ecological indicators, that depict the
environmental health (Munyuli 2012). The study is based on the assessment of the primary
data collected through pollard walks. The pollard walk method was performed from 7 to
11am. For the process of identification, the butterflies were observed from a distance of 2
to 3 meters else captured, identified and released immediately. The dead butterflies if not
in a very good condition were kept in a butterfly box. During the whole survey none of the
live butterflies were used as samples. The data were collected on a weekly basis under
favorable weather conditions that aided the survey. The data were collected from similar
transacts so that the data can be compared on a yearly basis. While the survey data are
available on the United Kingdom Butterfly Monitoring Scheme website, over 40 years of
data are available for the analysis (Ukbms.org 2017).
endangered animals that were on the verge of getting extinct. Due to continuous
deforestation, a large number of wildlife animals got affected, thus having wild life
sanctuaries within an urban setup will act as a buffer region delivering the ecosystem
services (Ghimire 2013). Even a wild life sanctuary within an urban development adds an
aesthetic appeal to the urban scenario. The aim of this report is to assess the butterfly
biodiversity in Monks Wood over the course of 40 years. The analysis involves calculation
of the total number of individuals, species, species diversity and species evenness. The
other objective includes whether the time related patterns are detectable within the
concerned data. The data accumulated is analyzed using a statistical package called
PAleontological STatistics (PAST).
Materials and Methods
Study area- The study is based on the assessment of the butterfly biodiversity in
Monks Wood. Monks Wood is 169 hectares National Nature Reserve in Cambridgeshire.
The Monks Wood is also a Nature Conservation Review region which has a scientific
importance. The region is considered as vital lowland woods and the site is dominated by
maple trees. For the study, the transects selected were around 2 to 4 km long, which takes
around 2 to 3 hours to cover by walking. The transacts were kept same reduce any errors
due to the change in transacts, because the different transacts depicted different habitats
(Ukbms.org 2017).
Butterfly Survey- Butterflies are considered as ecological indicators, that depict the
environmental health (Munyuli 2012). The study is based on the assessment of the primary
data collected through pollard walks. The pollard walk method was performed from 7 to
11am. For the process of identification, the butterflies were observed from a distance of 2
to 3 meters else captured, identified and released immediately. The dead butterflies if not
in a very good condition were kept in a butterfly box. During the whole survey none of the
live butterflies were used as samples. The data were collected on a weekly basis under
favorable weather conditions that aided the survey. The data were collected from similar
transacts so that the data can be compared on a yearly basis. While the survey data are
available on the United Kingdom Butterfly Monitoring Scheme website, over 40 years of
data are available for the analysis (Ukbms.org 2017).
5BIODIVERSITY
Shannon weaver Index- Shannon Weaver Index is mathematical index which helps to
calculate the species diversity in a community. This index provides a method to quantify
the composition of species in a community through the simple assessment of species
richness and species evenness. It combines both the species richness and the species
evenness in to single index: D = -Σ pi ln pi (Arias-González et al. 2012)
where, i denotes the number of species present in the sample.
pi = ni/N
(ni) is the total number of species in a single species.
N denotes the total number of individuals in the entire sample.
ln is the natural logarithm.
This means that the proportion pi of each species is multiplied by the natural logarithm of
the same value of pi, then addition of all the values in each species and final value is
multiplied by -1.
Species evenness- species evenness depicts closeness of the number of individuals in each
species. It is denoted by E = eD/s (Maestre et al. 2012)
Where, e is a constant with a value of 2.7
D is the value of Shannon weaver index
s is the number of species in a sample.
PAleontological STatistics (PAST)- According to Uv.es (2017), PAST helps in scientific
data analysis software, which even includes features like plotting, multi variate, univariate
statistics, spatial analysis, time series analysis, data manipulation, morphometric and
stratigraphy. The PAST program is used to calculate species diversity, species evenness
calculations. The package is also used to compare the diversity values of the butterfly to
bring out the statistical significance.
Results
A total of 32 butterfly species, with a sum total of 106728 individuals during the
study were recorded. The list of the butterflies is provided as follows:
⊘ This is a preview!⊘
Do you want full access?
Subscribe today to unlock all pages.
Trusted by 1+ million students worldwide
6BIODIVERSITY
Thymelicus sylvestris/Thymelicus lineola, Ochlodes venata, Pyrgus malvae, Leptidea
sinapis, Colias croceus, Gonepteryx rhamni, Pieris brassicae, Pieris rapae, Pieris napi,
Anthocharis cardamines, Thecla betulae, Neozephyrus quercus, Satyrium w-album,
Satyrium pruni, Lycaena phlaeas, Aricia agestis, Polyommatus icarus, Celastrina
argiolus, Limentis camilla, Vanessa atalanta, Vanessa cardui, Aglais urticae, Inachis io,
Polygonia c-album, Argynnis paphia, Pararge aegeria, Lasiommata megera, Melanargia
galathea, Pyronia tithonus, Maniola jurtina, Aphantopus hyperantus, Coenonympha
pamphilus. Among all the above mentioned butterfly species: Pieris napi, Aphantopus
hyperantus, Maniola jurtina showed the highest number of individuals. While Leptidea
sinapis, Colias croceus, Neozephyrus quercus showed the least number of individuals.
Thecla betulae is one of the butterfly whose number was totally nil over the 40 years.
Table 1: list of Butterfly species and their common name
Common Name Scientific name Common Name Scientific name
Small/Essex
Skipper
Thymelicus sylvestris/ T.
Lineola Black Hairstreak Satyrium pruni
Large Skipper Ochlodes venata Small Copper Lycaena phlaeas
Grizzled Skipper Pyrgus malvae Brown Argus Aricia agestis
Wood White Leptidea sinapis Common Blue
Polyommatus
icarus
Clouded Yellow Colias croceus Holly Blue
Celastrina
argiolus
Brimstone Gonepteryx rhamNI White Admiral Limentis camilla
Large White Pieris brassicae Red Admiral Vanessa atalanta
Small White Pieris rapae Painted Lady Vanessa cardui
Green-veined
White Pieris napi Small Tortoiseshell Aglais urticae
Orange Tip Anthocharis cardamines Peacock Inachis io
Paraphrase This Document
Need a fresh take? Get an instant paraphrase of this document with our AI Paraphraser
7BIODIVERSITY
Brown Hairstreak Thecla betulae Comma
Polygonia c-
album
Purple Hairstreak Neozephyrus quercus
Silver-washed
Fritillary Argynnis paphia
White-letter
Hairstreak Satyrium w-album Speckled Wood Pararge aegeria
Meadow Brown MaNIola jurtina Wall Brown
Lasiommata
megera
Ringlet Aphantopus hyperantus Marbled White
Melanargia
galathea
Small Heath Coenonympha pamphilus
Gatekeeper/Hedge
Brown Pyronia tithonus
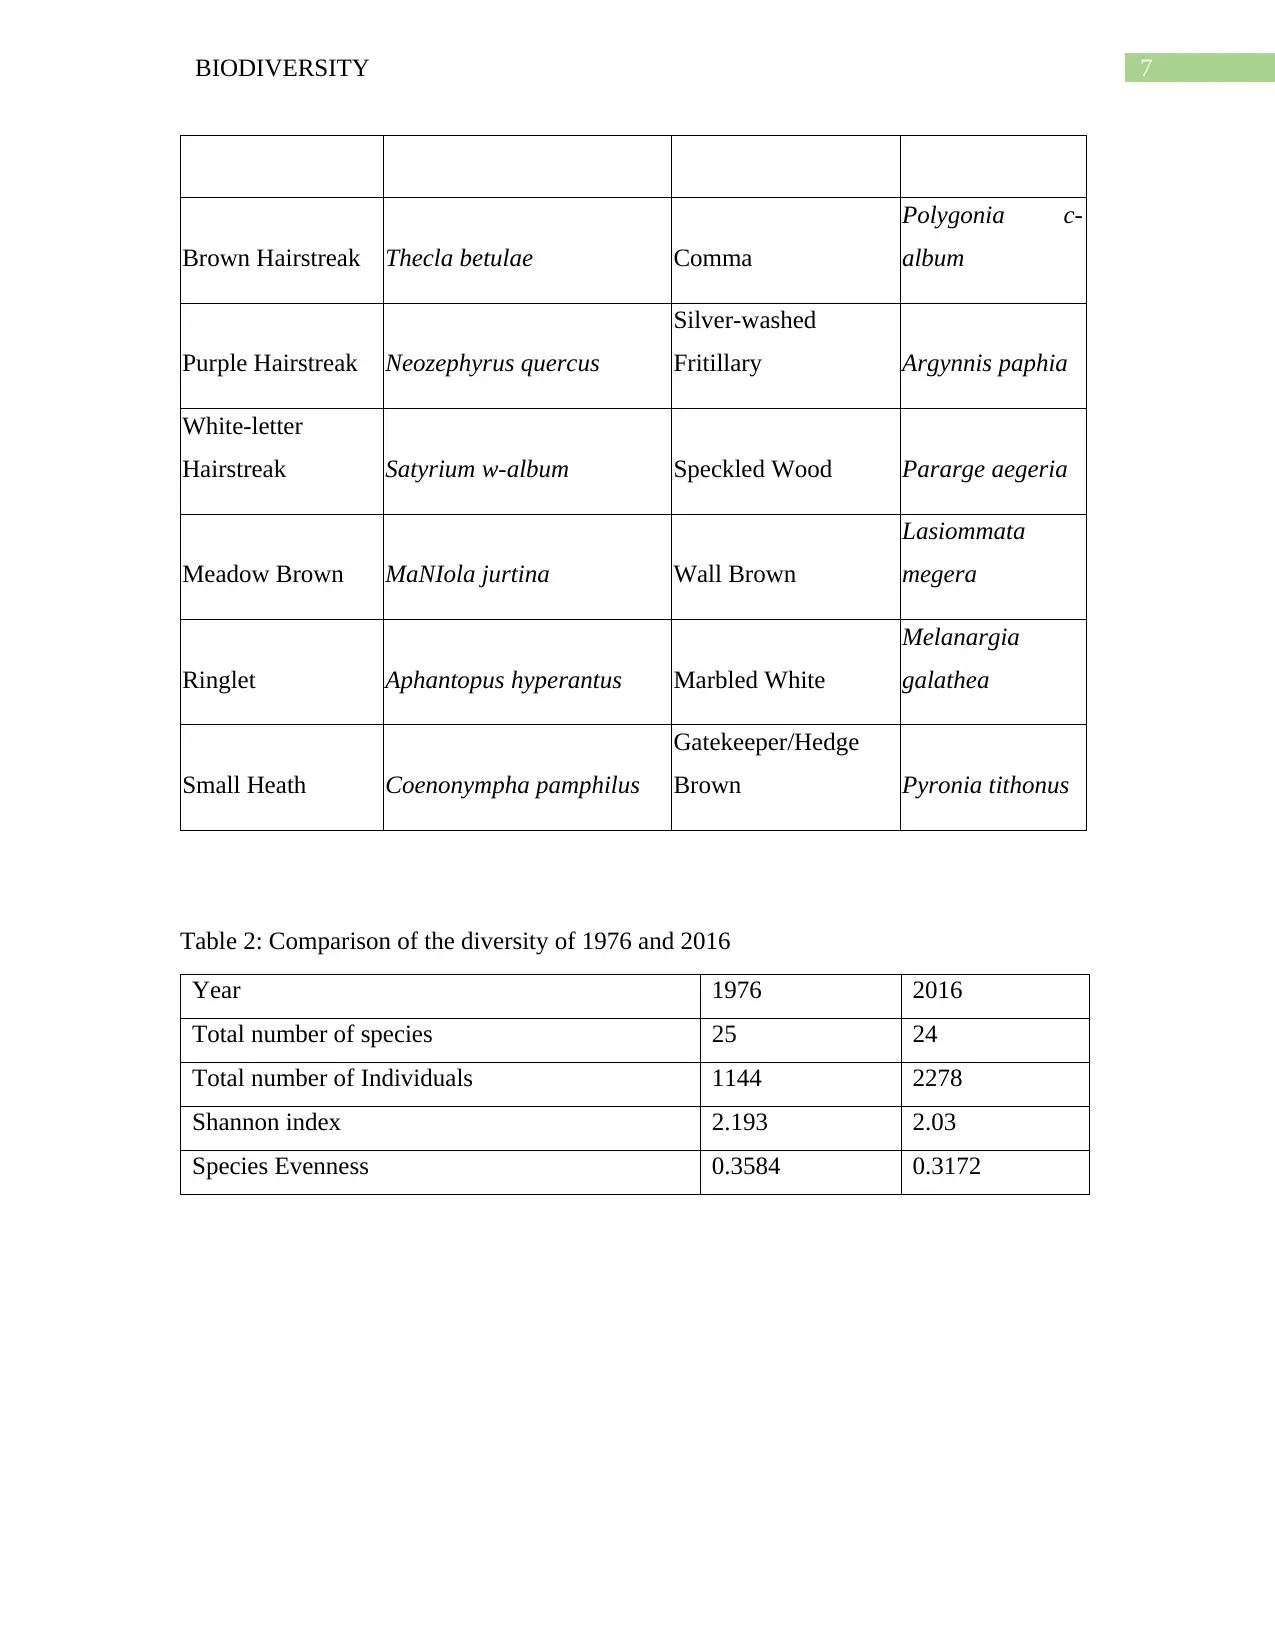
Table 2: Comparison of the diversity of 1976 and 2016
Year 1976 2016
Total number of species 25 24
Total number of Individuals 1144 2278
Shannon index 2.193 2.03
Species Evenness 0.3584 0.3172
Brown Hairstreak Thecla betulae Comma
Polygonia c-
album
Purple Hairstreak Neozephyrus quercus
Silver-washed
Fritillary Argynnis paphia
White-letter
Hairstreak Satyrium w-album Speckled Wood Pararge aegeria
Meadow Brown MaNIola jurtina Wall Brown
Lasiommata
megera
Ringlet Aphantopus hyperantus Marbled White
Melanargia
galathea
Small Heath Coenonympha pamphilus
Gatekeeper/Hedge
Brown Pyronia tithonus
Table 2: Comparison of the diversity of 1976 and 2016
Year 1976 2016
Total number of species 25 24
Total number of Individuals 1144 2278
Shannon index 2.193 2.03
Species Evenness 0.3584 0.3172
8BIODIVERSITY
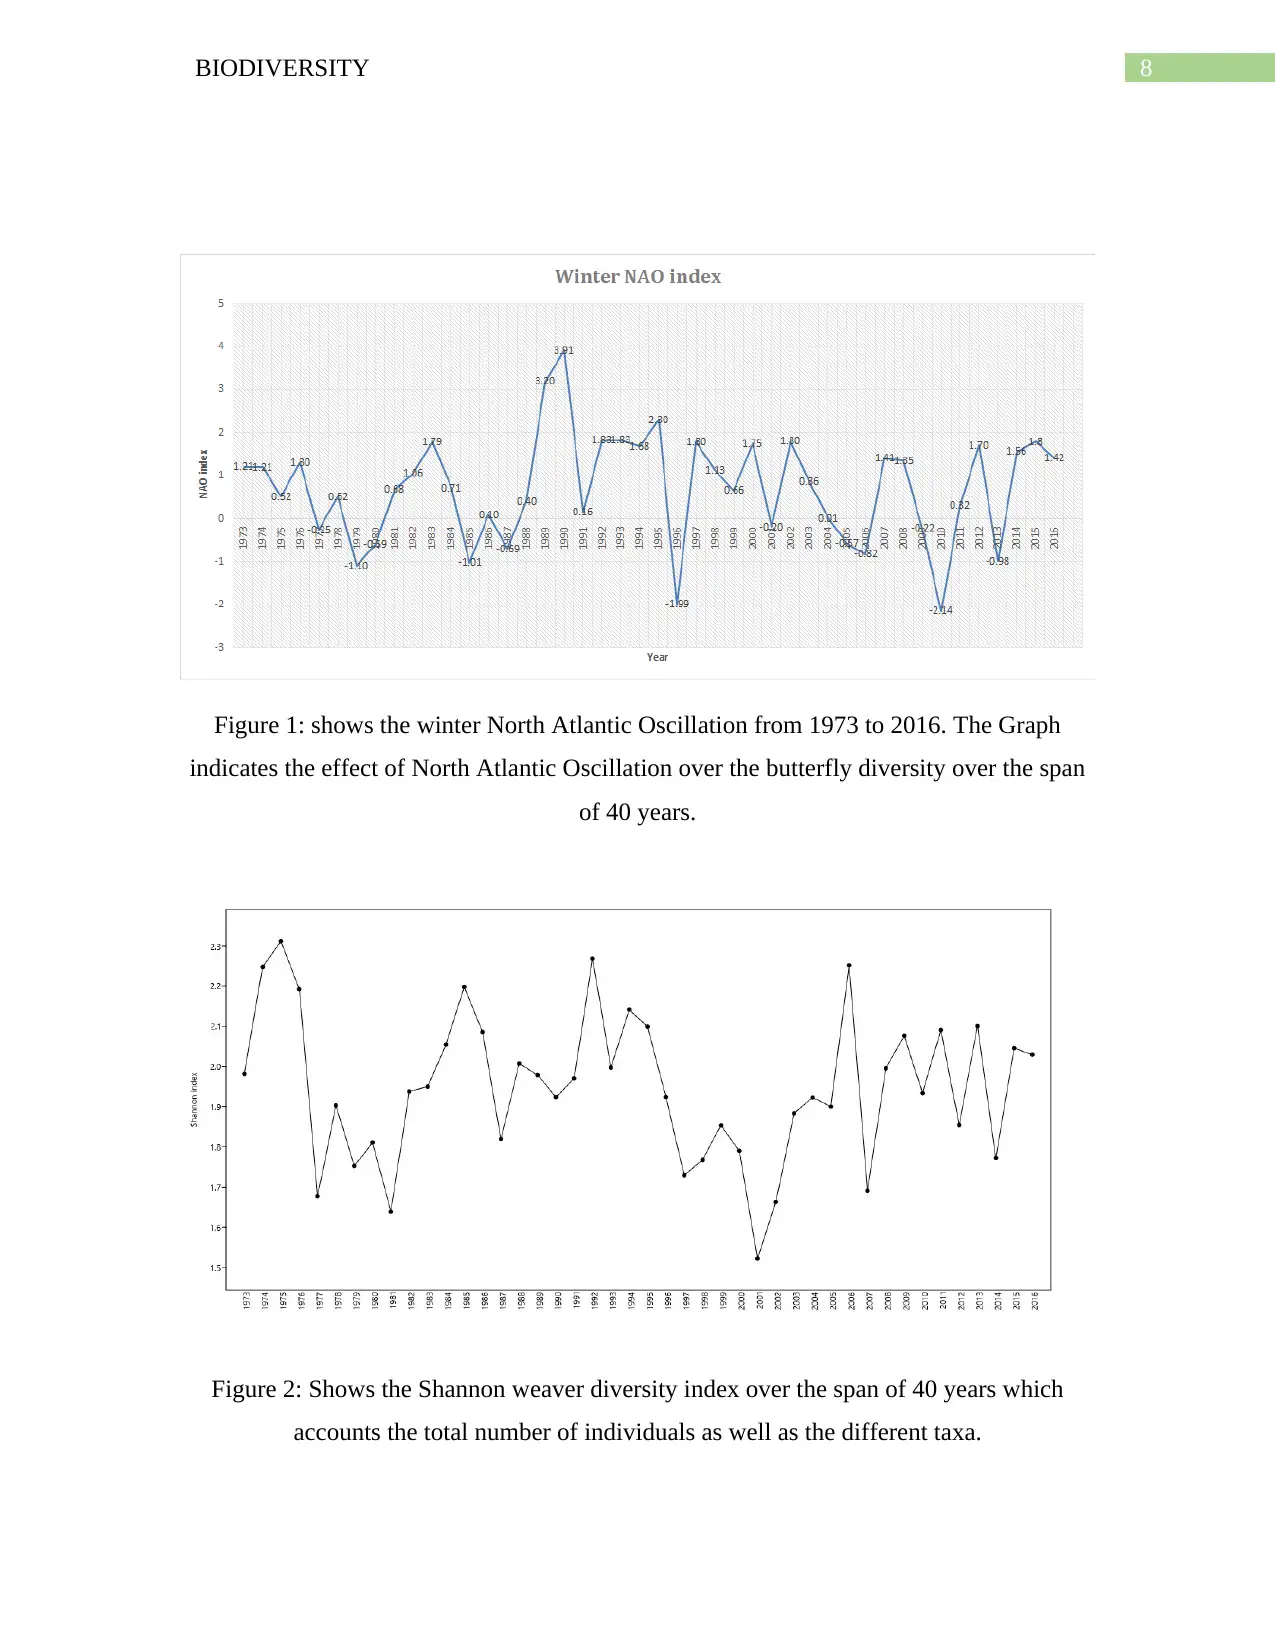
Figure 1: shows the winter North Atlantic Oscillation from 1973 to 2016. The Graph
indicates the effect of North Atlantic Oscillation over the butterfly diversity over the span
of 40 years.
Figure 2: Shows the Shannon weaver diversity index over the span of 40 years which
accounts the total number of individuals as well as the different taxa.
⊘ This is a preview!⊘
Do you want full access?
Subscribe today to unlock all pages.
Trusted by 1+ million students worldwide
9BIODIVERSITY
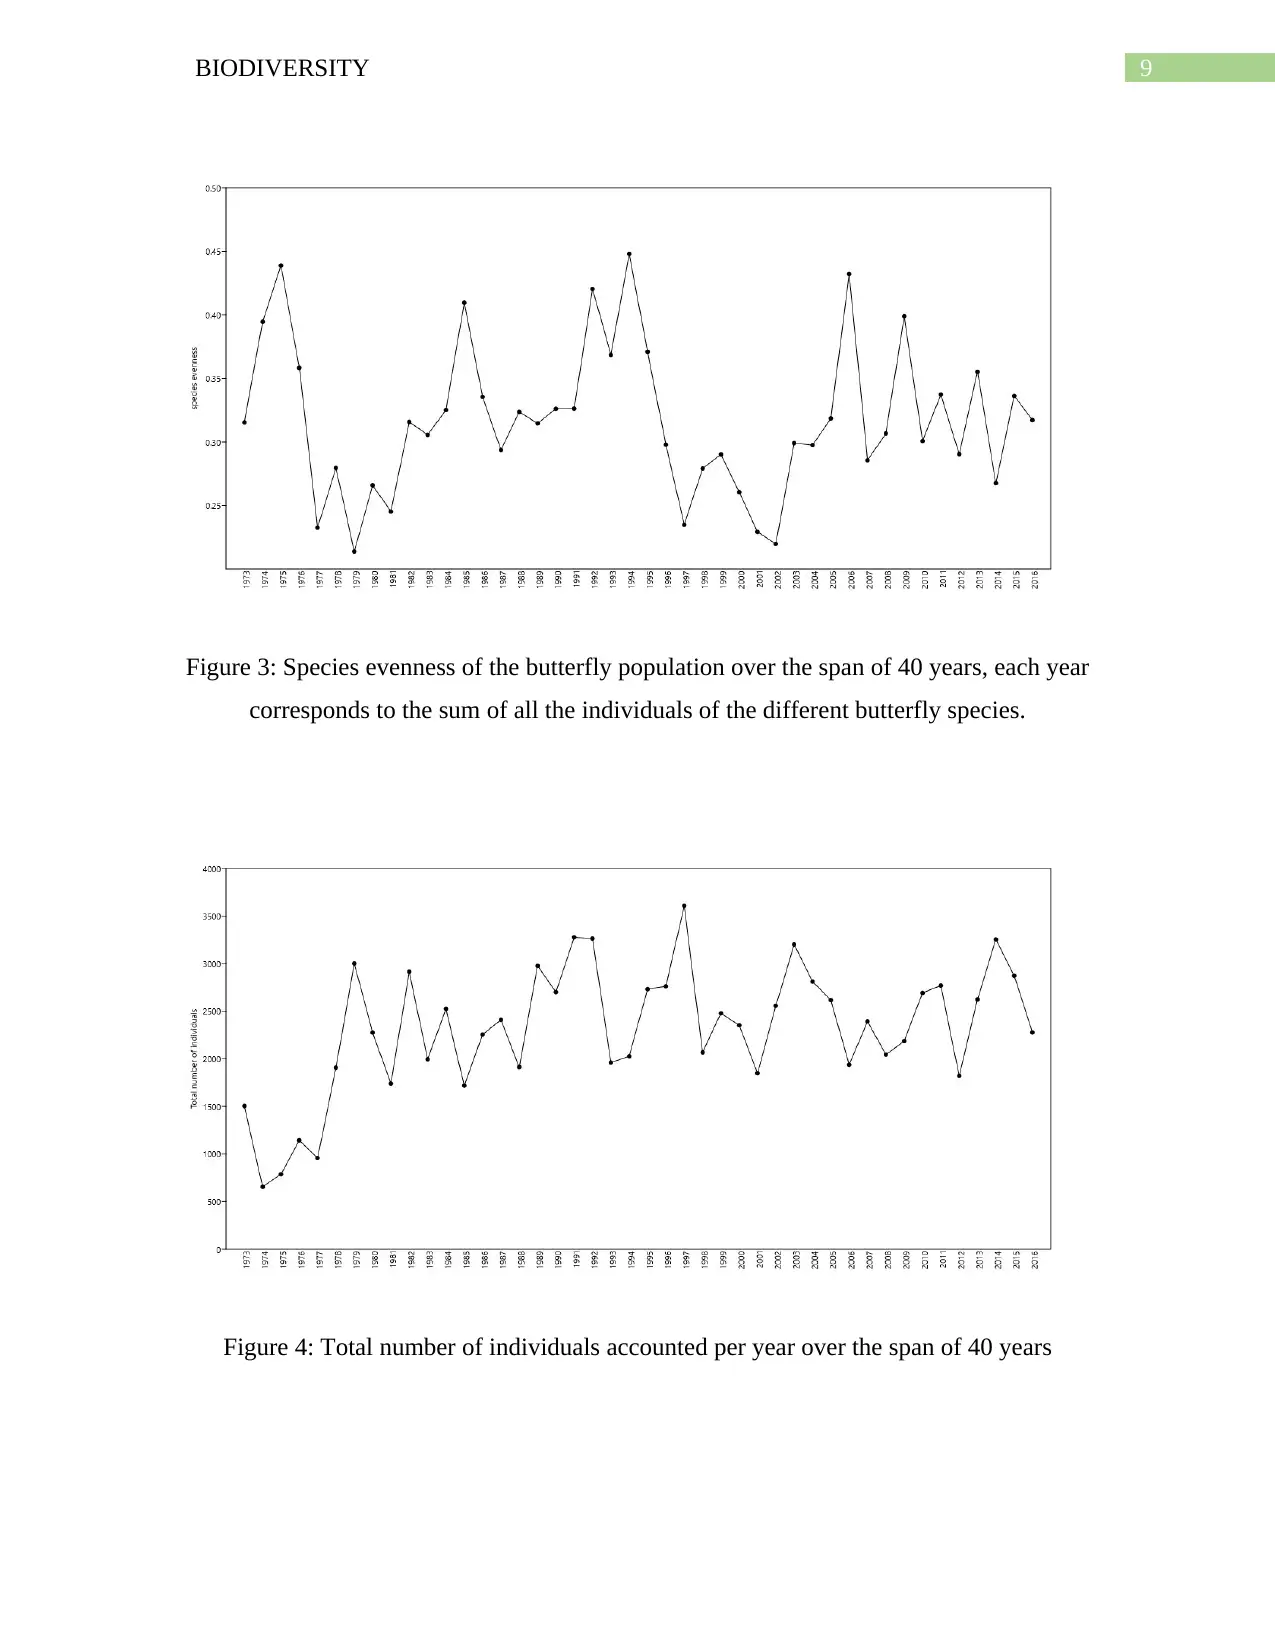
Figure 3: Species evenness of the butterfly population over the span of 40 years, each year
corresponds to the sum of all the individuals of the different butterfly species.
Figure 4: Total number of individuals accounted per year over the span of 40 years
Figure 3: Species evenness of the butterfly population over the span of 40 years, each year
corresponds to the sum of all the individuals of the different butterfly species.
Figure 4: Total number of individuals accounted per year over the span of 40 years
Paraphrase This Document
Need a fresh take? Get an instant paraphrase of this document with our AI Paraphraser
10BIODIVERSITY
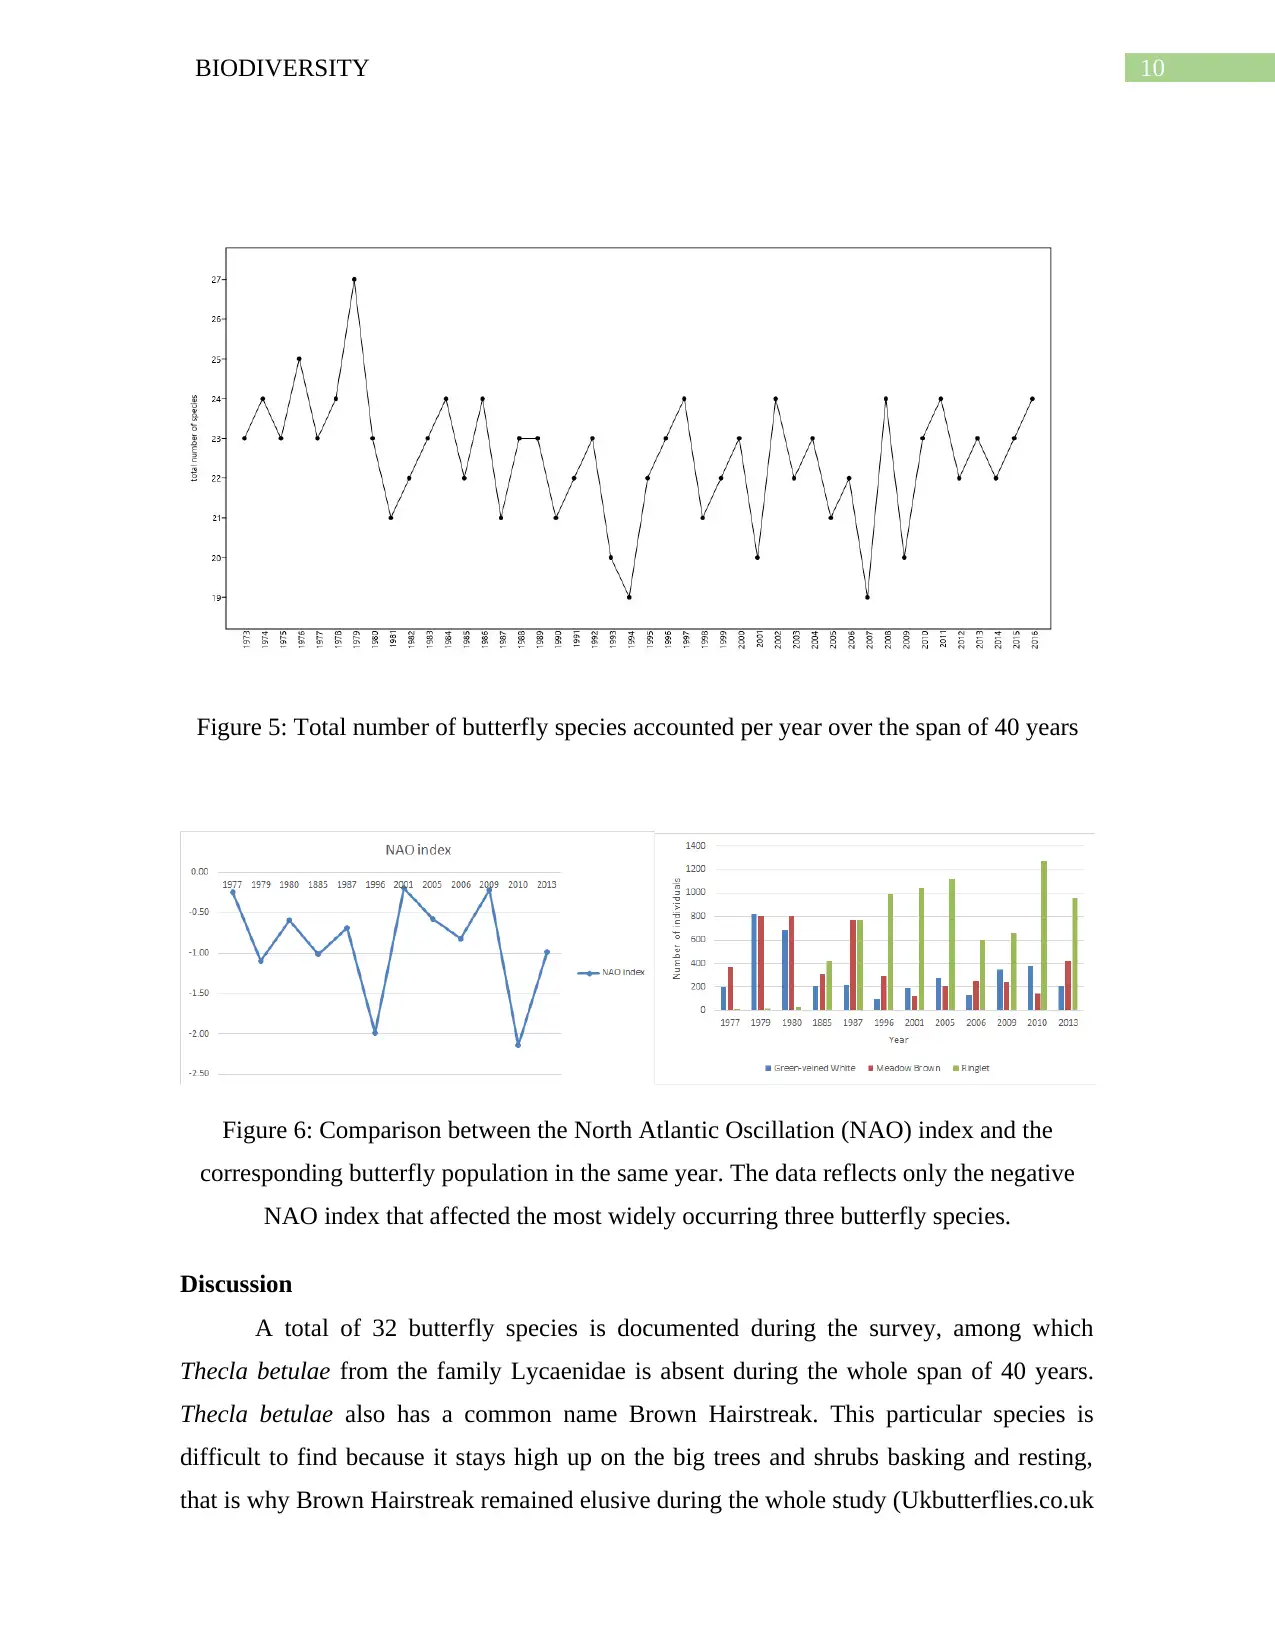
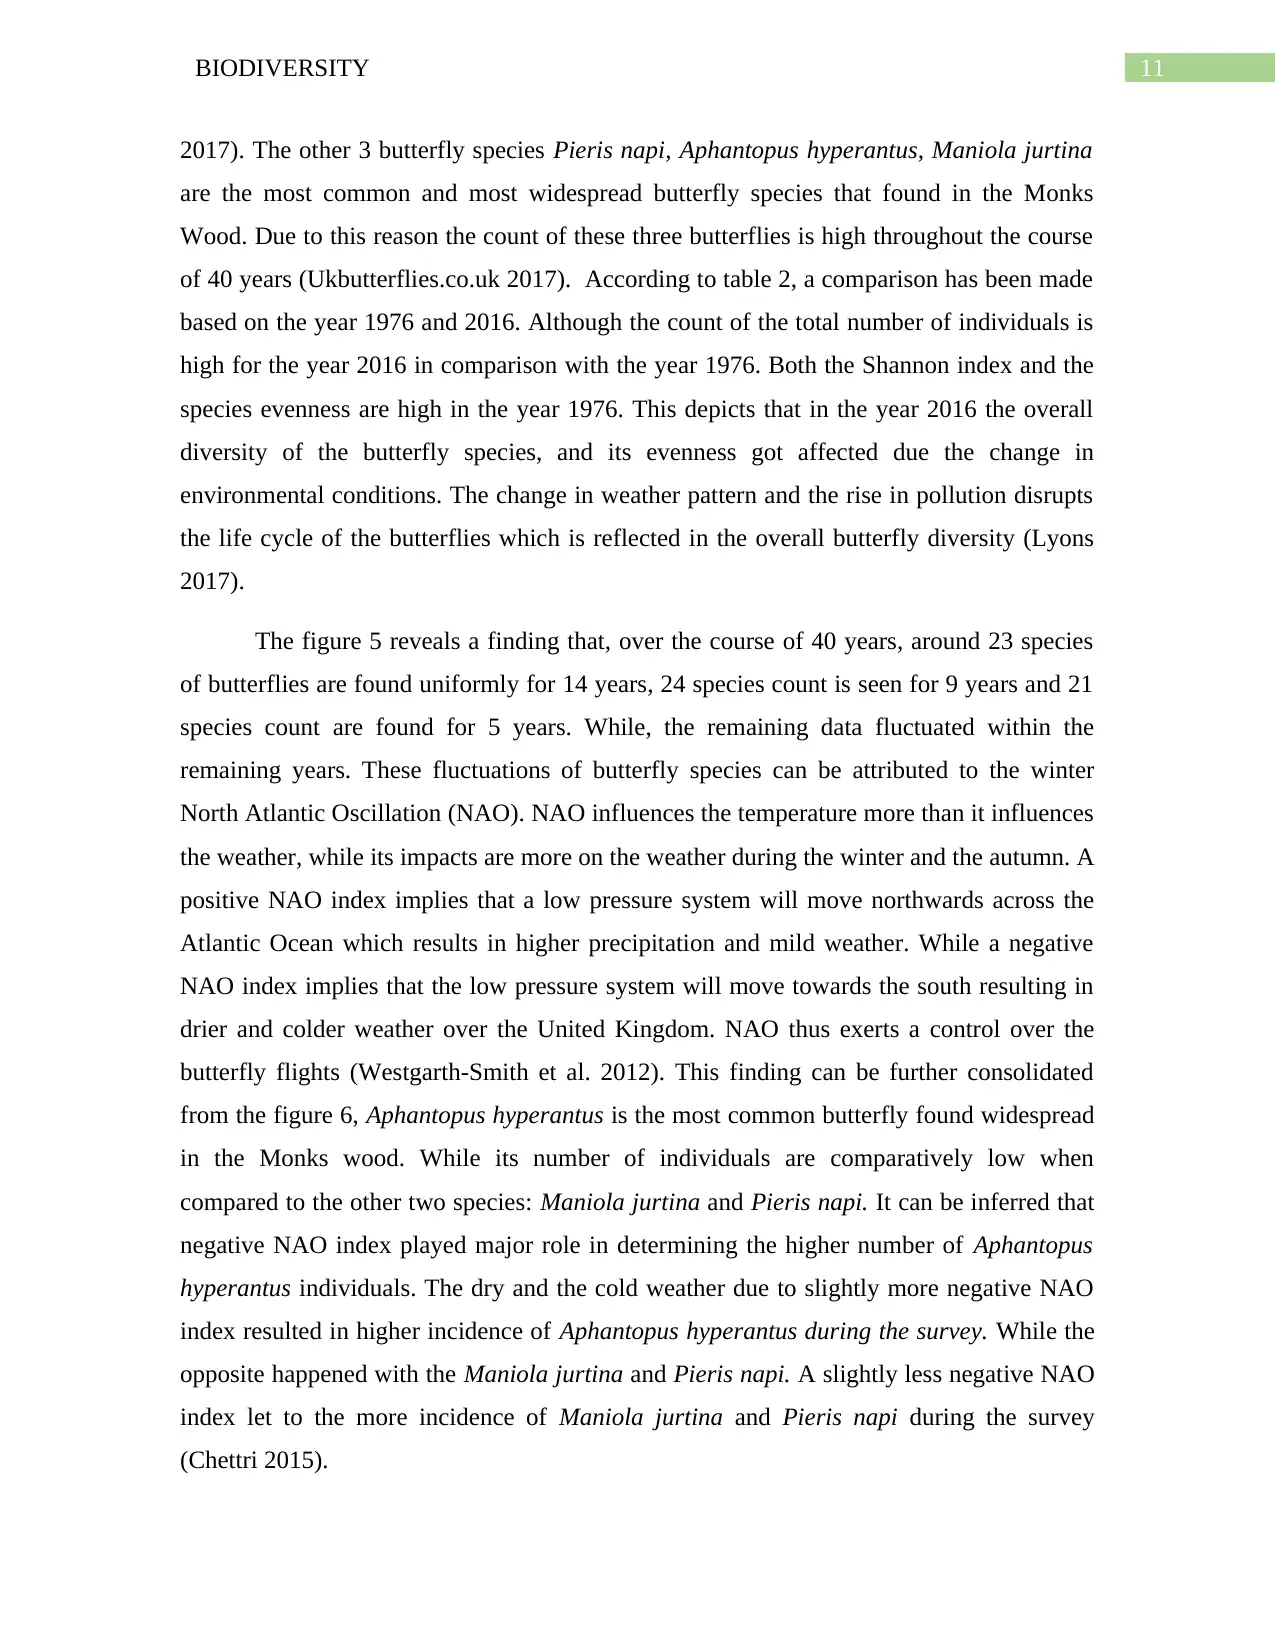
Figure 5: Total number of butterfly species accounted per year over the span of 40 years
Figure 6: Comparison between the North Atlantic Oscillation (NAO) index and the
corresponding butterfly population in the same year. The data reflects only the negative
NAO index that affected the most widely occurring three butterfly species.
Discussion
A total of 32 butterfly species is documented during the survey, among which
Thecla betulae from the family Lycaenidae is absent during the whole span of 40 years.
Thecla betulae also has a common name Brown Hairstreak. This particular species is
difficult to find because it stays high up on the big trees and shrubs basking and resting,
that is why Brown Hairstreak remained elusive during the whole study (Ukbutterflies.co.uk
11BIODIVERSITY
2017). The other 3 butterfly species Pieris napi, Aphantopus hyperantus, Maniola jurtina
are the most common and most widespread butterfly species that found in the Monks
Wood. Due to this reason the count of these three butterflies is high throughout the course
of 40 years (Ukbutterflies.co.uk 2017). According to table 2, a comparison has been made
based on the year 1976 and 2016. Although the count of the total number of individuals is
high for the year 2016 in comparison with the year 1976. Both the Shannon index and the
species evenness are high in the year 1976. This depicts that in the year 2016 the overall
diversity of the butterfly species, and its evenness got affected due the change in
environmental conditions. The change in weather pattern and the rise in pollution disrupts
the life cycle of the butterflies which is reflected in the overall butterfly diversity (Lyons
2017).
The figure 5 reveals a finding that, over the course of 40 years, around 23 species
of butterflies are found uniformly for 14 years, 24 species count is seen for 9 years and 21
species count are found for 5 years. While, the remaining data fluctuated within the
remaining years. These fluctuations of butterfly species can be attributed to the winter
North Atlantic Oscillation (NAO). NAO influences the temperature more than it influences
the weather, while its impacts are more on the weather during the winter and the autumn. A
positive NAO index implies that a low pressure system will move northwards across the
Atlantic Ocean which results in higher precipitation and mild weather. While a negative
NAO index implies that the low pressure system will move towards the south resulting in
drier and colder weather over the United Kingdom. NAO thus exerts a control over the
butterfly flights (Westgarth‐Smith et al. 2012). This finding can be further consolidated
from the figure 6, Aphantopus hyperantus is the most common butterfly found widespread
in the Monks wood. While its number of individuals are comparatively low when
compared to the other two species: Maniola jurtina and Pieris napi. It can be inferred that
negative NAO index played major role in determining the higher number of Aphantopus
hyperantus individuals. The dry and the cold weather due to slightly more negative NAO
index resulted in higher incidence of Aphantopus hyperantus during the survey. While the
opposite happened with the Maniola jurtina and Pieris napi. A slightly less negative NAO
index let to the more incidence of Maniola jurtina and Pieris napi during the survey
(Chettri 2015).
⊘ This is a preview!⊘
Do you want full access?
Subscribe today to unlock all pages.
Trusted by 1+ million students worldwide
1 out of 16
Related Documents


Your All-in-One AI-Powered Toolkit for Academic Success.
+13062052269
info@desklib.com
Available 24*7 on WhatsApp / Email
![[object Object]](/_next/static/media/star-bottom.7253800d.svg)
Unlock your academic potential
Copyright © 2020–2026 A2Z Services. All Rights Reserved. Developed and managed by ZUCOL.