Analysis of Asset Management in Engineering Environment at University
VerifiedAdded on 2021/04/21
|17
|2465
|40
Report
AI Summary
This report provides a comprehensive analysis of asset management within an engineering context. It begins by defining depreciation and detailing various methods such as the straight-line, diminishing value, unit of production, sum of the year's digit, and double-declining balance methods, along with their practical applications. The report then explores the criteria for selecting appropriate depreciation methods and includes calculations for hourly cost rates of machinery. Furthermore, it delves into the decision-making processes for purchasing, rehabilitating, or replacing assets, employing techniques like NPV and IRR for investment analysis. The report evaluates the advantages and disadvantages of these methods and incorporates sensitivity analysis to determine optimal investment strategies. Finally, the report discusses the application of life cycle costing and other critical considerations, such as environmental and community impacts, in asset management decisions.
Running head: ASSET MANAGEMENT IN ENGINEERING ENVIRONMENT
Asset Management in Engineering Environment
Name of the Student:
Name of the University:
Author’s Note:
Asset Management in Engineering Environment
Name of the Student:
Name of the University:
Author’s Note:
Paraphrase This Document
Need a fresh take? Get an instant paraphrase of this document with our AI Paraphraser
1
ASSET MANAGEMENT IN ENGINEERING ENVIRONMENT
Table of Contents
Answer to Question 2......................................................................................................................2
Part a............................................................................................................................................2
Part b............................................................................................................................................3
Question 3........................................................................................................................................8
Part a............................................................................................................................................8
Part b............................................................................................................................................9
Reference.......................................................................................................................................15
2
ASSET MANAGEMENT IN ENGINEERING ENVIRONMENT
Answer to Question 2
Part a
Depreciation may be defined as the decrease in the value of the asset over time due to
various factors which affect the life of the asset (Li and Hall 2016). The various methods which
are used in the process of computing depreciation are given below in details:
1. Straight Line method: This is the most simple and easy method of computing
depreciation amount which is to be charged on the asset of the company. As per this
method, the amount which is charged as depreciation remains the same every year over
the useful life of the assets (Ibarra 2013). This is a widely used method of computing
depreciation due to its simplicity in many companies.
2. Diminishing Value Method: This is another most used method for computing
depreciation for the company. In this method a certain rate of depreciation is charged on
the value of the asset in order to compute the depreciation amount of the asset (Lawrence
and Okechukwu 2013). The amount of depreciation charged under this method changes
every year depending upon the written down value of the asset on which depreciation is
to be charged.
3. Unit of Production Method: As per this method, the amount of depreciation which is
charged on the value of the asset depends on the units produced or total number of hours
which the machine has over the useful life of the asset.
4. Sum of the Year’s Digit Method: In this method, the remaining useful of the asset is
divided by the sum of the years and then the figure is multiplied by the depreciation base
to determine the expenses relating to depreciation of an asset.
⊘ This is a preview!⊘
Do you want full access?
Subscribe today to unlock all pages.
Trusted by 1+ million students worldwide
3
ASSET MANAGEMENT IN ENGINEERING ENVIRONMENT
5. Double Declining Balance Method: In this method the expense relating to depreciation is
larger in the initial years of the asset and becomes lower and lower in the later years of
the useful life of the asset.
Depreciation of an asset allows the valuation of the asset to done correctly. An asset which is
used continuously will be having certain wear and tear which are expenses to the company even
though they are not in cash (Liapis and Kantianis 2015). If such expenses are not recorded then
the asset will be overvalued and this will be overstating the assets in the balance sheet which is
definitely not the case.
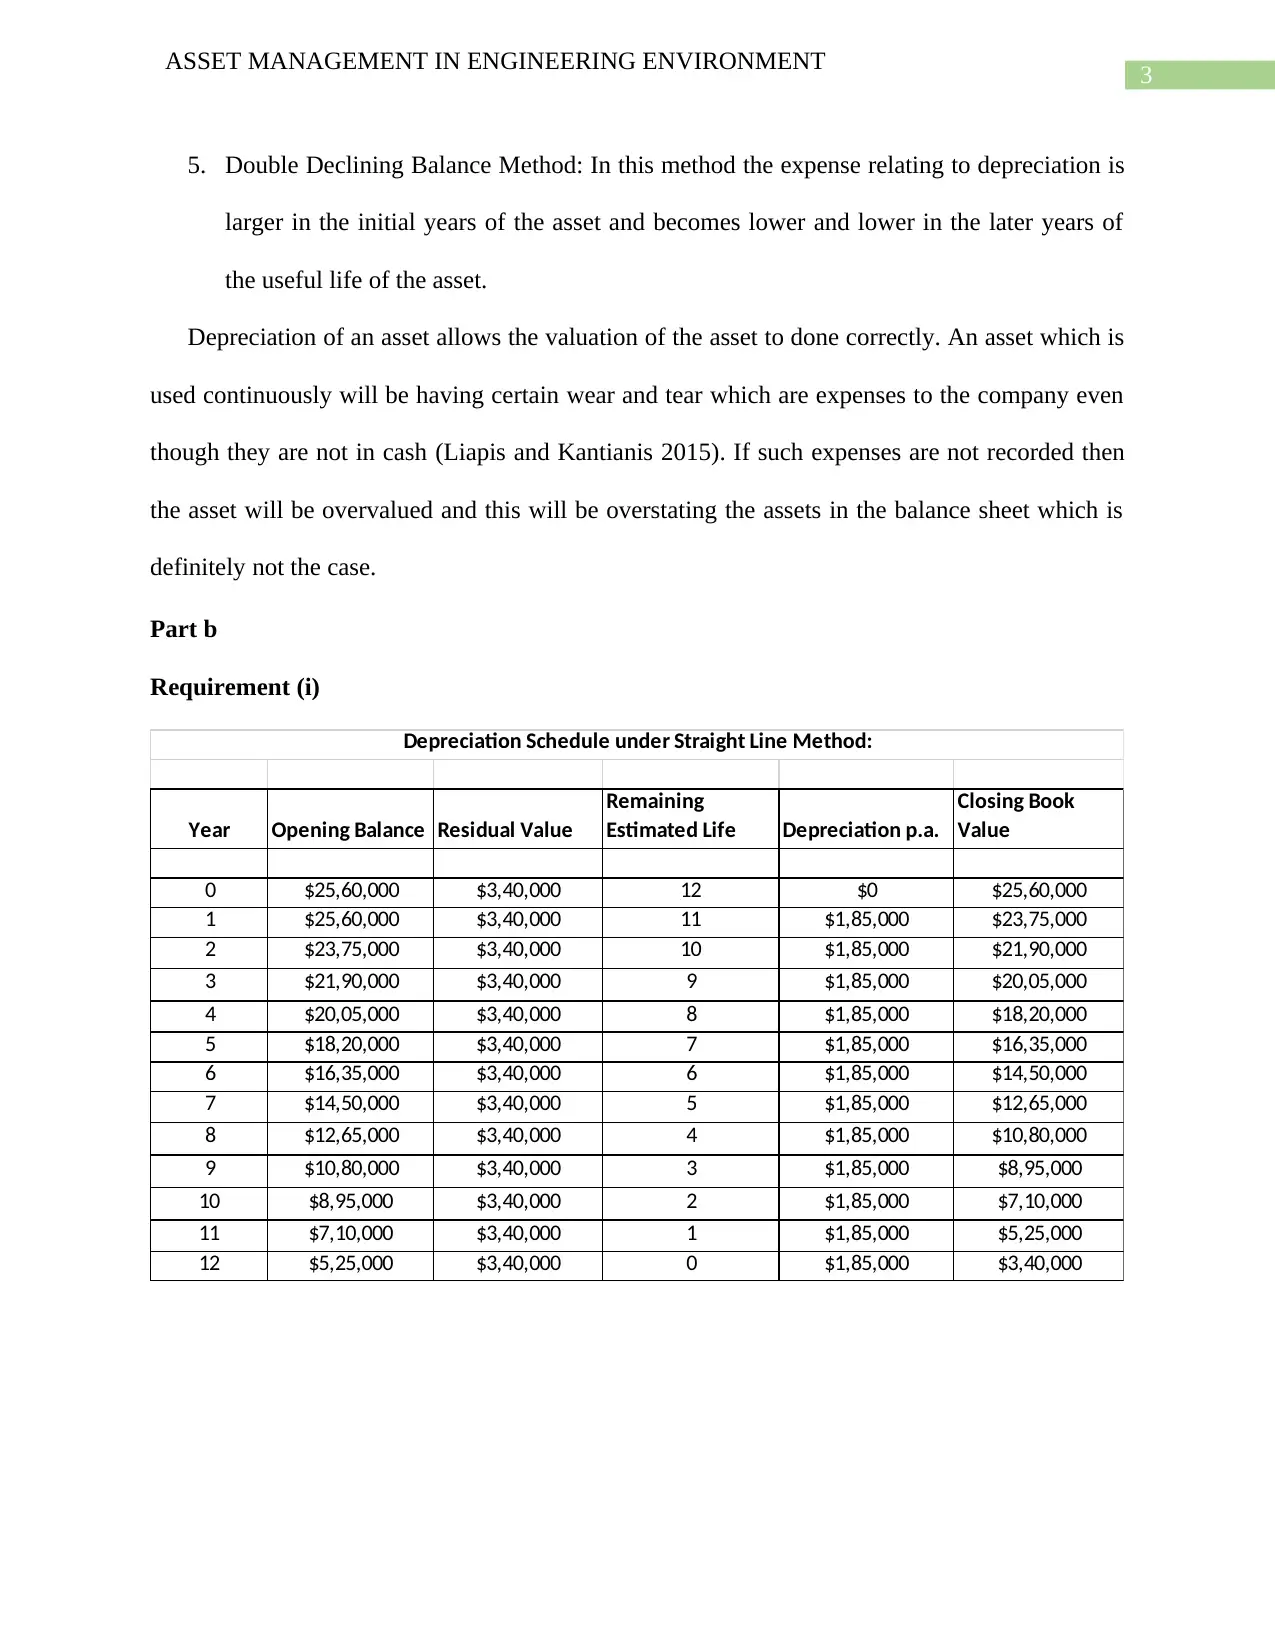
Part b
Requirement (i)
Year Opening Balance Residual Value
Remaining
Estimated Life Depreciation p.a.
Closing Book
Value
0 $25,60,000 $3,40,000 12 $0 $25,60,000
1 $25,60,000 $3,40,000 11 $1,85,000 $23,75,000
2 $23,75,000 $3,40,000 10 $1,85,000 $21,90,000
3 $21,90,000 $3,40,000 9 $1,85,000 $20,05,000
4 $20,05,000 $3,40,000 8 $1,85,000 $18,20,000
5 $18,20,000 $3,40,000 7 $1,85,000 $16,35,000
6 $16,35,000 $3,40,000 6 $1,85,000 $14,50,000
7 $14,50,000 $3,40,000 5 $1,85,000 $12,65,000
8 $12,65,000 $3,40,000 4 $1,85,000 $10,80,000
9 $10,80,000 $3,40,000 3 $1,85,000 $8,95,000
10 $8,95,000 $3,40,000 2 $1,85,000 $7,10,000
11 $7,10,000 $3,40,000 1 $1,85,000 $5,25,000
12 $5,25,000 $3,40,000 0 $1,85,000 $3,40,000
Depreciation Schedule under Straight Line Method:
ASSET MANAGEMENT IN ENGINEERING ENVIRONMENT
5. Double Declining Balance Method: In this method the expense relating to depreciation is
larger in the initial years of the asset and becomes lower and lower in the later years of
the useful life of the asset.
Depreciation of an asset allows the valuation of the asset to done correctly. An asset which is
used continuously will be having certain wear and tear which are expenses to the company even
though they are not in cash (Liapis and Kantianis 2015). If such expenses are not recorded then
the asset will be overvalued and this will be overstating the assets in the balance sheet which is
definitely not the case.
Part b
Requirement (i)
Year Opening Balance Residual Value
Remaining
Estimated Life Depreciation p.a.
Closing Book
Value
0 $25,60,000 $3,40,000 12 $0 $25,60,000
1 $25,60,000 $3,40,000 11 $1,85,000 $23,75,000
2 $23,75,000 $3,40,000 10 $1,85,000 $21,90,000
3 $21,90,000 $3,40,000 9 $1,85,000 $20,05,000
4 $20,05,000 $3,40,000 8 $1,85,000 $18,20,000
5 $18,20,000 $3,40,000 7 $1,85,000 $16,35,000
6 $16,35,000 $3,40,000 6 $1,85,000 $14,50,000
7 $14,50,000 $3,40,000 5 $1,85,000 $12,65,000
8 $12,65,000 $3,40,000 4 $1,85,000 $10,80,000
9 $10,80,000 $3,40,000 3 $1,85,000 $8,95,000
10 $8,95,000 $3,40,000 2 $1,85,000 $7,10,000
11 $7,10,000 $3,40,000 1 $1,85,000 $5,25,000
12 $5,25,000 $3,40,000 0 $1,85,000 $3,40,000
Depreciation Schedule under Straight Line Method:
Paraphrase This Document
Need a fresh take? Get an instant paraphrase of this document with our AI Paraphraser
4
ASSET MANAGEMENT IN ENGINEERING ENVIRONMENT
Year Opening Balance Residual Value
Remaining
Estimated Life Depreciation Rate Depreciation p.a.
Closing Book
Value
0 $25,60,000 $3,40,000 12 16.67% $0 $25,60,000
1 $25,60,000 $3,40,000 11 16.67% $4,26,667 $21,33,333
2 $21,33,333 $3,40,000 10 16.67% $3,55,556 $17,77,778
3 $17,77,778 $3,40,000 9 16.67% $2,96,296 $14,81,481
4 $14,81,481 $3,40,000 8 16.67% $2,46,914 $12,34,568
5 $12,34,568 $3,40,000 7 16.67% $2,05,761 $10,28,807
6 $10,28,807 $3,40,000 6 16.67% $1,71,468 $8,57,339
7 $8,57,339 $3,40,000 5 16.67% $1,42,890 $7,14,449
8 $7,14,449 $3,40,000 4 16.67% $1,19,075 $5,95,374
9 $5,95,374 $3,40,000 3 16.67% $99,229 $4,96,145
10 $4,96,145 $3,40,000 2 16.67% $82,691 $4,13,454
11 $4,13,454 $3,40,000 1 16.67% $68,909 $3,44,545
12 $3,44,545 $3,40,000 0 16.67% $4,545 $3,40,000
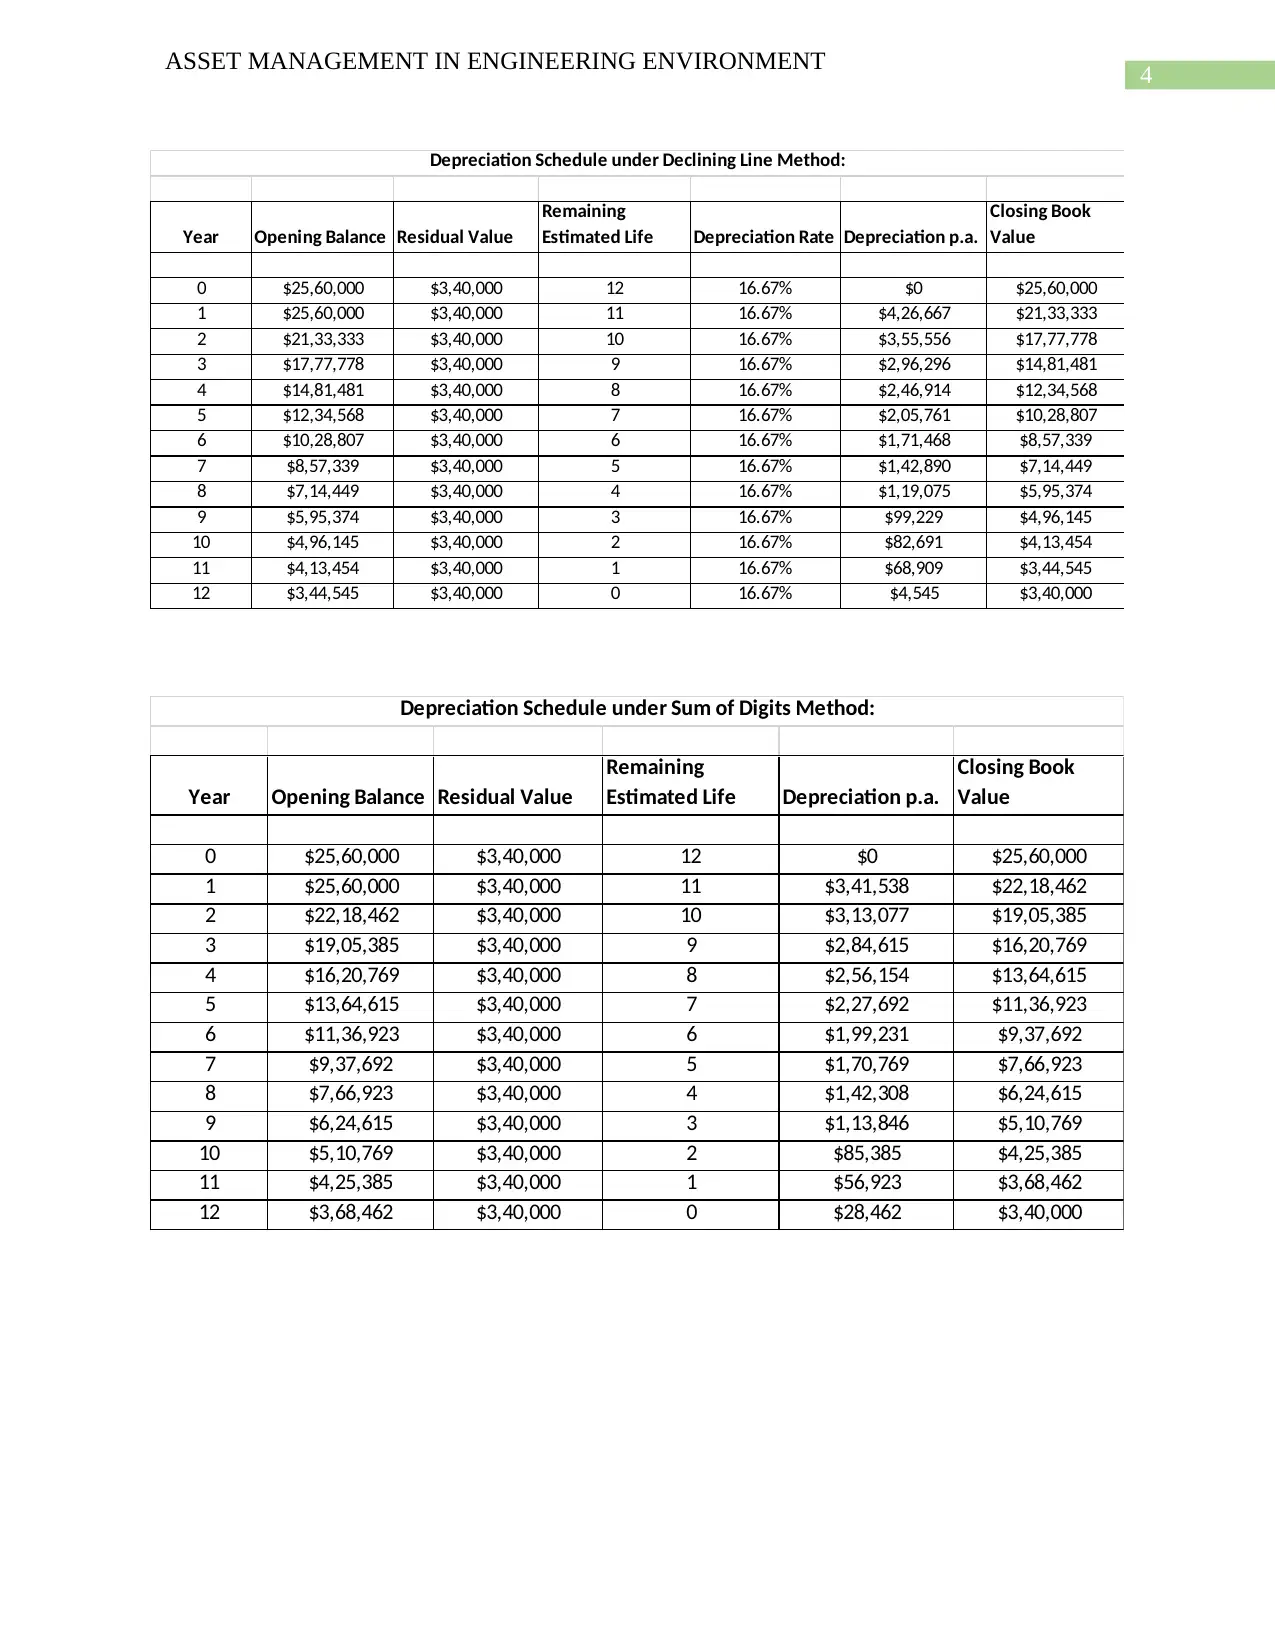
Depreciation Schedule under Declining Line Method:
Year Opening Balance Residual Value
Remaining
Estimated Life Depreciation p.a.
Closing Book
Value
0 $25,60,000 $3,40,000 12 $0 $25,60,000
1 $25,60,000 $3,40,000 11 $3,41,538 $22,18,462
2 $22,18,462 $3,40,000 10 $3,13,077 $19,05,385
3 $19,05,385 $3,40,000 9 $2,84,615 $16,20,769
4 $16,20,769 $3,40,000 8 $2,56,154 $13,64,615
5 $13,64,615 $3,40,000 7 $2,27,692 $11,36,923
6 $11,36,923 $3,40,000 6 $1,99,231 $9,37,692
7 $9,37,692 $3,40,000 5 $1,70,769 $7,66,923
8 $7,66,923 $3,40,000 4 $1,42,308 $6,24,615
9 $6,24,615 $3,40,000 3 $1,13,846 $5,10,769
10 $5,10,769 $3,40,000 2 $85,385 $4,25,385
11 $4,25,385 $3,40,000 1 $56,923 $3,68,462
12 $3,68,462 $3,40,000 0 $28,462 $3,40,000
Depreciation Schedule under Sum of Digits Method:
ASSET MANAGEMENT IN ENGINEERING ENVIRONMENT
Year Opening Balance Residual Value
Remaining
Estimated Life Depreciation Rate Depreciation p.a.
Closing Book
Value
0 $25,60,000 $3,40,000 12 16.67% $0 $25,60,000
1 $25,60,000 $3,40,000 11 16.67% $4,26,667 $21,33,333
2 $21,33,333 $3,40,000 10 16.67% $3,55,556 $17,77,778
3 $17,77,778 $3,40,000 9 16.67% $2,96,296 $14,81,481
4 $14,81,481 $3,40,000 8 16.67% $2,46,914 $12,34,568
5 $12,34,568 $3,40,000 7 16.67% $2,05,761 $10,28,807
6 $10,28,807 $3,40,000 6 16.67% $1,71,468 $8,57,339
7 $8,57,339 $3,40,000 5 16.67% $1,42,890 $7,14,449
8 $7,14,449 $3,40,000 4 16.67% $1,19,075 $5,95,374
9 $5,95,374 $3,40,000 3 16.67% $99,229 $4,96,145
10 $4,96,145 $3,40,000 2 16.67% $82,691 $4,13,454
11 $4,13,454 $3,40,000 1 16.67% $68,909 $3,44,545
12 $3,44,545 $3,40,000 0 16.67% $4,545 $3,40,000
Depreciation Schedule under Declining Line Method:
Year Opening Balance Residual Value
Remaining
Estimated Life Depreciation p.a.
Closing Book
Value
0 $25,60,000 $3,40,000 12 $0 $25,60,000
1 $25,60,000 $3,40,000 11 $3,41,538 $22,18,462
2 $22,18,462 $3,40,000 10 $3,13,077 $19,05,385
3 $19,05,385 $3,40,000 9 $2,84,615 $16,20,769
4 $16,20,769 $3,40,000 8 $2,56,154 $13,64,615
5 $13,64,615 $3,40,000 7 $2,27,692 $11,36,923
6 $11,36,923 $3,40,000 6 $1,99,231 $9,37,692
7 $9,37,692 $3,40,000 5 $1,70,769 $7,66,923
8 $7,66,923 $3,40,000 4 $1,42,308 $6,24,615
9 $6,24,615 $3,40,000 3 $1,13,846 $5,10,769
10 $5,10,769 $3,40,000 2 $85,385 $4,25,385
11 $4,25,385 $3,40,000 1 $56,923 $3,68,462
12 $3,68,462 $3,40,000 0 $28,462 $3,40,000
Depreciation Schedule under Sum of Digits Method:
5
ASSET MANAGEMENT IN ENGINEERING ENVIRONMENT
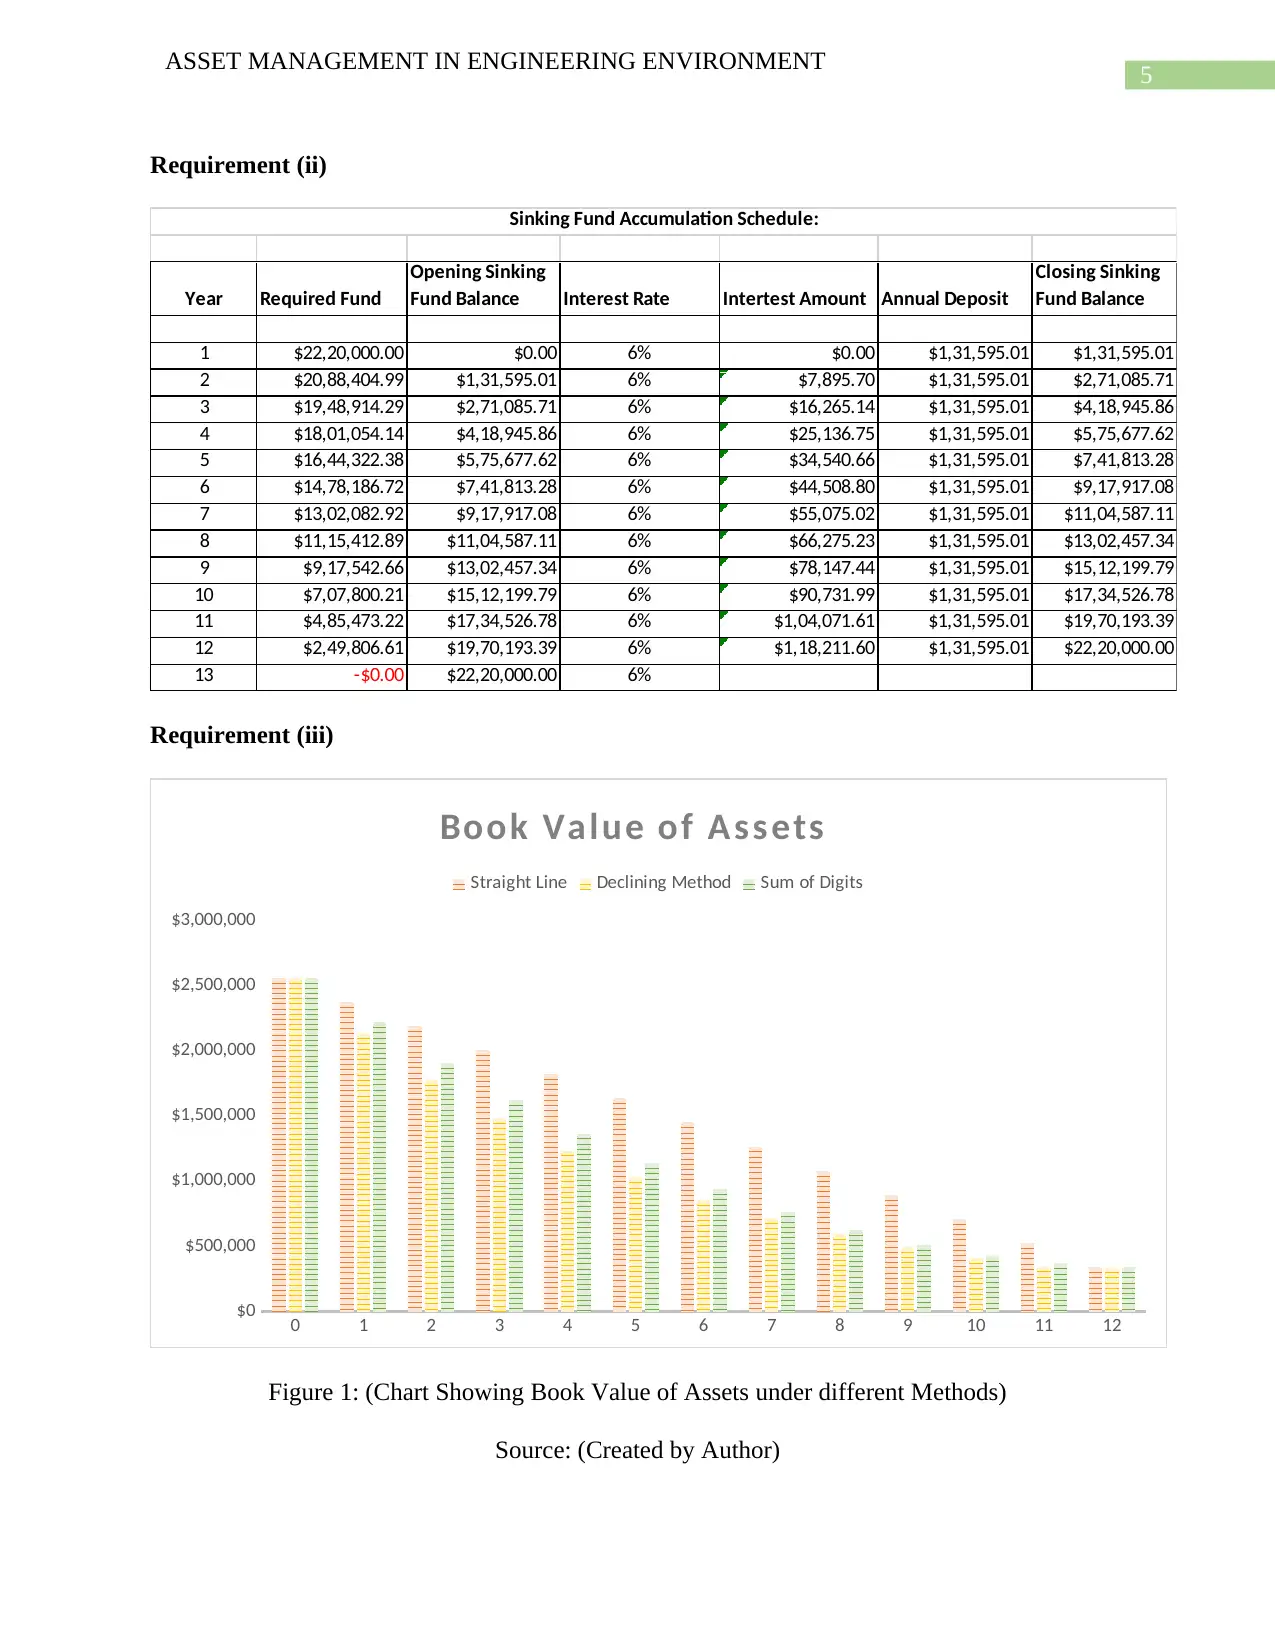
Requirement (ii)
Year Required Fund
Opening Sinking
Fund Balance Interest Rate Intertest Amount Annual Deposit
Closing Sinking
Fund Balance
1 $22,20,000.00 $0.00 6% $0.00 $1,31,595.01 $1,31,595.01
2 $20,88,404.99 $1,31,595.01 6% $7,895.70 $1,31,595.01 $2,71,085.71
3 $19,48,914.29 $2,71,085.71 6% $16,265.14 $1,31,595.01 $4,18,945.86
4 $18,01,054.14 $4,18,945.86 6% $25,136.75 $1,31,595.01 $5,75,677.62
5 $16,44,322.38 $5,75,677.62 6% $34,540.66 $1,31,595.01 $7,41,813.28
6 $14,78,186.72 $7,41,813.28 6% $44,508.80 $1,31,595.01 $9,17,917.08
7 $13,02,082.92 $9,17,917.08 6% $55,075.02 $1,31,595.01 $11,04,587.11
8 $11,15,412.89 $11,04,587.11 6% $66,275.23 $1,31,595.01 $13,02,457.34
9 $9,17,542.66 $13,02,457.34 6% $78,147.44 $1,31,595.01 $15,12,199.79
10 $7,07,800.21 $15,12,199.79 6% $90,731.99 $1,31,595.01 $17,34,526.78
11 $4,85,473.22 $17,34,526.78 6% $1,04,071.61 $1,31,595.01 $19,70,193.39
12 $2,49,806.61 $19,70,193.39 6% $1,18,211.60 $1,31,595.01 $22,20,000.00
13 -$0.00 $22,20,000.00 6%
Sinking Fund Accumulation Schedule:
Requirement (iii)
0 1 2 3 4 5 6 7 8 9 10 11 12
$0
$500,000
$1,000,000
$1,500,000
$2,000,000
$2,500,000
$3,000,000
Book Value of Assets
Straight Line Declining Method Sum of Digits
Figure 1: (Chart Showing Book Value of Assets under different Methods)
Source: (Created by Author)
ASSET MANAGEMENT IN ENGINEERING ENVIRONMENT
Requirement (ii)
Year Required Fund
Opening Sinking
Fund Balance Interest Rate Intertest Amount Annual Deposit
Closing Sinking
Fund Balance
1 $22,20,000.00 $0.00 6% $0.00 $1,31,595.01 $1,31,595.01
2 $20,88,404.99 $1,31,595.01 6% $7,895.70 $1,31,595.01 $2,71,085.71
3 $19,48,914.29 $2,71,085.71 6% $16,265.14 $1,31,595.01 $4,18,945.86
4 $18,01,054.14 $4,18,945.86 6% $25,136.75 $1,31,595.01 $5,75,677.62
5 $16,44,322.38 $5,75,677.62 6% $34,540.66 $1,31,595.01 $7,41,813.28
6 $14,78,186.72 $7,41,813.28 6% $44,508.80 $1,31,595.01 $9,17,917.08
7 $13,02,082.92 $9,17,917.08 6% $55,075.02 $1,31,595.01 $11,04,587.11
8 $11,15,412.89 $11,04,587.11 6% $66,275.23 $1,31,595.01 $13,02,457.34
9 $9,17,542.66 $13,02,457.34 6% $78,147.44 $1,31,595.01 $15,12,199.79
10 $7,07,800.21 $15,12,199.79 6% $90,731.99 $1,31,595.01 $17,34,526.78
11 $4,85,473.22 $17,34,526.78 6% $1,04,071.61 $1,31,595.01 $19,70,193.39
12 $2,49,806.61 $19,70,193.39 6% $1,18,211.60 $1,31,595.01 $22,20,000.00
13 -$0.00 $22,20,000.00 6%
Sinking Fund Accumulation Schedule:
Requirement (iii)
0 1 2 3 4 5 6 7 8 9 10 11 12
$0
$500,000
$1,000,000
$1,500,000
$2,000,000
$2,500,000
$3,000,000
Book Value of Assets
Straight Line Declining Method Sum of Digits
Figure 1: (Chart Showing Book Value of Assets under different Methods)
Source: (Created by Author)
⊘ This is a preview!⊘
Do you want full access?
Subscribe today to unlock all pages.
Trusted by 1+ million students worldwide
6
ASSET MANAGEMENT IN ENGINEERING ENVIRONMENT
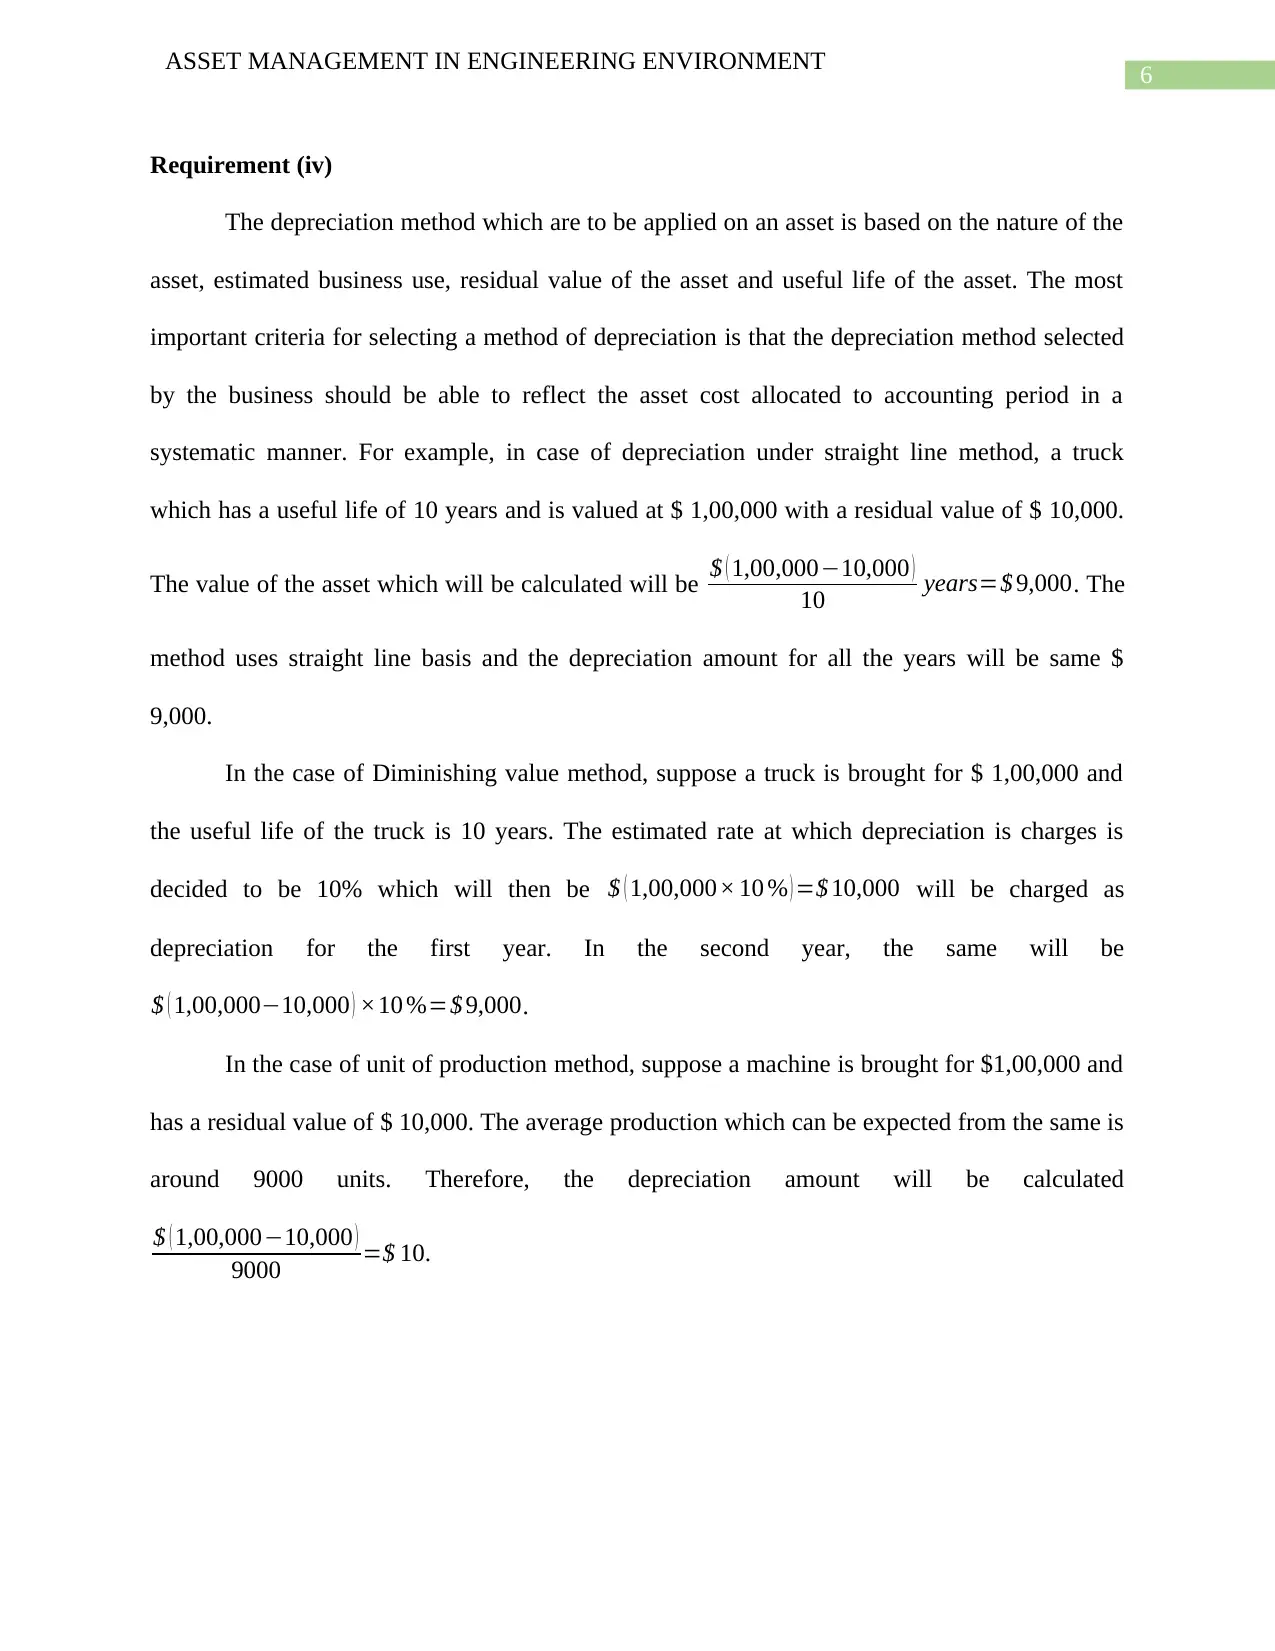
Requirement (iv)
The depreciation method which are to be applied on an asset is based on the nature of the
asset, estimated business use, residual value of the asset and useful life of the asset. The most
important criteria for selecting a method of depreciation is that the depreciation method selected
by the business should be able to reflect the asset cost allocated to accounting period in a
systematic manner. For example, in case of depreciation under straight line method, a truck
which has a useful life of 10 years and is valued at $ 1,00,000 with a residual value of $ 10,000.
The value of the asset which will be calculated will be $ ( 1,00,000−10,000 )
10 years=$ 9,000. The
method uses straight line basis and the depreciation amount for all the years will be same $
9,000.
In the case of Diminishing value method, suppose a truck is brought for $ 1,00,000 and
the useful life of the truck is 10 years. The estimated rate at which depreciation is charges is
decided to be 10% which will then be $ ( 1,00,000× 10 % ) =$ 10,000 will be charged as
depreciation for the first year. In the second year, the same will be
$ ( 1,00,000−10,000 ) ×10 %=$ 9,000.
In the case of unit of production method, suppose a machine is brought for $1,00,000 and
has a residual value of $ 10,000. The average production which can be expected from the same is
around 9000 units. Therefore, the depreciation amount will be calculated
$ ( 1,00,000−10,000 )
9000 =$ 10.
ASSET MANAGEMENT IN ENGINEERING ENVIRONMENT
Requirement (iv)
The depreciation method which are to be applied on an asset is based on the nature of the
asset, estimated business use, residual value of the asset and useful life of the asset. The most
important criteria for selecting a method of depreciation is that the depreciation method selected
by the business should be able to reflect the asset cost allocated to accounting period in a
systematic manner. For example, in case of depreciation under straight line method, a truck
which has a useful life of 10 years and is valued at $ 1,00,000 with a residual value of $ 10,000.
The value of the asset which will be calculated will be $ ( 1,00,000−10,000 )
10 years=$ 9,000. The
method uses straight line basis and the depreciation amount for all the years will be same $
9,000.
In the case of Diminishing value method, suppose a truck is brought for $ 1,00,000 and
the useful life of the truck is 10 years. The estimated rate at which depreciation is charges is
decided to be 10% which will then be $ ( 1,00,000× 10 % ) =$ 10,000 will be charged as
depreciation for the first year. In the second year, the same will be
$ ( 1,00,000−10,000 ) ×10 %=$ 9,000.
In the case of unit of production method, suppose a machine is brought for $1,00,000 and
has a residual value of $ 10,000. The average production which can be expected from the same is
around 9000 units. Therefore, the depreciation amount will be calculated
$ ( 1,00,000−10,000 )
9000 =$ 10.
Paraphrase This Document
Need a fresh take? Get an instant paraphrase of this document with our AI Paraphraser
7
ASSET MANAGEMENT IN ENGINEERING ENVIRONMENT
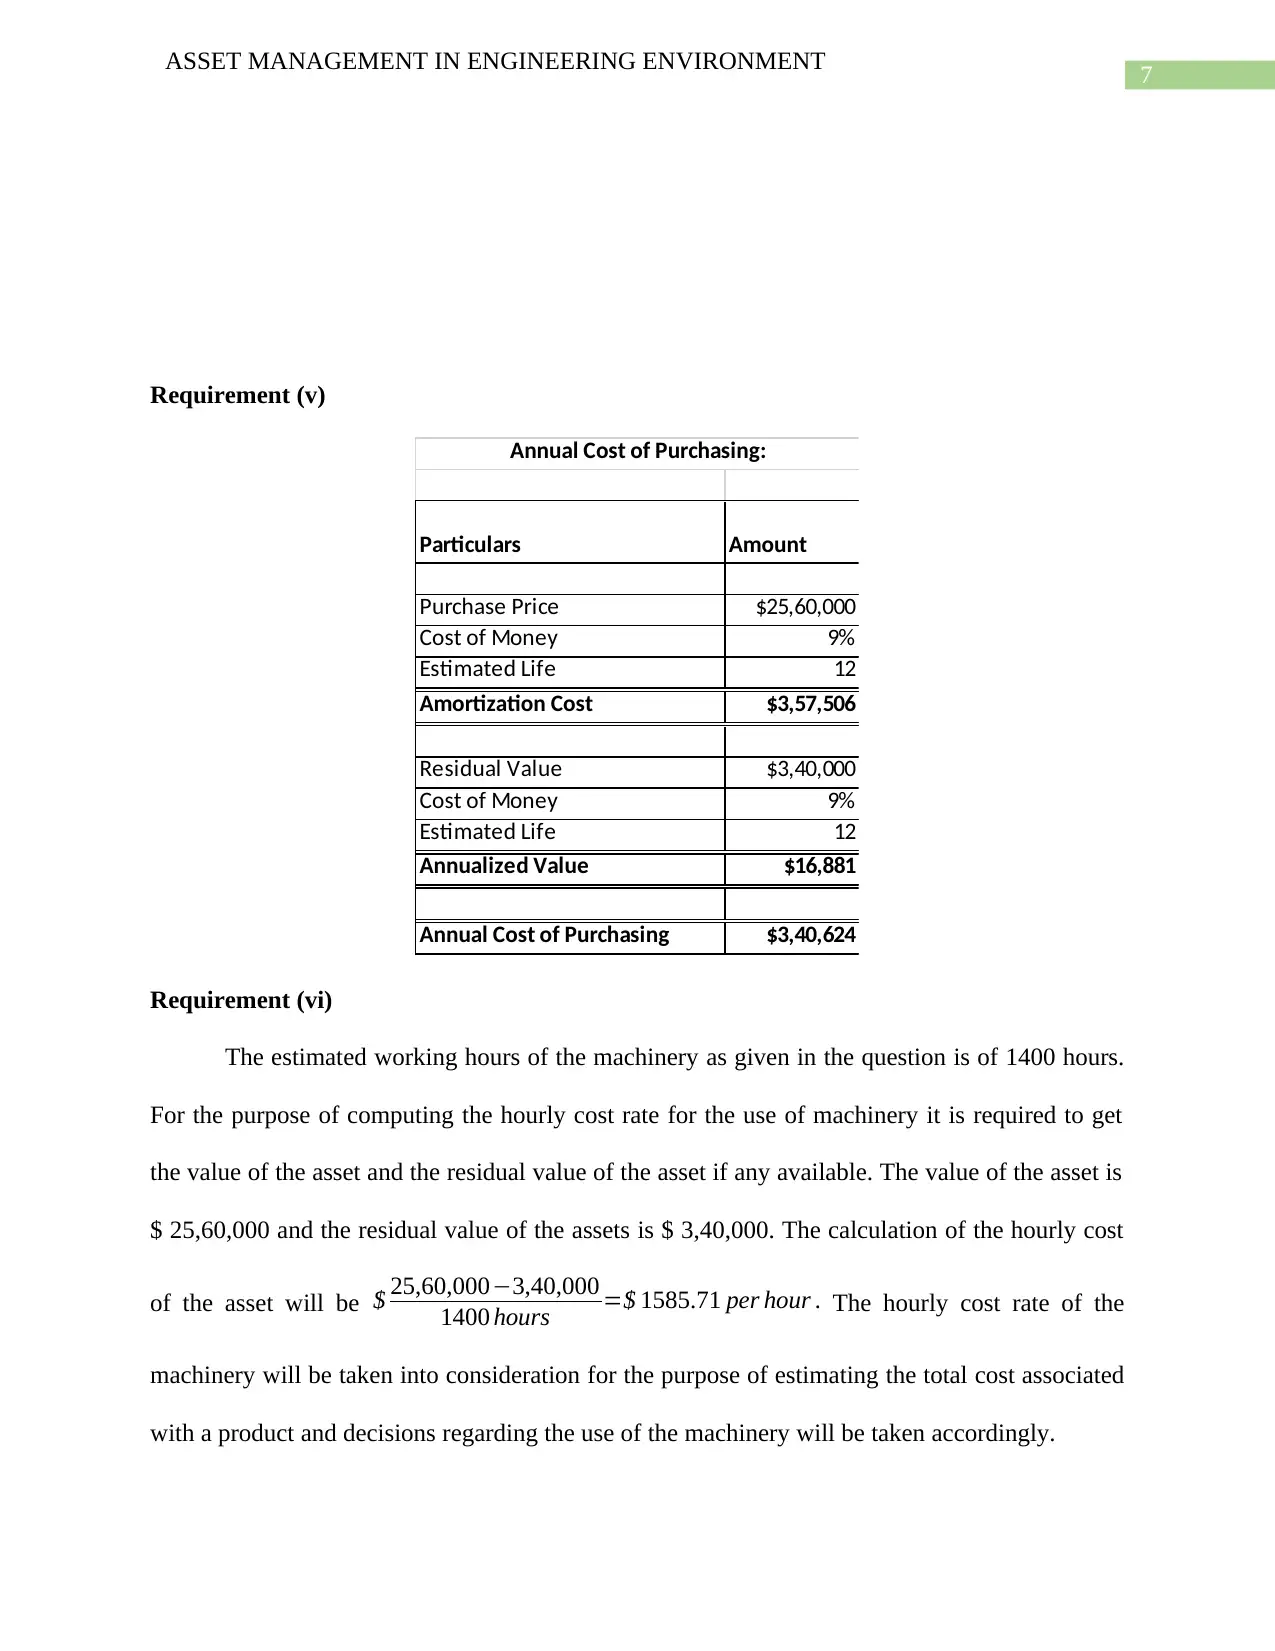
Requirement (v)
Particulars Amount
Purchase Price $25,60,000
Cost of Money 9%
Estimated Life 12
Amortization Cost $3,57,506
Residual Value $3,40,000
Cost of Money 9%
Estimated Life 12
Annualized Value $16,881
Annual Cost of Purchasing $3,40,624
Annual Cost of Purchasing:
Requirement (vi)
The estimated working hours of the machinery as given in the question is of 1400 hours.
For the purpose of computing the hourly cost rate for the use of machinery it is required to get
the value of the asset and the residual value of the asset if any available. The value of the asset is
$ 25,60,000 and the residual value of the assets is $ 3,40,000. The calculation of the hourly cost
of the asset will be $ 25,60,000−3,40,000
1400 hours =$ 1585.71 per hour . The hourly cost rate of the
machinery will be taken into consideration for the purpose of estimating the total cost associated
with a product and decisions regarding the use of the machinery will be taken accordingly.
ASSET MANAGEMENT IN ENGINEERING ENVIRONMENT
Requirement (v)
Particulars Amount
Purchase Price $25,60,000
Cost of Money 9%
Estimated Life 12
Amortization Cost $3,57,506
Residual Value $3,40,000
Cost of Money 9%
Estimated Life 12
Annualized Value $16,881
Annual Cost of Purchasing $3,40,624
Annual Cost of Purchasing:
Requirement (vi)
The estimated working hours of the machinery as given in the question is of 1400 hours.
For the purpose of computing the hourly cost rate for the use of machinery it is required to get
the value of the asset and the residual value of the asset if any available. The value of the asset is
$ 25,60,000 and the residual value of the assets is $ 3,40,000. The calculation of the hourly cost
of the asset will be $ 25,60,000−3,40,000
1400 hours =$ 1585.71 per hour . The hourly cost rate of the
machinery will be taken into consideration for the purpose of estimating the total cost associated
with a product and decisions regarding the use of the machinery will be taken accordingly.
8
ASSET MANAGEMENT IN ENGINEERING ENVIRONMENT
Requirement (vii)
The new alternative which is there also has a useful life of the asset and standard of
service which is similar to the existing asset. The company should not switch to the new
alternative which is available as it will be requiring additional investments which the company
needs to incur. In addition to this, the performance of the machinery might not be same as
existing one and this change might also alter the useful life of the asset.
Question 3
Part a
The assets which are to be purchased by the business needs to match the requirements of
the business. The purchasing decisions of an asset is determined by factors such a nature of the
asset, use of the asset, useful life of the asset, estimated salvage value of the asset. In addition to
this, the requirement of the business also plays a priority on the decisions about the purchasing of
an asset. In case of rehabilitation of an asset, the effect of such rehabilitation is to be considered
which will be on the asset. Such rehabilitation must be there so that the useful life of the asset
can be extended or the performance of the asset might be increased.
The problems which are faced by businesses to assess whether an asset is to be
purchased, rehabilitated or replaced depends on the alternative options which a business has for
the purpose of business. In case of asset replacement, the prospects of the alternative options are
considered by the use of NPV techniques and Capital Budgeting (Booth and Choudhary 2013).
The major thing which the management of the company needs to consider is that whether the
move of the business will result in increase in profitability of the business or operational
efficiency of the business. This can be done with the help of various techniques which are
available to the management of the business (Tian 2013). Another issue is that the additional cost
⊘ This is a preview!⊘
Do you want full access?
Subscribe today to unlock all pages.
Trusted by 1+ million students worldwide
9
ASSET MANAGEMENT IN ENGINEERING ENVIRONMENT
which the management has to incur die the implementation of the new policy which might be
relating to purchasing, rehabilitation and replacement of the machinery which is currently being
used by the business. Thus, it can be said that various factors affect the decisions of the business
for the purpose of decision making about the assets of the business (Pianosi et al. 2016).
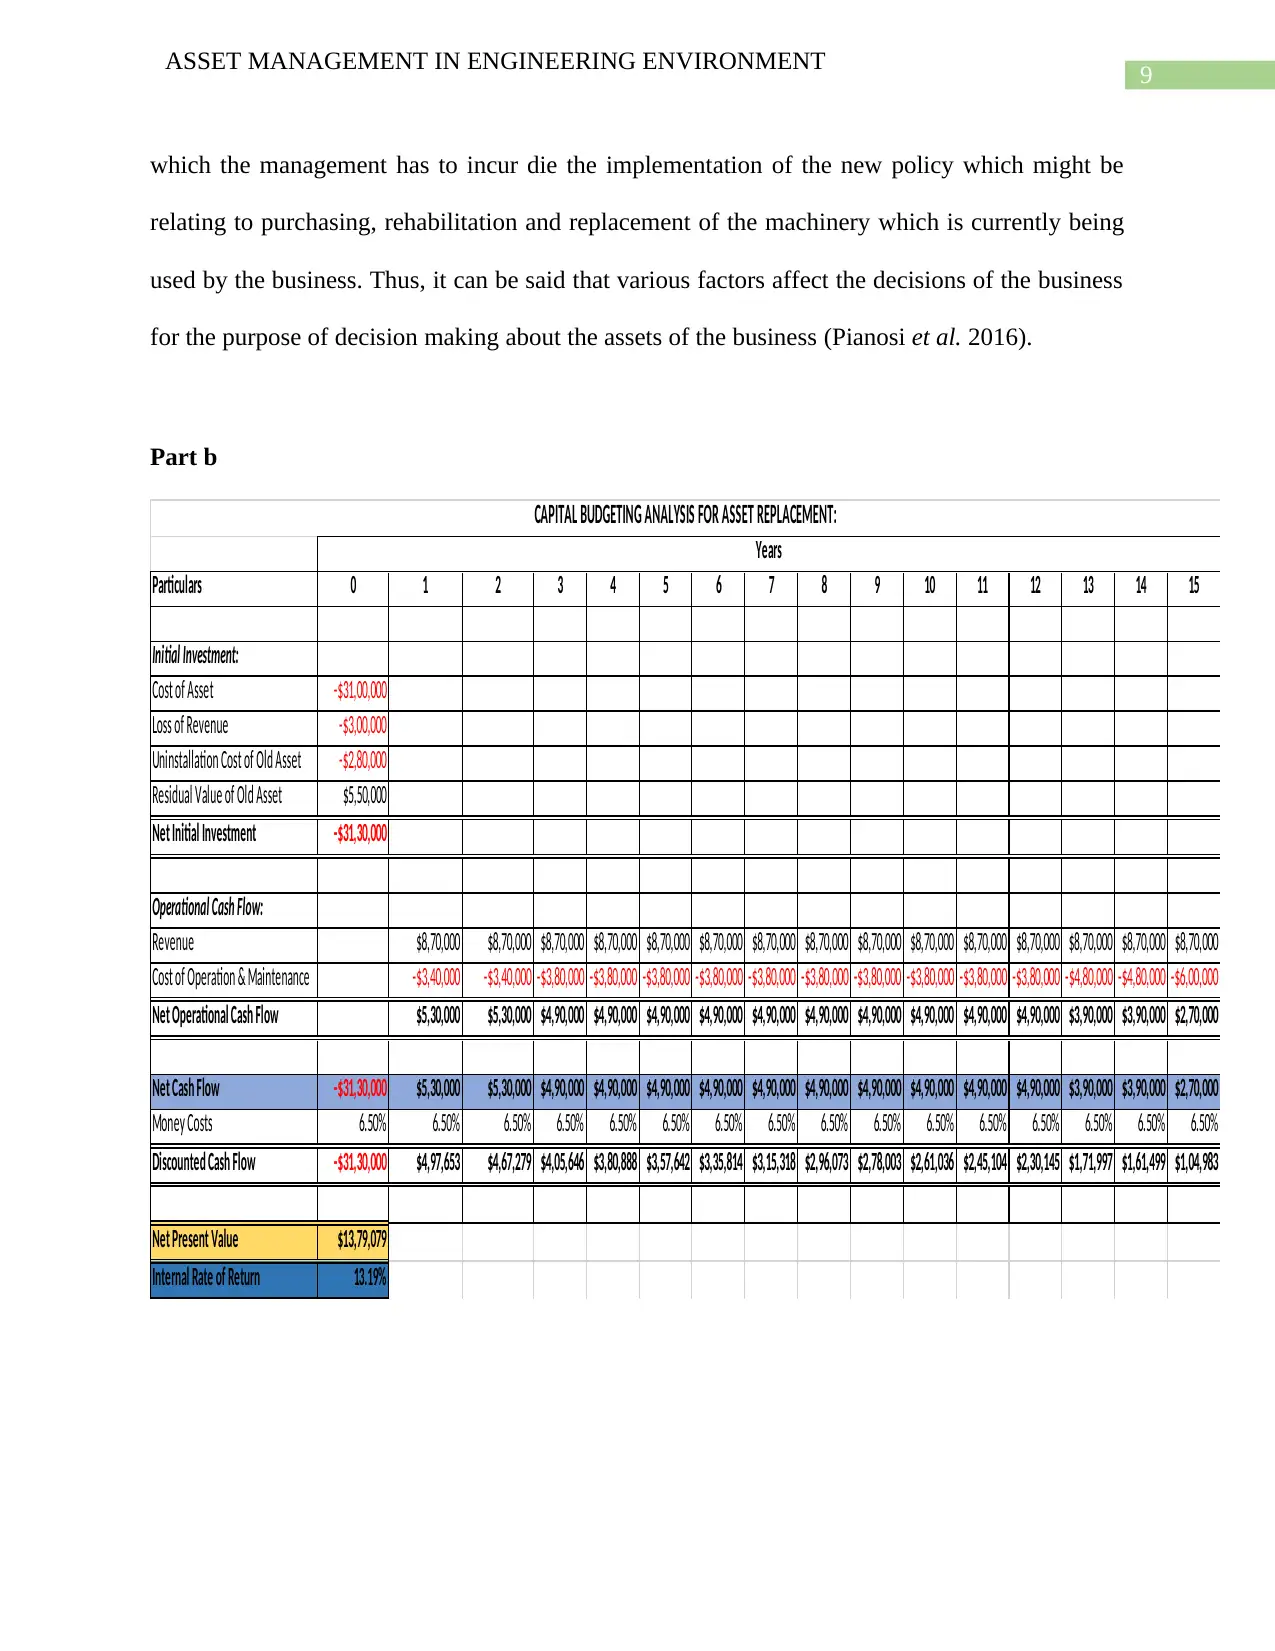
Part b
Particulars 0 1 2 3 4 5 6 7 8 9 10 11 12 13 14 15
Initial Investment:
Cost of Asset -$31,00,000
Loss of Revenue -$3,00,000
Uninstallation Cost of Old Asset -$2,80,000
Residual Value of Old Asset $5,50,000
Net Initial Investment -$31,30,000
Operational Cash Flow:
Revenue $8,70,000 $8,70,000 $8,70,000 $8,70,000 $8,70,000 $8,70,000 $8,70,000 $8,70,000 $8,70,000 $8,70,000 $8,70,000 $8,70,000 $8,70,000 $8,70,000 $8,70,000
Cost of Operation & Maintenance -$3,40,000 -$3,40,000 -$3,80,000 -$3,80,000 -$3,80,000 -$3,80,000 -$3,80,000 -$3,80,000 -$3,80,000 -$3,80,000 -$3,80,000 -$3,80,000 -$4,80,000 -$4,80,000 -$6,00,000
Net Operational Cash Flow $5,30,000 $5,30,000 $4,90,000 $4,90,000 $4,90,000 $4,90,000 $4,90,000 $4,90,000 $4,90,000 $4,90,000 $4,90,000 $4,90,000 $3,90,000 $3,90,000 $2,70,000
Net Cash Flow -$31,30,000 $5,30,000 $5,30,000 $4,90,000 $4,90,000 $4,90,000 $4,90,000 $4,90,000 $4,90,000 $4,90,000 $4,90,000 $4,90,000 $4,90,000 $3,90,000 $3,90,000 $2,70,000
Money Costs 6.50% 6.50% 6.50% 6.50% 6.50% 6.50% 6.50% 6.50% 6.50% 6.50% 6.50% 6.50% 6.50% 6.50% 6.50% 6.50%
Discounted Cash Flow -$31,30,000 $4,97,653 $4,67,279 $4,05,646 $3,80,888 $3,57,642 $3,35,814 $3,15,318 $2,96,073 $2,78,003 $2,61,036 $2,45,104 $2,30,145 $1,71,997 $1,61,499 $1,04,983
Net Present Value $13,79,079
Internal Rate of Return 13.19%
Years
CAPITAL BUDGETING ANALYSIS FOR ASSET REPLACEMENT:
ASSET MANAGEMENT IN ENGINEERING ENVIRONMENT
which the management has to incur die the implementation of the new policy which might be
relating to purchasing, rehabilitation and replacement of the machinery which is currently being
used by the business. Thus, it can be said that various factors affect the decisions of the business
for the purpose of decision making about the assets of the business (Pianosi et al. 2016).
Part b
Particulars 0 1 2 3 4 5 6 7 8 9 10 11 12 13 14 15
Initial Investment:
Cost of Asset -$31,00,000
Loss of Revenue -$3,00,000
Uninstallation Cost of Old Asset -$2,80,000
Residual Value of Old Asset $5,50,000
Net Initial Investment -$31,30,000
Operational Cash Flow:
Revenue $8,70,000 $8,70,000 $8,70,000 $8,70,000 $8,70,000 $8,70,000 $8,70,000 $8,70,000 $8,70,000 $8,70,000 $8,70,000 $8,70,000 $8,70,000 $8,70,000 $8,70,000
Cost of Operation & Maintenance -$3,40,000 -$3,40,000 -$3,80,000 -$3,80,000 -$3,80,000 -$3,80,000 -$3,80,000 -$3,80,000 -$3,80,000 -$3,80,000 -$3,80,000 -$3,80,000 -$4,80,000 -$4,80,000 -$6,00,000
Net Operational Cash Flow $5,30,000 $5,30,000 $4,90,000 $4,90,000 $4,90,000 $4,90,000 $4,90,000 $4,90,000 $4,90,000 $4,90,000 $4,90,000 $4,90,000 $3,90,000 $3,90,000 $2,70,000
Net Cash Flow -$31,30,000 $5,30,000 $5,30,000 $4,90,000 $4,90,000 $4,90,000 $4,90,000 $4,90,000 $4,90,000 $4,90,000 $4,90,000 $4,90,000 $4,90,000 $3,90,000 $3,90,000 $2,70,000
Money Costs 6.50% 6.50% 6.50% 6.50% 6.50% 6.50% 6.50% 6.50% 6.50% 6.50% 6.50% 6.50% 6.50% 6.50% 6.50% 6.50%
Discounted Cash Flow -$31,30,000 $4,97,653 $4,67,279 $4,05,646 $3,80,888 $3,57,642 $3,35,814 $3,15,318 $2,96,073 $2,78,003 $2,61,036 $2,45,104 $2,30,145 $1,71,997 $1,61,499 $1,04,983
Net Present Value $13,79,079
Internal Rate of Return 13.19%
Years
CAPITAL BUDGETING ANALYSIS FOR ASSET REPLACEMENT:
Paraphrase This Document
Need a fresh take? Get an instant paraphrase of this document with our AI Paraphraser
10
ASSET MANAGEMENT IN ENGINEERING ENVIRONMENT
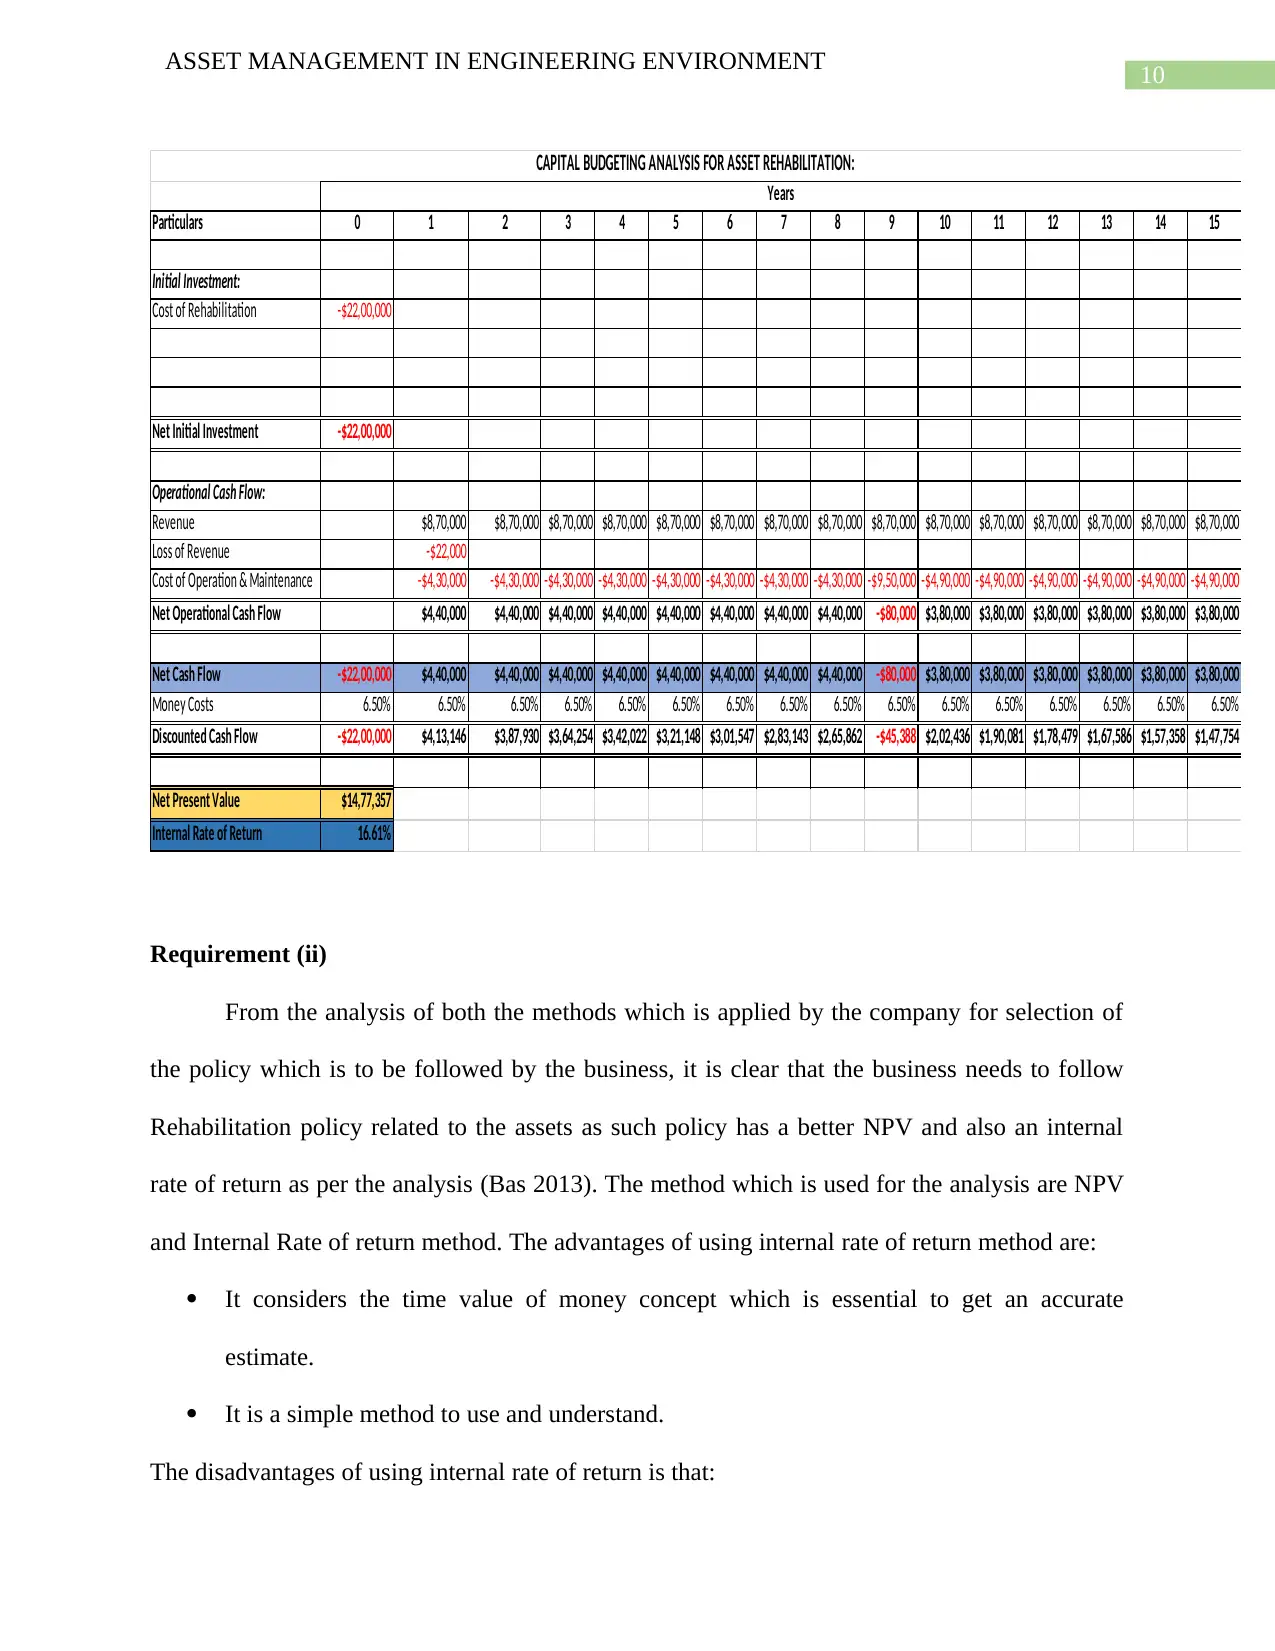
Particulars 0 1 2 3 4 5 6 7 8 9 10 11 12 13 14 15
Initial Investment:
Cost of Rehabilitation -$22,00,000
Net Initial Investment -$22,00,000
Operational Cash Flow:
Revenue $8,70,000 $8,70,000 $8,70,000 $8,70,000 $8,70,000 $8,70,000 $8,70,000 $8,70,000 $8,70,000 $8,70,000 $8,70,000 $8,70,000 $8,70,000 $8,70,000 $8,70,000
Loss of Revenue -$22,000
Cost of Operation & Maintenance -$4,30,000 -$4,30,000 -$4,30,000 -$4,30,000 -$4,30,000 -$4,30,000 -$4,30,000 -$4,30,000 -$9,50,000 -$4,90,000 -$4,90,000 -$4,90,000 -$4,90,000 -$4,90,000 -$4,90,000
Net Operational Cash Flow $4,40,000 $4,40,000 $4,40,000 $4,40,000 $4,40,000 $4,40,000 $4,40,000 $4,40,000 -$80,000 $3,80,000 $3,80,000 $3,80,000 $3,80,000 $3,80,000 $3,80,000
Net Cash Flow -$22,00,000 $4,40,000 $4,40,000 $4,40,000 $4,40,000 $4,40,000 $4,40,000 $4,40,000 $4,40,000 -$80,000 $3,80,000 $3,80,000 $3,80,000 $3,80,000 $3,80,000 $3,80,000
Money Costs 6.50% 6.50% 6.50% 6.50% 6.50% 6.50% 6.50% 6.50% 6.50% 6.50% 6.50% 6.50% 6.50% 6.50% 6.50% 6.50%
Discounted Cash Flow -$22,00,000 $4,13,146 $3,87,930 $3,64,254 $3,42,022 $3,21,148 $3,01,547 $2,83,143 $2,65,862 -$45,388 $2,02,436 $1,90,081 $1,78,479 $1,67,586 $1,57,358 $1,47,754
Net Present Value $14,77,357
Internal Rate of Return 16.61%
CAPITAL BUDGETING ANALYSIS FOR ASSET REHABILITATION:
Years
Requirement (ii)
From the analysis of both the methods which is applied by the company for selection of
the policy which is to be followed by the business, it is clear that the business needs to follow
Rehabilitation policy related to the assets as such policy has a better NPV and also an internal
rate of return as per the analysis (Bas 2013). The method which is used for the analysis are NPV
and Internal Rate of return method. The advantages of using internal rate of return method are:
It considers the time value of money concept which is essential to get an accurate
estimate.
It is a simple method to use and understand.
The disadvantages of using internal rate of return is that:
ASSET MANAGEMENT IN ENGINEERING ENVIRONMENT
Particulars 0 1 2 3 4 5 6 7 8 9 10 11 12 13 14 15
Initial Investment:
Cost of Rehabilitation -$22,00,000
Net Initial Investment -$22,00,000
Operational Cash Flow:
Revenue $8,70,000 $8,70,000 $8,70,000 $8,70,000 $8,70,000 $8,70,000 $8,70,000 $8,70,000 $8,70,000 $8,70,000 $8,70,000 $8,70,000 $8,70,000 $8,70,000 $8,70,000
Loss of Revenue -$22,000
Cost of Operation & Maintenance -$4,30,000 -$4,30,000 -$4,30,000 -$4,30,000 -$4,30,000 -$4,30,000 -$4,30,000 -$4,30,000 -$9,50,000 -$4,90,000 -$4,90,000 -$4,90,000 -$4,90,000 -$4,90,000 -$4,90,000
Net Operational Cash Flow $4,40,000 $4,40,000 $4,40,000 $4,40,000 $4,40,000 $4,40,000 $4,40,000 $4,40,000 -$80,000 $3,80,000 $3,80,000 $3,80,000 $3,80,000 $3,80,000 $3,80,000
Net Cash Flow -$22,00,000 $4,40,000 $4,40,000 $4,40,000 $4,40,000 $4,40,000 $4,40,000 $4,40,000 $4,40,000 -$80,000 $3,80,000 $3,80,000 $3,80,000 $3,80,000 $3,80,000 $3,80,000
Money Costs 6.50% 6.50% 6.50% 6.50% 6.50% 6.50% 6.50% 6.50% 6.50% 6.50% 6.50% 6.50% 6.50% 6.50% 6.50% 6.50%
Discounted Cash Flow -$22,00,000 $4,13,146 $3,87,930 $3,64,254 $3,42,022 $3,21,148 $3,01,547 $2,83,143 $2,65,862 -$45,388 $2,02,436 $1,90,081 $1,78,479 $1,67,586 $1,57,358 $1,47,754
Net Present Value $14,77,357
Internal Rate of Return 16.61%
CAPITAL BUDGETING ANALYSIS FOR ASSET REHABILITATION:
Years
Requirement (ii)
From the analysis of both the methods which is applied by the company for selection of
the policy which is to be followed by the business, it is clear that the business needs to follow
Rehabilitation policy related to the assets as such policy has a better NPV and also an internal
rate of return as per the analysis (Bas 2013). The method which is used for the analysis are NPV
and Internal Rate of return method. The advantages of using internal rate of return method are:
It considers the time value of money concept which is essential to get an accurate
estimate.
It is a simple method to use and understand.
The disadvantages of using internal rate of return is that:
11
ASSET MANAGEMENT IN ENGINEERING ENVIRONMENT
The concept of economies of scale is ignored in the method.
The assumptions which are taken in the IRR approach may not be accurate and
impractical (Magni 2013).
The method is not suitable for analysis of two different types of project which have
different policies.
The advantages of using NPV analysis in estimation are given below:
The method takes into consideration the concept of time value of money.
The method is very useful in estimating the cost analysis of a project and reveals whether
an investment will create value or not (Zhou et al. 2015).
The disadvantages of using NPV are given below:
The method assumes cost of capital information and the method is not useful for analysis
of business in different sized of budget.
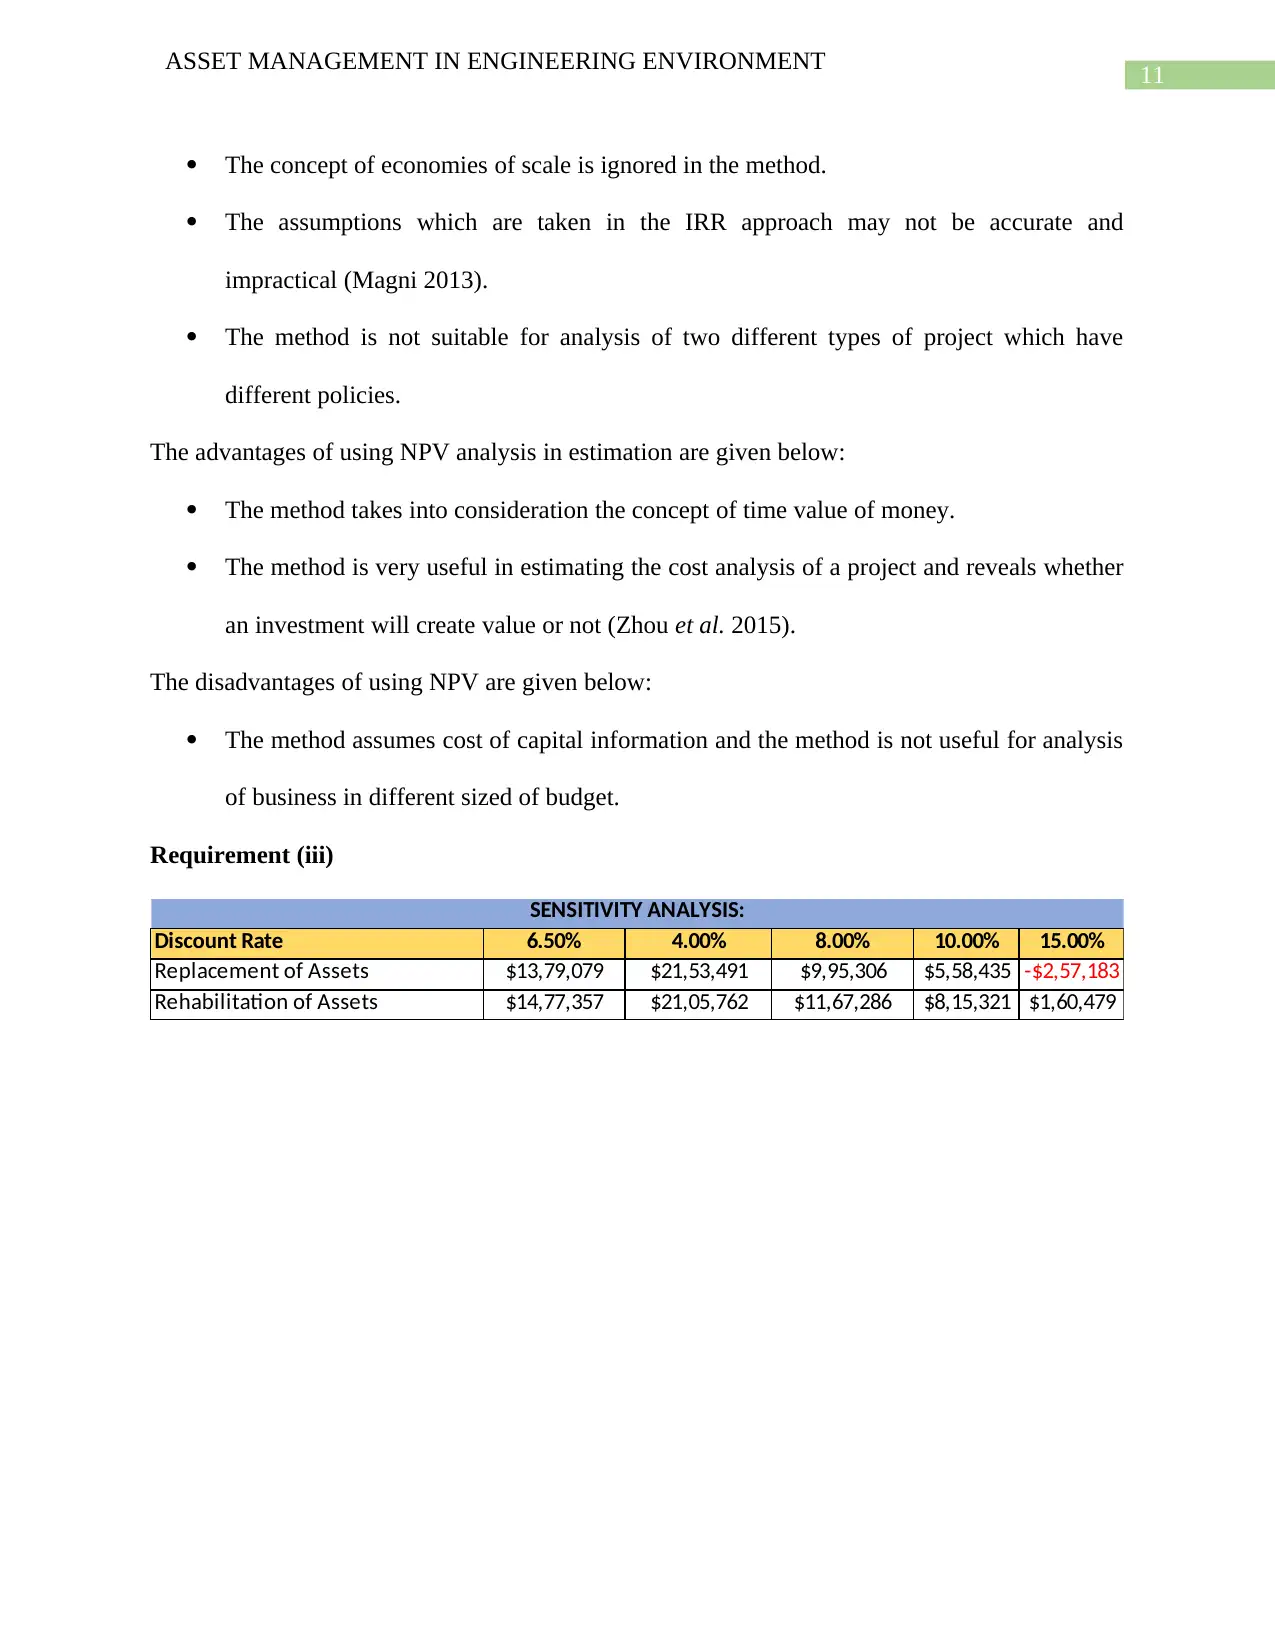
Requirement (iii)
Discount Rate 6.50% 4.00% 8.00% 10.00% 15.00%
Replacement of Assets $13,79,079 $21,53,491 $9,95,306 $5,58,435 -$2,57,183
Rehabilitation of Assets $14,77,357 $21,05,762 $11,67,286 $8,15,321 $1,60,479
SENSITIVITY ANALYSIS:
ASSET MANAGEMENT IN ENGINEERING ENVIRONMENT
The concept of economies of scale is ignored in the method.
The assumptions which are taken in the IRR approach may not be accurate and
impractical (Magni 2013).
The method is not suitable for analysis of two different types of project which have
different policies.
The advantages of using NPV analysis in estimation are given below:
The method takes into consideration the concept of time value of money.
The method is very useful in estimating the cost analysis of a project and reveals whether
an investment will create value or not (Zhou et al. 2015).
The disadvantages of using NPV are given below:
The method assumes cost of capital information and the method is not useful for analysis
of business in different sized of budget.
Requirement (iii)
Discount Rate 6.50% 4.00% 8.00% 10.00% 15.00%
Replacement of Assets $13,79,079 $21,53,491 $9,95,306 $5,58,435 -$2,57,183
Rehabilitation of Assets $14,77,357 $21,05,762 $11,67,286 $8,15,321 $1,60,479
SENSITIVITY ANALYSIS:
⊘ This is a preview!⊘
Do you want full access?
Subscribe today to unlock all pages.
Trusted by 1+ million students worldwide
1 out of 17
Related Documents


Your All-in-One AI-Powered Toolkit for Academic Success.
+13062052269
info@desklib.com
Available 24*7 on WhatsApp / Email
![[object Object]](/_next/static/media/star-bottom.7253800d.svg)
Unlock your academic potential
Copyright © 2020–2026 A2Z Services. All Rights Reserved. Developed and managed by ZUCOL.