Analyzing Fletcher Building's Liquidity and Solvency Ratios
VerifiedAdded on 2020/04/21
|18
|2737
|137
AI Summary
The report presents a comprehensive analysis of Fletcher Building’s financial health from 2013 to 2017. Key aspects covered include profitability measures such as return on assets and equity, alongside the company's leverage through EBIT/Interest metrics. Liquidity is examined using ratios like current and quick ratios, while inventory turnover provides insights into operational efficiency. Furthermore, solvency analysis involves debt-to-equity comparisons and interest coverage evaluations. Market-based assessments are made with price-earnings and dividend yield considerations. The findings suggest varied performance across different years, highlighting the need for strategic financial management to enhance Fletcher Building's market position.
RUNNING HEAD: Fletcher Building Company
1
Name of the student
Topic- Business analysis of Fletcher Building Company
University name-
1
Name of the student
Topic- Business analysis of Fletcher Building Company
University name-
Paraphrase This Document
Need a fresh take? Get an instant paraphrase of this document with our AI Paraphraser
Business analysis of Fletcher Building Company
2
Executive summary
This report has reflected key understanding on the business performance of the Fletcher
building company working in New Zealand. This report provides the financial and business
performance of the organization which reflects whether this company could create value or not in
this present business environment. The methodologies used in this report reflect that investors
should invest their capital in the business of company only when they want to create long term
value creation. If they invest for short run then it will destroy the value of their capital. In the
end, conclusion shows the quality and impact of core competency of business in the given
market segment.
Business analysis of Fletcher Building Company
3
Table of Contents
Executive summary............................................................................................................2
Introduction.......................................................................................................................3
Present description of company........................................................................................3
Project report objectives....................................................................................................3
Methodologies...................................................................................................................5
Balance score card of Centaur Media.................................................................................5
Financial analysis of Fletcher Building Company................................................................6
Finding............................................................................................................................... 7
Financial analysis derived and trend of Fletcher Building Company..................................9
Analysis and interpretation..............................................................................................10
Discussion and explanation of BSC and the Map (Why it is used)....................................11
Recommendation.............................................................................................................11
Conclusion........................................................................................................................13
References....................................................................................................................... 14
⊘ This is a preview!⊘
Do you want full access?
Subscribe today to unlock all pages.
Trusted by 1+ million students worldwide
Business analysis of Fletcher Building Company
4
Introduction
With the ramified economic changes and complex business functioning, each and every
business is performing innovative and creative process to earn profit. This report is completed in
various parts such as in the starting of the part brief introduction about the business and after that
methodologies have been used to critically evaluate the business performance of the
organization. After that finding and interpretation of the calculated data have been taken into
consideration. In the end of the report, conclusion have been drawn to determine whether
company has been performing well or not in current business functioning. Shareholders and
other investors could use this report to make their investment decision. The annual report of the
Fletcher Company has been used to prepare this report
Present description of company
Fletcher Building Company is one of the largest listed companies in New Zealand,
having a market capitalization of over NZ $ 5 billion. It is an integrated manufacture and
distributors of world-leading building and construction Service Company. This company has
been running its business on international level (Fletcher building Company, 2016).
Project report objectives
These objectives of the Fletcher Building Company are based on the key intents of the
business process such as specific, measurement, accurate, relevance and time.
Paraphrase This Document
Need a fresh take? Get an instant paraphrase of this document with our AI Paraphraser
Business analysis of Fletcher Building Company
5
Specific- This report helps in identifying the core intents of business performance of
Fletcher Company.
Measurable- Implement analysis process to compute the financial trend of company
Accuracy- It will help in gauging the financial performance and business effectiveness in
accurate manner by using annual report of company.
Relevancy- It will increase the overall understanding to set targets and goals for
organization.
Time- The proposed study will take time of around 1 month action plan to complete this
report (Bloomberg, 2017).
Business analysis of Fletcher Building Company
6
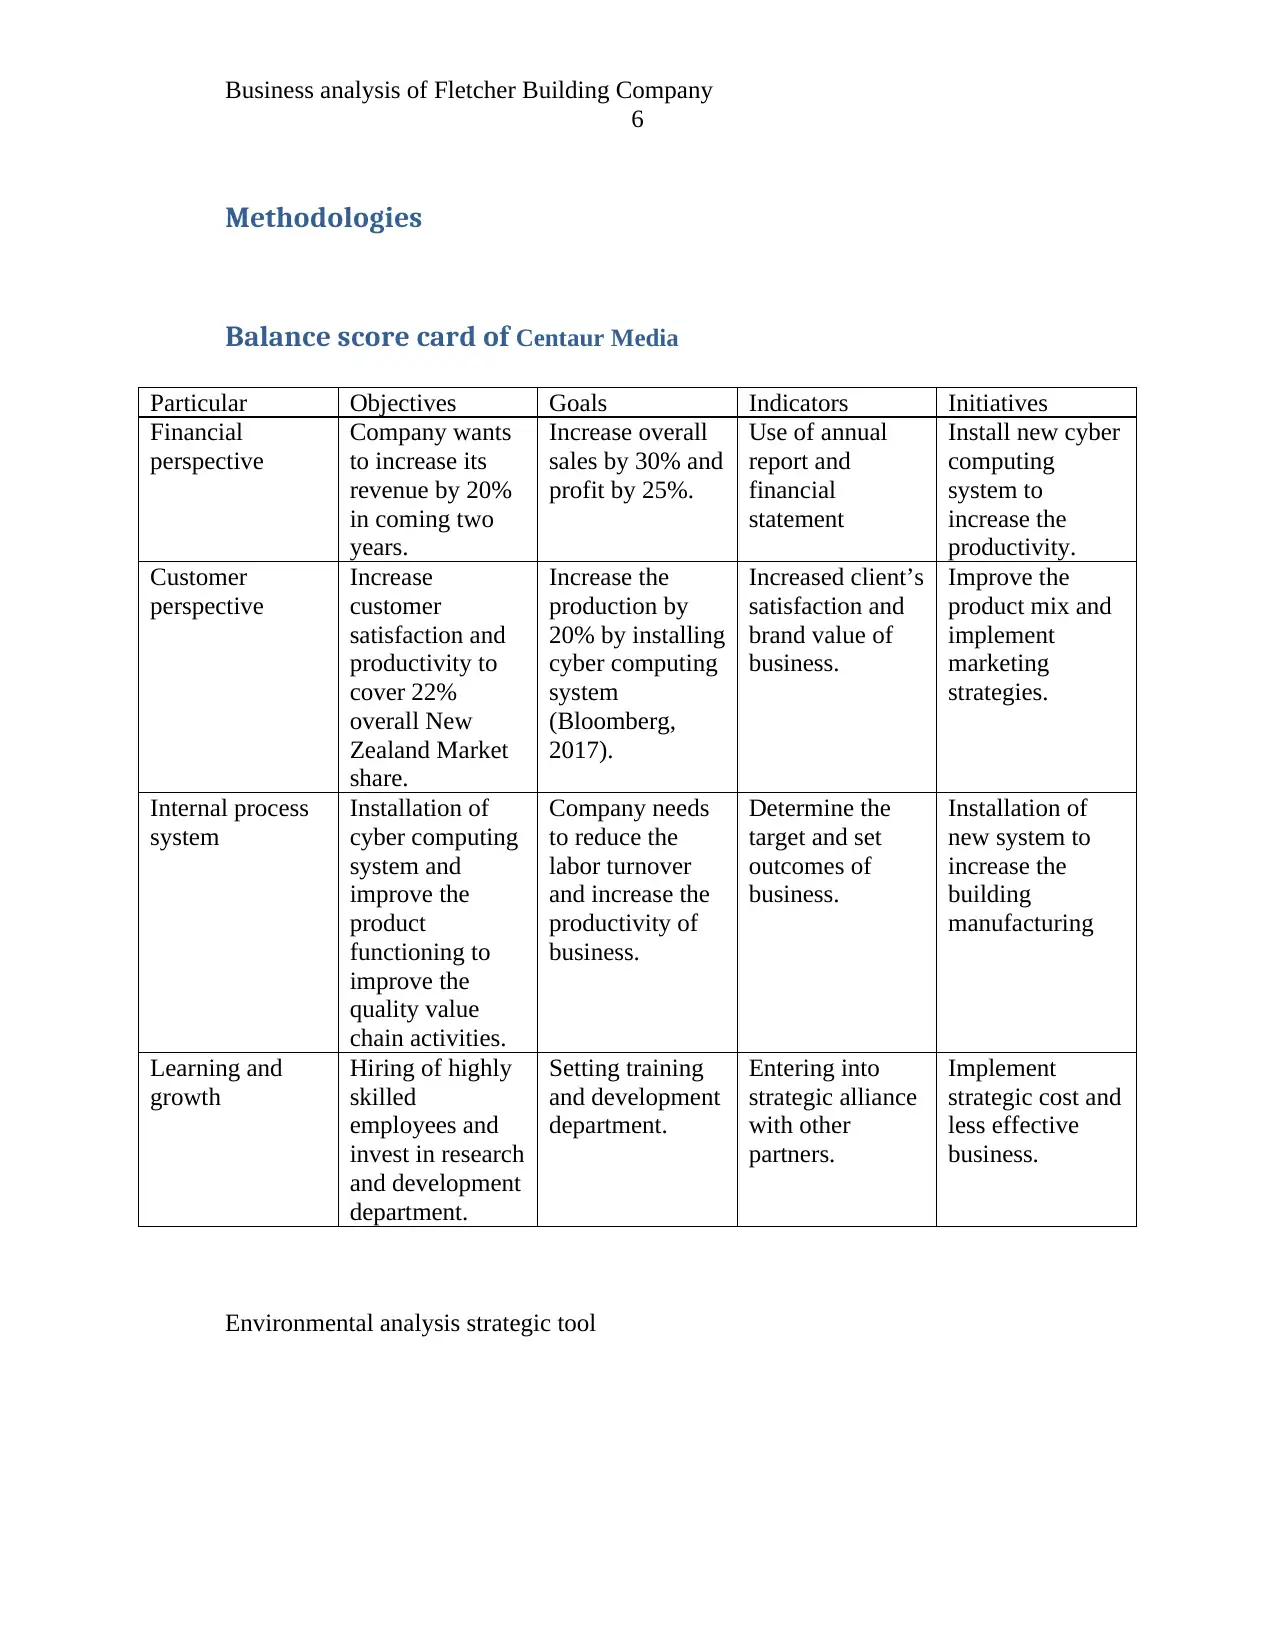
Methodologies
Balance score card of Centaur Media
Particular Objectives Goals Indicators Initiatives
Financial
perspective
Company wants
to increase its
revenue by 20%
in coming two
years.
Increase overall
sales by 30% and
profit by 25%.
Use of annual
report and
financial
statement
Install new cyber
computing
system to
increase the
productivity.
Customer
perspective
Increase
customer
satisfaction and
productivity to
cover 22%
overall New
Zealand Market
share.
Increase the
production by
20% by installing
cyber computing
system
(Bloomberg,
2017).
Increased client’s
satisfaction and
brand value of
business.
Improve the
product mix and
implement
marketing
strategies.
Internal process
system
Installation of
cyber computing
system and
improve the
product
functioning to
improve the
quality value
chain activities.
Company needs
to reduce the
labor turnover
and increase the
productivity of
business.
Determine the
target and set
outcomes of
business.
Installation of
new system to
increase the
building
manufacturing
Learning and
growth
Hiring of highly
skilled
employees and
invest in research
and development
department.
Setting training
and development
department.
Entering into
strategic alliance
with other
partners.
Implement
strategic cost and
less effective
business.
Environmental analysis strategic tool
6
Methodologies
Balance score card of Centaur Media
Particular Objectives Goals Indicators Initiatives
Financial
perspective
Company wants
to increase its
revenue by 20%
in coming two
years.
Increase overall
sales by 30% and
profit by 25%.
Use of annual
report and
financial
statement
Install new cyber
computing
system to
increase the
productivity.
Customer
perspective
Increase
customer
satisfaction and
productivity to
cover 22%
overall New
Zealand Market
share.
Increase the
production by
20% by installing
cyber computing
system
(Bloomberg,
2017).
Increased client’s
satisfaction and
brand value of
business.
Improve the
product mix and
implement
marketing
strategies.
Internal process
system
Installation of
cyber computing
system and
improve the
product
functioning to
improve the
quality value
chain activities.
Company needs
to reduce the
labor turnover
and increase the
productivity of
business.
Determine the
target and set
outcomes of
business.
Installation of
new system to
increase the
building
manufacturing
Learning and
growth
Hiring of highly
skilled
employees and
invest in research
and development
department.
Setting training
and development
department.
Entering into
strategic alliance
with other
partners.
Implement
strategic cost and
less effective
business.
Environmental analysis strategic tool
⊘ This is a preview!⊘
Do you want full access?
Subscribe today to unlock all pages.
Trusted by 1+ million students worldwide
Business analysis of Fletcher Building Company
7
This Environmental analysis strategic tool of Fletcher Building Company reflects that
company needs to implement effective business functioning if it wants to increase its overall
revenue and turnover.
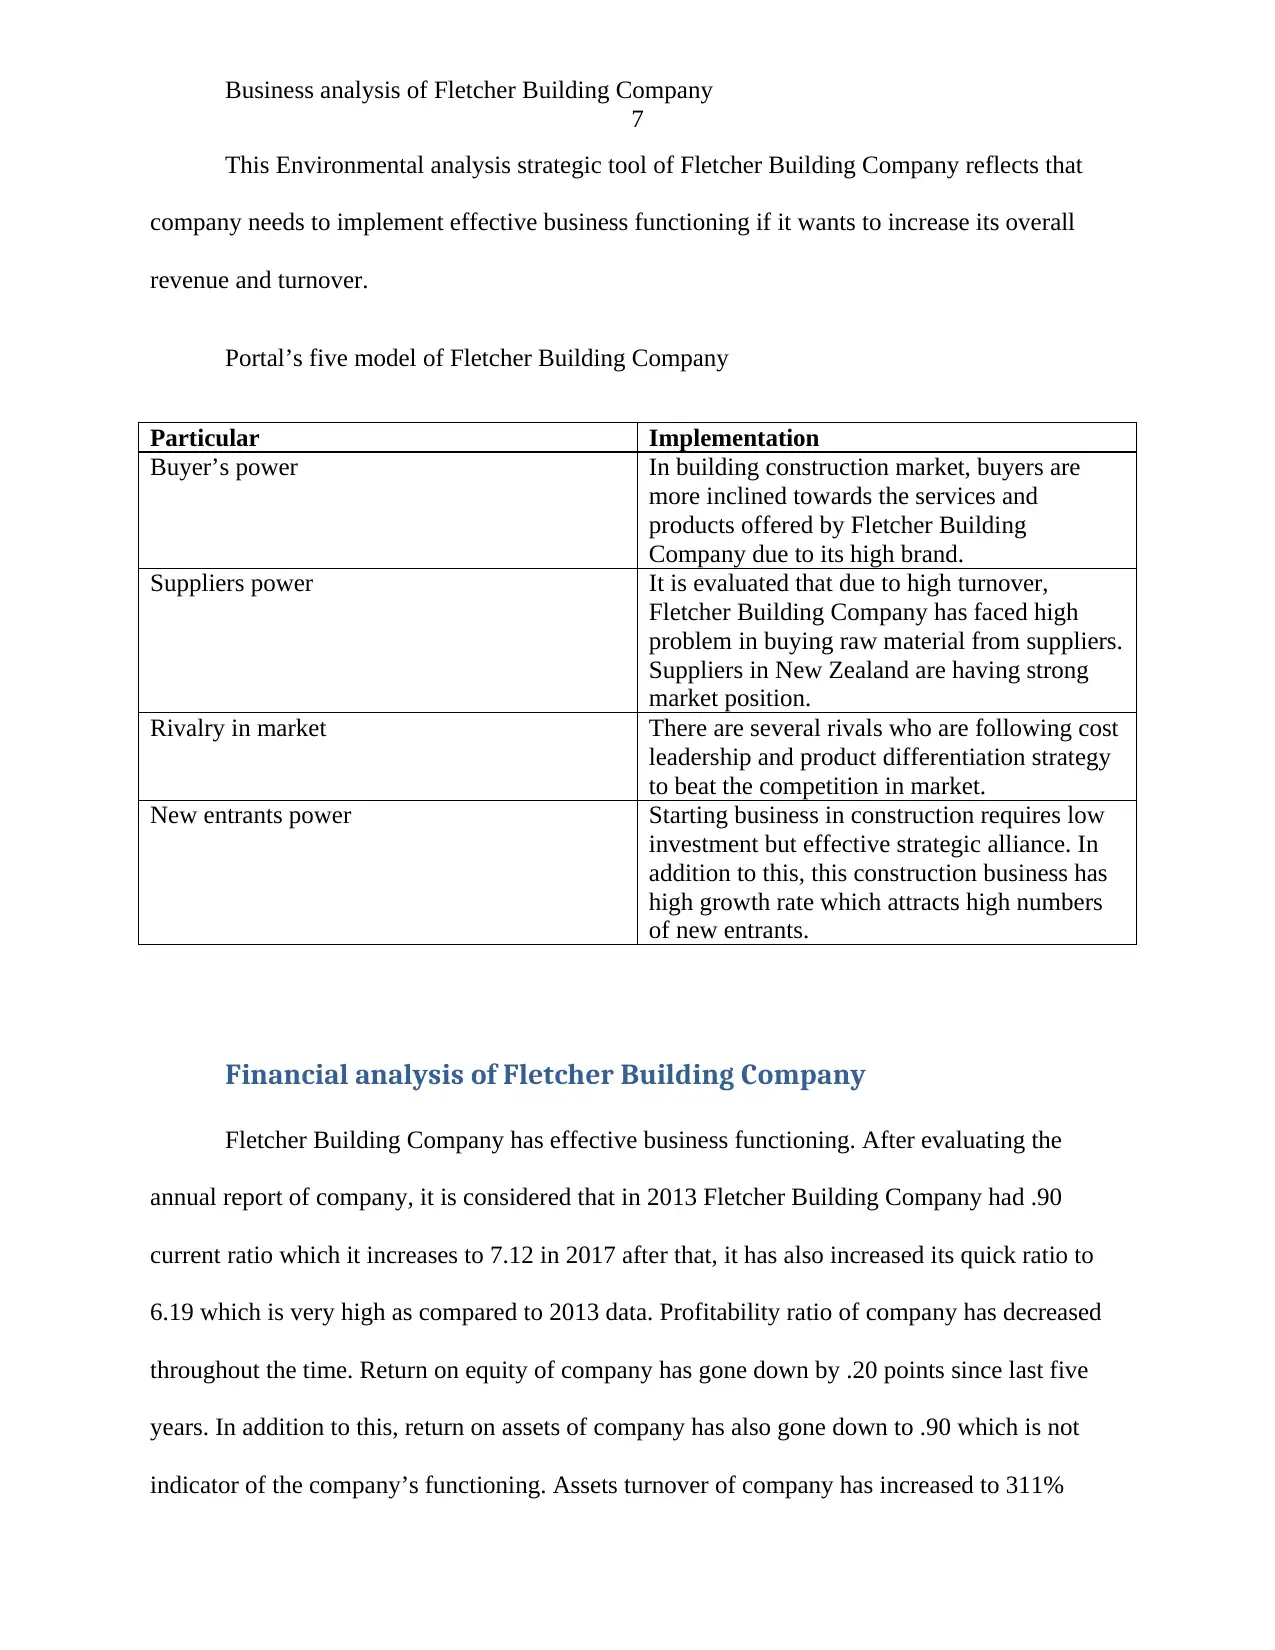
Portal’s five model of Fletcher Building Company
Particular Implementation
Buyer’s power In building construction market, buyers are
more inclined towards the services and
products offered by Fletcher Building
Company due to its high brand.
Suppliers power It is evaluated that due to high turnover,
Fletcher Building Company has faced high
problem in buying raw material from suppliers.
Suppliers in New Zealand are having strong
market position.
Rivalry in market There are several rivals who are following cost
leadership and product differentiation strategy
to beat the competition in market.
New entrants power Starting business in construction requires low
investment but effective strategic alliance. In
addition to this, this construction business has
high growth rate which attracts high numbers
of new entrants.
Financial analysis of Fletcher Building Company
Fletcher Building Company has effective business functioning. After evaluating the
annual report of company, it is considered that in 2013 Fletcher Building Company had .90
current ratio which it increases to 7.12 in 2017 after that, it has also increased its quick ratio to
6.19 which is very high as compared to 2013 data. Profitability ratio of company has decreased
throughout the time. Return on equity of company has gone down by .20 points since last five
years. In addition to this, return on assets of company has also gone down to .90 which is not
indicator of the company’s functioning. Assets turnover of company has increased to 311%
7
This Environmental analysis strategic tool of Fletcher Building Company reflects that
company needs to implement effective business functioning if it wants to increase its overall
revenue and turnover.
Portal’s five model of Fletcher Building Company
Particular Implementation
Buyer’s power In building construction market, buyers are
more inclined towards the services and
products offered by Fletcher Building
Company due to its high brand.
Suppliers power It is evaluated that due to high turnover,
Fletcher Building Company has faced high
problem in buying raw material from suppliers.
Suppliers in New Zealand are having strong
market position.
Rivalry in market There are several rivals who are following cost
leadership and product differentiation strategy
to beat the competition in market.
New entrants power Starting business in construction requires low
investment but effective strategic alliance. In
addition to this, this construction business has
high growth rate which attracts high numbers
of new entrants.
Financial analysis of Fletcher Building Company
Fletcher Building Company has effective business functioning. After evaluating the
annual report of company, it is considered that in 2013 Fletcher Building Company had .90
current ratio which it increases to 7.12 in 2017 after that, it has also increased its quick ratio to
6.19 which is very high as compared to 2013 data. Profitability ratio of company has decreased
throughout the time. Return on equity of company has gone down by .20 points since last five
years. In addition to this, return on assets of company has also gone down to .90 which is not
indicator of the company’s functioning. Assets turnover of company has increased to 311%
Paraphrase This Document
Need a fresh take? Get an instant paraphrase of this document with our AI Paraphraser
Business analysis of Fletcher Building Company
8
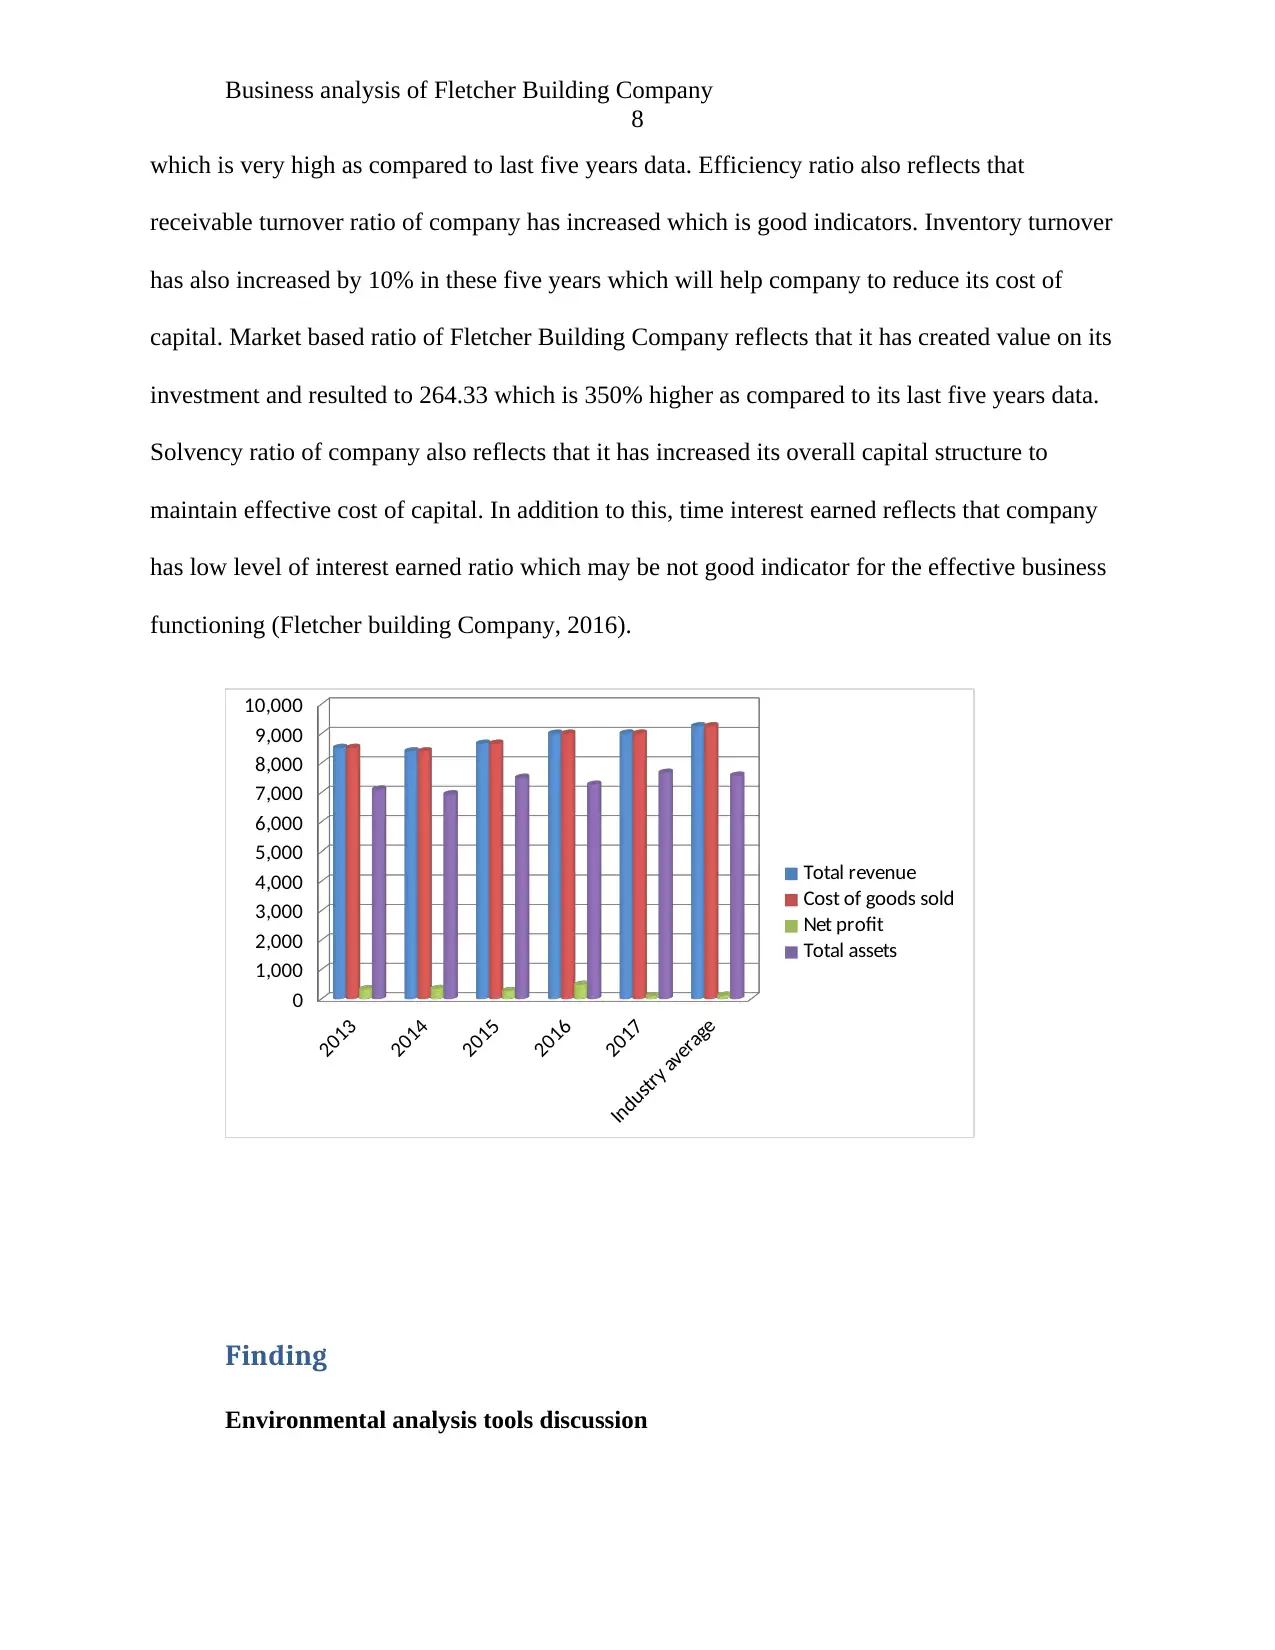
which is very high as compared to last five years data. Efficiency ratio also reflects that
receivable turnover ratio of company has increased which is good indicators. Inventory turnover
has also increased by 10% in these five years which will help company to reduce its cost of
capital. Market based ratio of Fletcher Building Company reflects that it has created value on its
investment and resulted to 264.33 which is 350% higher as compared to its last five years data.
Solvency ratio of company also reflects that it has increased its overall capital structure to
maintain effective cost of capital. In addition to this, time interest earned reflects that company
has low level of interest earned ratio which may be not good indicator for the effective business
functioning (Fletcher building Company, 2016).
2013
2014
2015
2016
2017
Industry average
0
1,000
2,000
3,000
4,000
5,000
6,000
7,000
8,000
9,000
10,000
Total revenue
Cost of goods sold
Net profit
Total assets
Finding
Environmental analysis tools discussion
8
which is very high as compared to last five years data. Efficiency ratio also reflects that
receivable turnover ratio of company has increased which is good indicators. Inventory turnover
has also increased by 10% in these five years which will help company to reduce its cost of
capital. Market based ratio of Fletcher Building Company reflects that it has created value on its
investment and resulted to 264.33 which is 350% higher as compared to its last five years data.
Solvency ratio of company also reflects that it has increased its overall capital structure to
maintain effective cost of capital. In addition to this, time interest earned reflects that company
has low level of interest earned ratio which may be not good indicator for the effective business
functioning (Fletcher building Company, 2016).
2013
2014
2015
2016
2017
Industry average
0
1,000
2,000
3,000
4,000
5,000
6,000
7,000
8,000
9,000
10,000
Total revenue
Cost of goods sold
Net profit
Total assets
Finding
Environmental analysis tools discussion
Business analysis of Fletcher Building Company
9
Fletcher Building Company has set up specific objective to increase its overall business
productivity in determined approach. It has set up target to achieve at least 24% market share in
New Zealand and increase its overall turnover by 40% in coming 5 years.
Fletcher Building Company has measurement to cut down its overall cost to terminate its other
units which is giving less amount of output. This level of strategic program and cost reducing
strategies will give an advantage to increase its overall profit.
Fletcher Building Company has incorporated a business process in which accurate set
measurement is identified. All the cost and price determination is based on the inventory
management policies and cost of the capital of the organization. Fletcher Building Company has
determined its product sells price after including 20% profit margin in its cost of production.
This has shown the accuracy of the price of the products sold in organization (Brigham &
Ehrhardt, 2013).
It has to design its price of the products very low with a view to increase its overall sales. It has
relevancy with the cost of the production and offered products price of the rivals. Fletcher
Building Company has kept low price of its offered product for the relevancy of its cost
leadership strategy.
Fletcher Building Company has planned its action plan to deliver its business process to increase
the effectiveness of its business. It has developed its core competency to increase the overall
productivity by reducing the overall time involved in business.
Discussion criteria
⊘ This is a preview!⊘
Do you want full access?
Subscribe today to unlock all pages.
Trusted by 1+ million students worldwide
Business analysis of Fletcher Building Company
10
Feasibility- All the data and financial information of Fletcher is based on the ratio
analysis implemented on the data shown in annual report of company.
Acceptability- Financial statement of Fletcher has been prepared by following domestic
and IFRS accounting standards. It increase its acceptability on international level
Quality- All this financial and business information will assist students to make a final
judgment on the performance of company.
Reversibility- This solution developed is relevant and in case of failure to draw effective
conclusion will give idea to student to implement another analysis tool.
Ethics- All the data or work done in this presentation is plagiarism free and only relevant
and truthful contents have been used in this presentation.
Cost- preparing this presentation will be accompanied by very low cost due to easy and
free access to annual report of company.
Financial analysis derived and trend of Fletcher Building Company
It has been observed that company will increase its all of its productivity and net profit
by at least 250% in coming next three years.
Paraphrase This Document
Need a fresh take? Get an instant paraphrase of this document with our AI Paraphraser
Business analysis of Fletcher Building Company
11
2013
2014
2015
2016
2017
2018
2019
2020
Industry average
(Fletcher Building company financial data NZD
in Million except per share data)
0
2,000
4,000
6,000
8,000
10,000
Total revenue
Cost of goods sold
Gross profit
Operating profit
Net profit
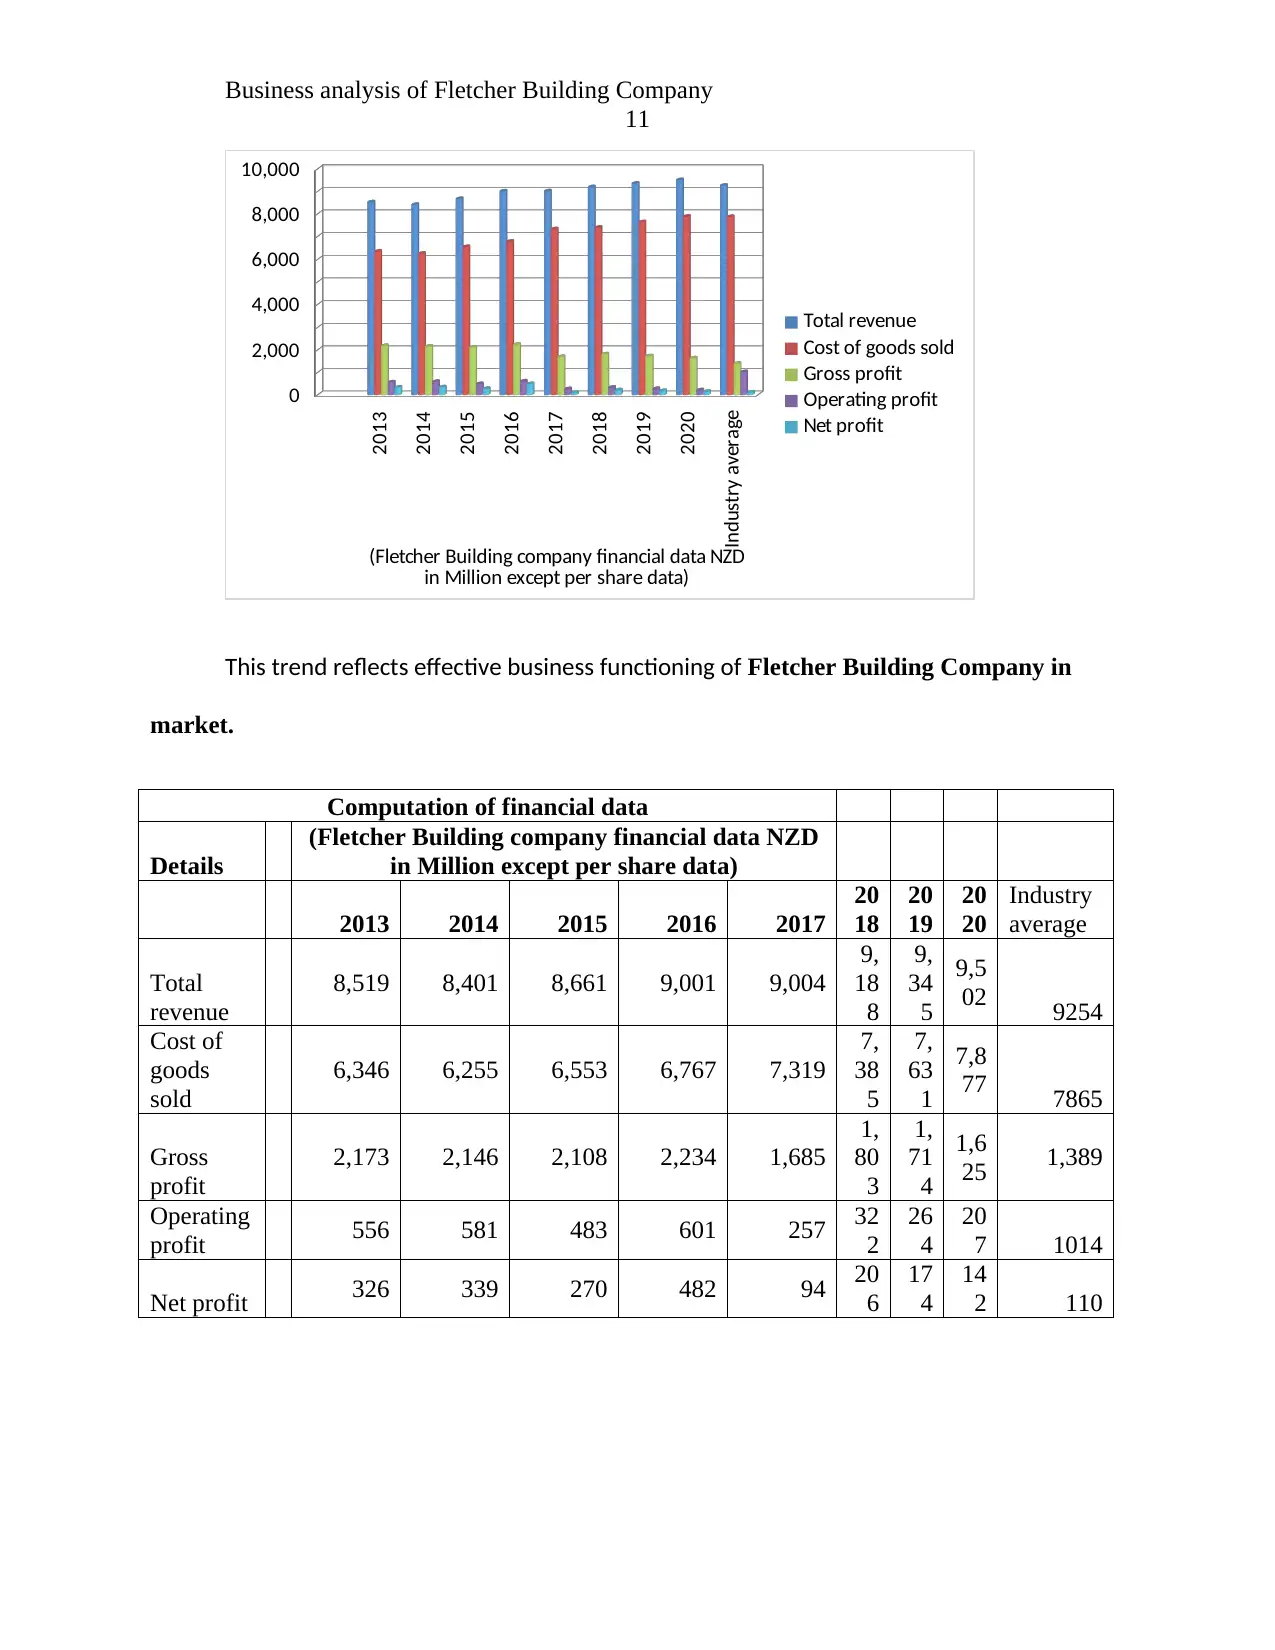
This trend reflects effective business functioning of Fletcher Building Company in
market.
Computation of financial data
Details
(Fletcher Building company financial data NZD
in Million except per share data)
2013 2014 2015 2016 2017
20
18
20
19
20
20
Industry
average
Total
revenue
8,519 8,401 8,661 9,001 9,004
9,
18
8
9,
34
5
9,5
02 9254
Cost of
goods
sold
6,346 6,255 6,553 6,767 7,319
7,
38
5
7,
63
1
7,8
77 7865
Gross
profit
2,173 2,146 2,108 2,234 1,685
1,
80
3
1,
71
4
1,6
25 1,389
Operating
profit 556 581 483 601 257 32
2
26
4
20
7 1014
Net profit 326 339 270 482 94 20
6
17
4
14
2 110
11
2013
2014
2015
2016
2017
2018
2019
2020
Industry average
(Fletcher Building company financial data NZD
in Million except per share data)
0
2,000
4,000
6,000
8,000
10,000
Total revenue
Cost of goods sold
Gross profit
Operating profit
Net profit
This trend reflects effective business functioning of Fletcher Building Company in
market.
Computation of financial data
Details
(Fletcher Building company financial data NZD
in Million except per share data)
2013 2014 2015 2016 2017
20
18
20
19
20
20
Industry
average
Total
revenue
8,519 8,401 8,661 9,001 9,004
9,
18
8
9,
34
5
9,5
02 9254
Cost of
goods
sold
6,346 6,255 6,553 6,767 7,319
7,
38
5
7,
63
1
7,8
77 7865
Gross
profit
2,173 2,146 2,108 2,234 1,685
1,
80
3
1,
71
4
1,6
25 1,389
Operating
profit 556 581 483 601 257 32
2
26
4
20
7 1014
Net profit 326 339 270 482 94 20
6
17
4
14
2 110
Business analysis of Fletcher Building Company
12
Analysis and interpretation
After evaluating the details and market data, it is considered that industry average of
Fletcher Building Company reflects higher profitability and efficiency of business. If company
wants to grow its business then it will have to increase the overall productivity at the industry
level (Ehrhardt &Brigham, 2016).Profitabiltiy of company is high and company is also managing
it business efficiently which not only increases the overall productivity but also efficiency of the
business.
Discussion and explanation of BSC and the Map (Why it is used)
This balance score card approach and strategic map of Fletcher Building Company is
designed to increase the overall productivity and improve its financial and business activities. It
has been observed that if company could increase the overall productivity by installing cyber
computing system and adopting newly advanced technologies in its internal system. This will
help company to increase the productivity and reduce the overall cost of the capital. Fletcher
Building Company has to improve its performance by increasing the return on capital employed.
Recommendation
Strategic Map and flow chart from solutions proposed in BSC and Portal five model
A strategic Map is the diagram which is used to implement effective internal and external
set goals of the prepared balance score card.
⊘ This is a preview!⊘
Do you want full access?
Subscribe today to unlock all pages.
Trusted by 1+ million students worldwide
1 out of 18
Related Documents


Your All-in-One AI-Powered Toolkit for Academic Success.
+13062052269
info@desklib.com
Available 24*7 on WhatsApp / Email
![[object Object]](/_next/static/media/star-bottom.7253800d.svg)
Unlock your academic potential
Copyright © 2020–2026 A2Z Services. All Rights Reserved. Developed and managed by ZUCOL.