Analysis of BMI and Its Association with Mathematics Performance
VerifiedAdded on 2021/06/17
|13
|2925
|36
Report
AI Summary
This report presents a study conducted to determine the association between Body Mass Index (BMI) and students' performance in mathematics. The research employed questionnaires to collect data from a sample of 50 students. Statistical analyses, including descriptive statistics, independent t-tests, and Pearson correlation coefficients, were performed using SPSS version 20 to address the research objectives. The findings revealed a statistically significant negative correlation between BMI and mathematics performance, indicating that higher BMI was associated with lower math scores. Additionally, the study found no significant mean difference in mathematics performance between male and female students. The study's results contribute to the ongoing discussion regarding factors influencing academic achievement and highlight the potential impact of physical health on cognitive performance. The report also discusses the study's limitations, such as sample size and suggests areas for future research.
Association between BMI and students’ performance in mathematics
Student ID
University
Student ID
University
Paraphrase This Document
Need a fresh take? Get an instant paraphrase of this document with our AI Paraphraser
Abstract
The aim of the study was to determine the association between BMI and the students’
performance in mathematics. General objective raised from the purpose of the study was to
determine the association between BMI and students’ performance in mathematics. The study
was guided by research question; “What is the association between BMI and students’
performance in mathematics?” Questionnaires were the research instruments used in collecting
data. SPSS version 20 was used in the analysis of data and generation of results output.
Descriptive statistics, independent t-test and Pearson correlation coefficient were the statistical
tests conducted to in regards to meeting the study objectives. The results confirmed that there
was a negative effect of BMI on students’ performance in mathematics since there existed
negative correlation between the tested variables. Lastly, there was no mean difference between
male and female performance in mathematics as tested.
Introduction
Several examinations and studies have been carried out to test for the factors that affect students’
performance in school in various subjects. In resent research carried out by Florin, T. A., Shults,
J., & Stettler, N. (2011); Van et al (2011) in their results they found out that no correlation
existed between the BMI and the school performance of the students in most subjects except in
physics where dismal performance was showed by obese students compared to students who had
normal body weight. This study will deal particularly with association of the body mass index
(BMI) of the students to their performance in mathematics. Mathematics is one of the subjects
that involve numerical calculations and manipulations where most of the students pose to have
challenge in Kilpatrick (2014). Scientists had brought the formula for the calculations of the BMI
and their various ranges showing different health risks to human beings’ health where those with
BMI of (18.5 – 24.9) are healthy, BMI of (25 – 29.9) are overweight and finally BMI of 30 and
above are obese Van et al (2015). Technicality involved in mathematics subject was what drew
attention of conducting this research. Intelligence of the students in most cases had been tested
using their scores in various subjects’ examinations where students with higher performance in
all the subjects were perceived as the most intelligent as those with lower performance in the
same subjects were perceived less intelligent Victoroff, K. Z., & Boyatzis, R. E. (2013).
Research objectives
1. To determine the difference in male and female students performance in mathematics.
2. To determine whether there is relationship between BMI and students’ mathematics
performance.
Statement of the problem
⊘ This is a preview!⊘
Do you want full access?
Subscribe today to unlock all pages.
Trusted by 1+ million students worldwide
This study was conducted to determine the association between the BMI of the students to their
mathematics performance in the school.
Significance of the problem
Critically addressing the stated problem will be of help to find if there was any association
between the BMI of the students and their performance in mathematics subject.
Research questions
1. Do male students perform better than the female students in mathematics?
2. Is there relationship between BMI of the students and the students’ performance in
mathematics?
Hypothesis
H0: There is no mean difference between male and female students’ performance in mathematics
H1: There is mean difference between male and female students’ performance in mathematics
H0: There is no correlation between BMI of the students and their mathematics performance
H1: There is correlation between BMI of the students and their mathematics performance
The above research questions were chosen to help build on the general research question thus
meeting the specific and general objectives of the study.
Methods
Research design
Paraphrase This Document
Need a fresh take? Get an instant paraphrase of this document with our AI Paraphraser
Various components in the study can be chosen and combined by researchers in a logical and
comprehensible way to ensure for proper address of research problems through research design
Creswell, J. W., & Creswell, J. D. (2017). Ambiguity in the effectiveness of research are reduced
by research design Venable, J., Pries-Heje, J., & Baskerville, R. (2016). Descriptive statistics and
Pearson correlation and the independent t-test was be used in this study to meet the purpose for
this study.
Target population
This is a group of objects or elements focused on by the topic under investigation and the sample
is a fraction of the population i.e. a subset of the population Batsis et al (2013). In this case, the
targeted group was mathematics students and their population in the school was 256. From that
population, a sample size of 50 students were sampled across the classes. A sample size is the
number of choice of the researcher from the available objects or elements under study population
Kühberger, A., Fritz, A., & Scherndl, T. (2014).
Research instruments
There are various research tools that a researcher can engage in the data collection process such
as questionnaires, surveys and interviews Xu, M. A., & Storr, G. B. (2012). In this research, the
researcher used the questionnaire. Questions with multiple choices where the participant is
required to choose from are referred to as closed questions Dolnicar (2013). Major disadvantage
of open ended questions was that they resulted to bulky data which were as well not easy to
analyze Choy (2014).
Data collection
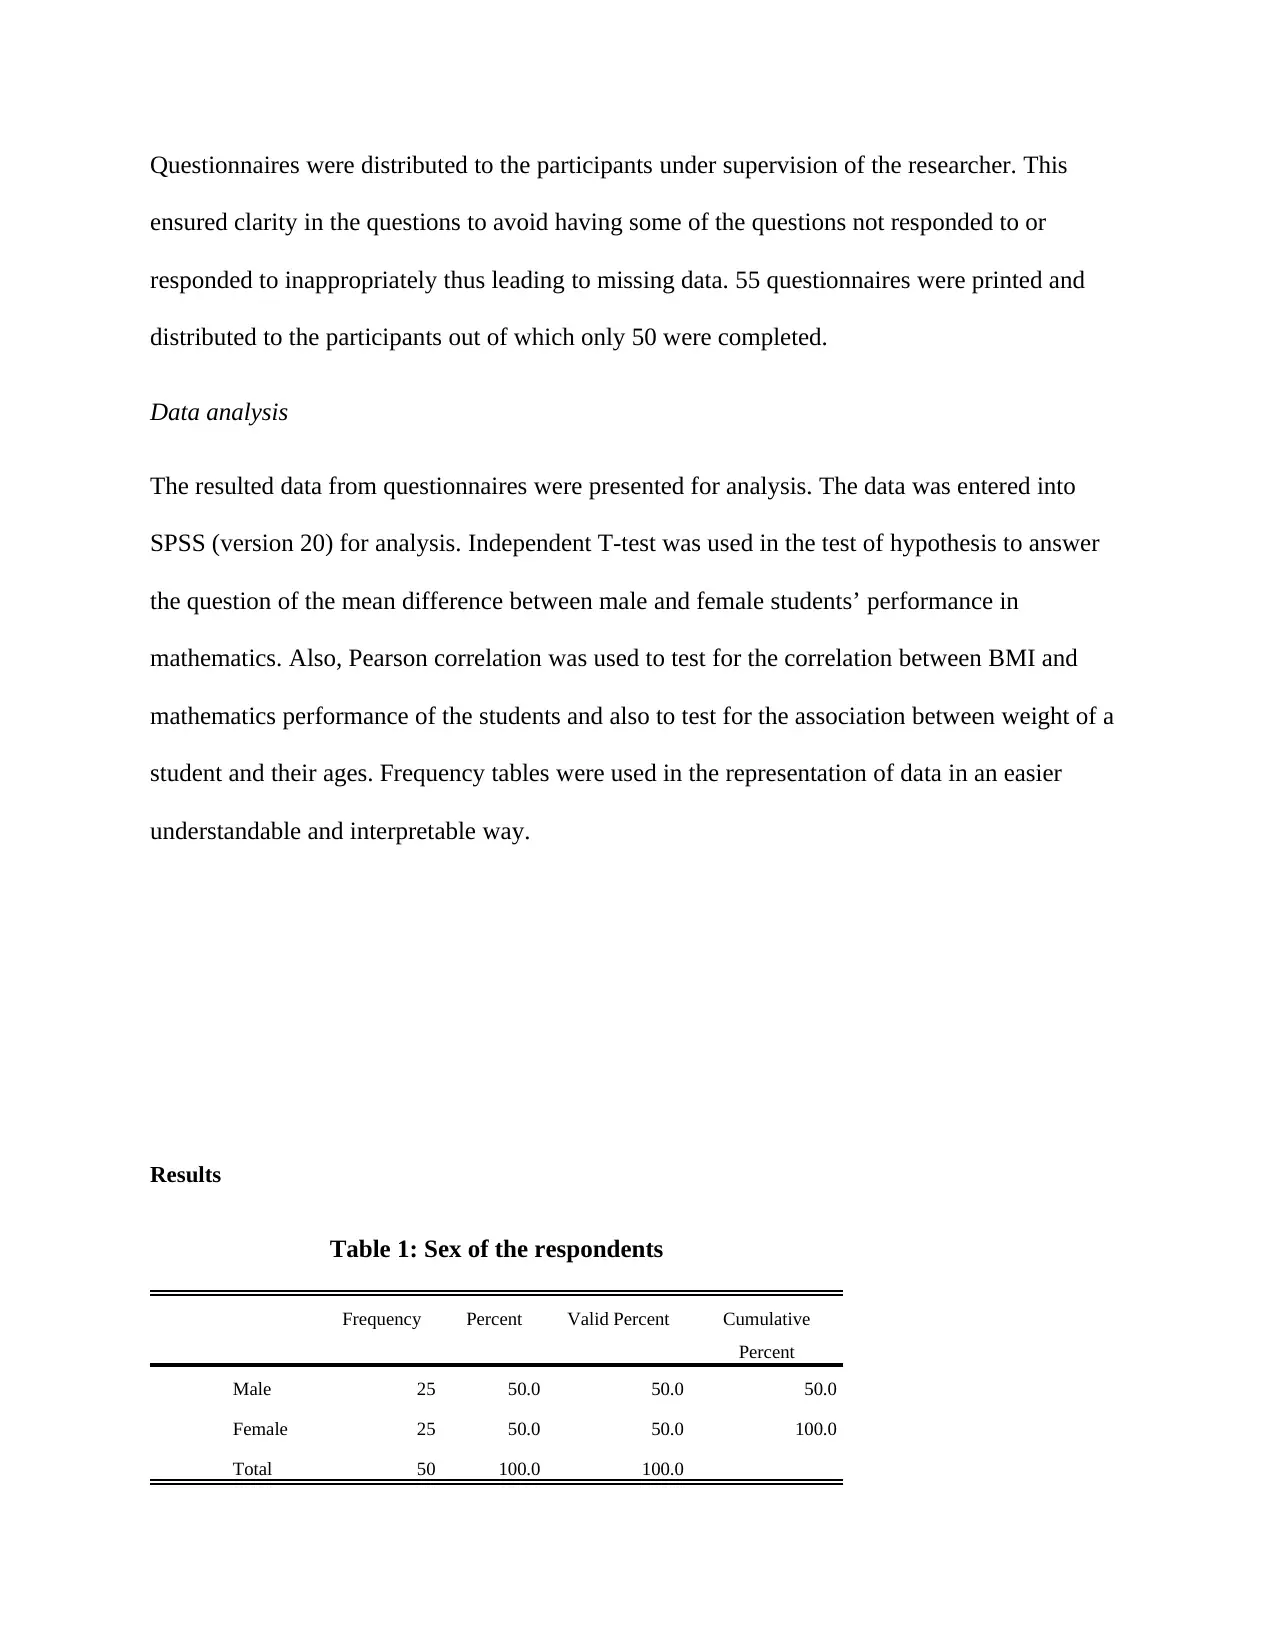
Questionnaires were distributed to the participants under supervision of the researcher. This
ensured clarity in the questions to avoid having some of the questions not responded to or
responded to inappropriately thus leading to missing data. 55 questionnaires were printed and
distributed to the participants out of which only 50 were completed.
Data analysis
The resulted data from questionnaires were presented for analysis. The data was entered into
SPSS (version 20) for analysis. Independent T-test was used in the test of hypothesis to answer
the question of the mean difference between male and female students’ performance in
mathematics. Also, Pearson correlation was used to test for the correlation between BMI and
mathematics performance of the students and also to test for the association between weight of a
student and their ages. Frequency tables were used in the representation of data in an easier
understandable and interpretable way.
Results
Table 1: Sex of the respondents
Frequency Percent Valid Percent Cumulative
Percent
Male 25 50.0 50.0 50.0
Female 25 50.0 50.0 100.0
Total 50 100.0 100.0
⊘ This is a preview!⊘
Do you want full access?
Subscribe today to unlock all pages.
Trusted by 1+ million students worldwide
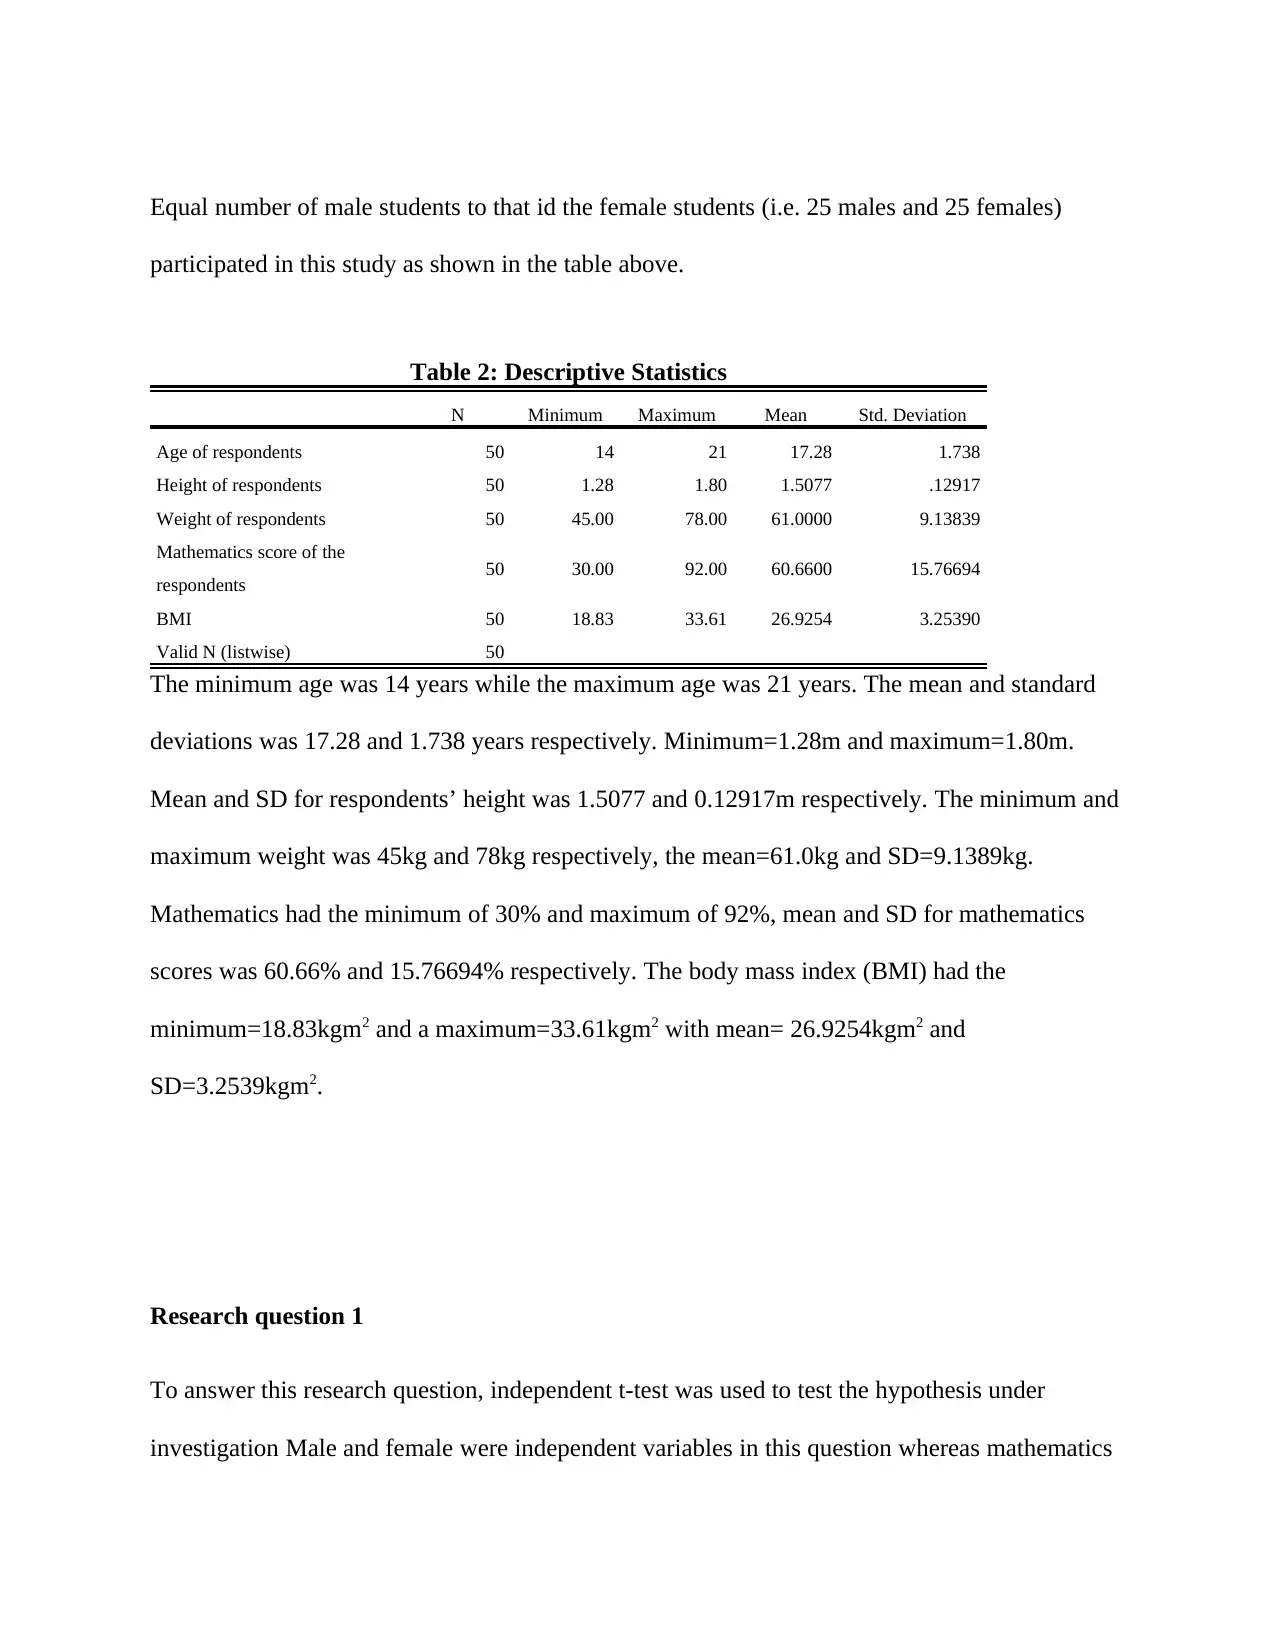
Equal number of male students to that id the female students (i.e. 25 males and 25 females)
participated in this study as shown in the table above.
Table 2: Descriptive Statistics
N Minimum Maximum Mean Std. Deviation
Age of respondents 50 14 21 17.28 1.738
Height of respondents 50 1.28 1.80 1.5077 .12917
Weight of respondents 50 45.00 78.00 61.0000 9.13839
Mathematics score of the
respondents 50 30.00 92.00 60.6600 15.76694
BMI 50 18.83 33.61 26.9254 3.25390
Valid N (listwise) 50
The minimum age was 14 years while the maximum age was 21 years. The mean and standard
deviations was 17.28 and 1.738 years respectively. Minimum=1.28m and maximum=1.80m.
Mean and SD for respondents’ height was 1.5077 and 0.12917m respectively. The minimum and
maximum weight was 45kg and 78kg respectively, the mean=61.0kg and SD=9.1389kg.
Mathematics had the minimum of 30% and maximum of 92%, mean and SD for mathematics
scores was 60.66% and 15.76694% respectively. The body mass index (BMI) had the
minimum=18.83kgm2 and a maximum=33.61kgm2 with mean= 26.9254kgm2 and
SD=3.2539kgm2.
Research question 1
To answer this research question, independent t-test was used to test the hypothesis under
investigation Male and female were independent variables in this question whereas mathematics
Paraphrase This Document
Need a fresh take? Get an instant paraphrase of this document with our AI Paraphraser
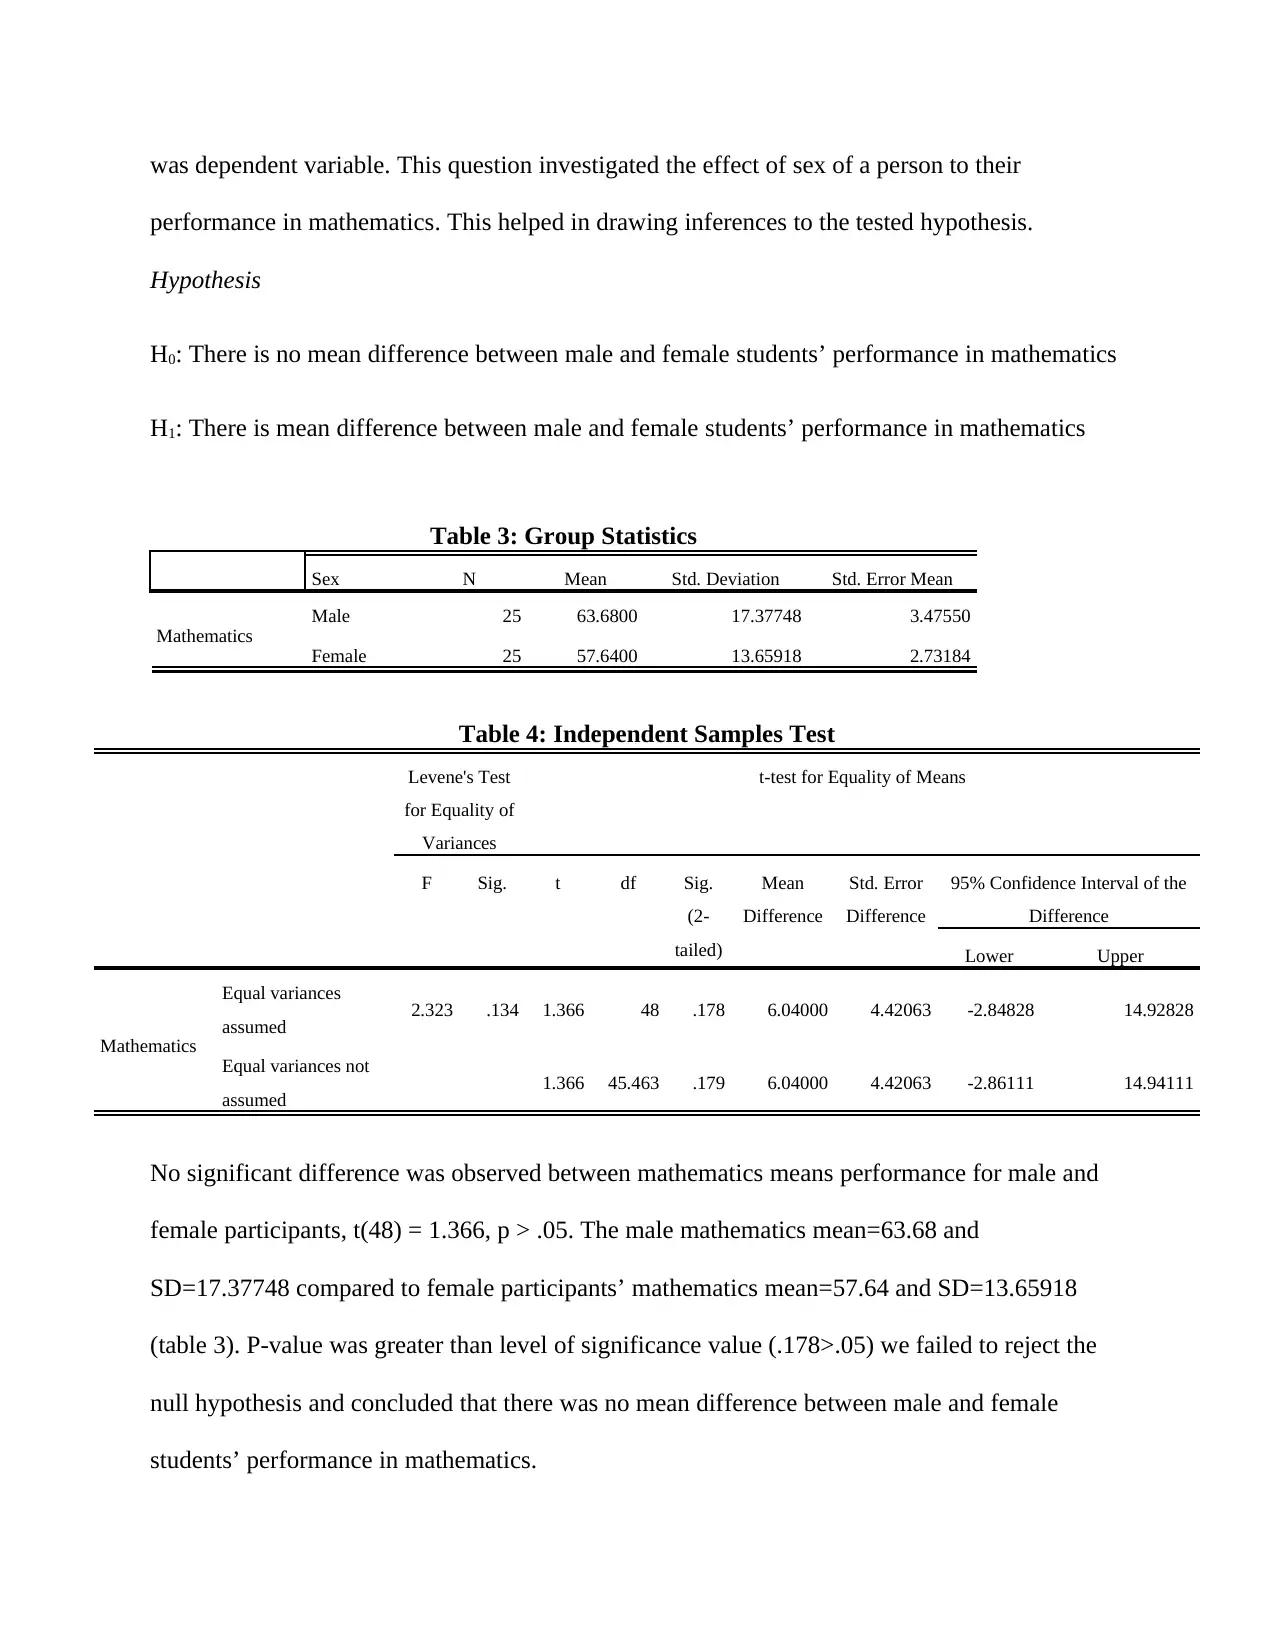
was dependent variable. This question investigated the effect of sex of a person to their
performance in mathematics. This helped in drawing inferences to the tested hypothesis.
Hypothesis
H0: There is no mean difference between male and female students’ performance in mathematics
H1: There is mean difference between male and female students’ performance in mathematics
Table 3: Group Statistics
Sex N Mean Std. Deviation Std. Error Mean
Mathematics
Male 25 63.6800 17.37748 3.47550
Female 25 57.6400 13.65918 2.73184
Table 4: Independent Samples Test
Levene's Test
for Equality of
Variances
t-test for Equality of Means
F Sig. t df Sig.
(2-
tailed)
Mean
Difference
Std. Error
Difference
95% Confidence Interval of the
Difference
Lower Upper
Mathematics
Equal variances
assumed 2.323 .134 1.366 48 .178 6.04000 4.42063 -2.84828 14.92828
Equal variances not
assumed 1.366 45.463 .179 6.04000 4.42063 -2.86111 14.94111
No significant difference was observed between mathematics means performance for male and
female participants, t(48) = 1.366, p > .05. The male mathematics mean=63.68 and
SD=17.37748 compared to female participants’ mathematics mean=57.64 and SD=13.65918
(table 3). P-value was greater than level of significance value (.178>.05) we failed to reject the
null hypothesis and concluded that there was no mean difference between male and female
students’ performance in mathematics.
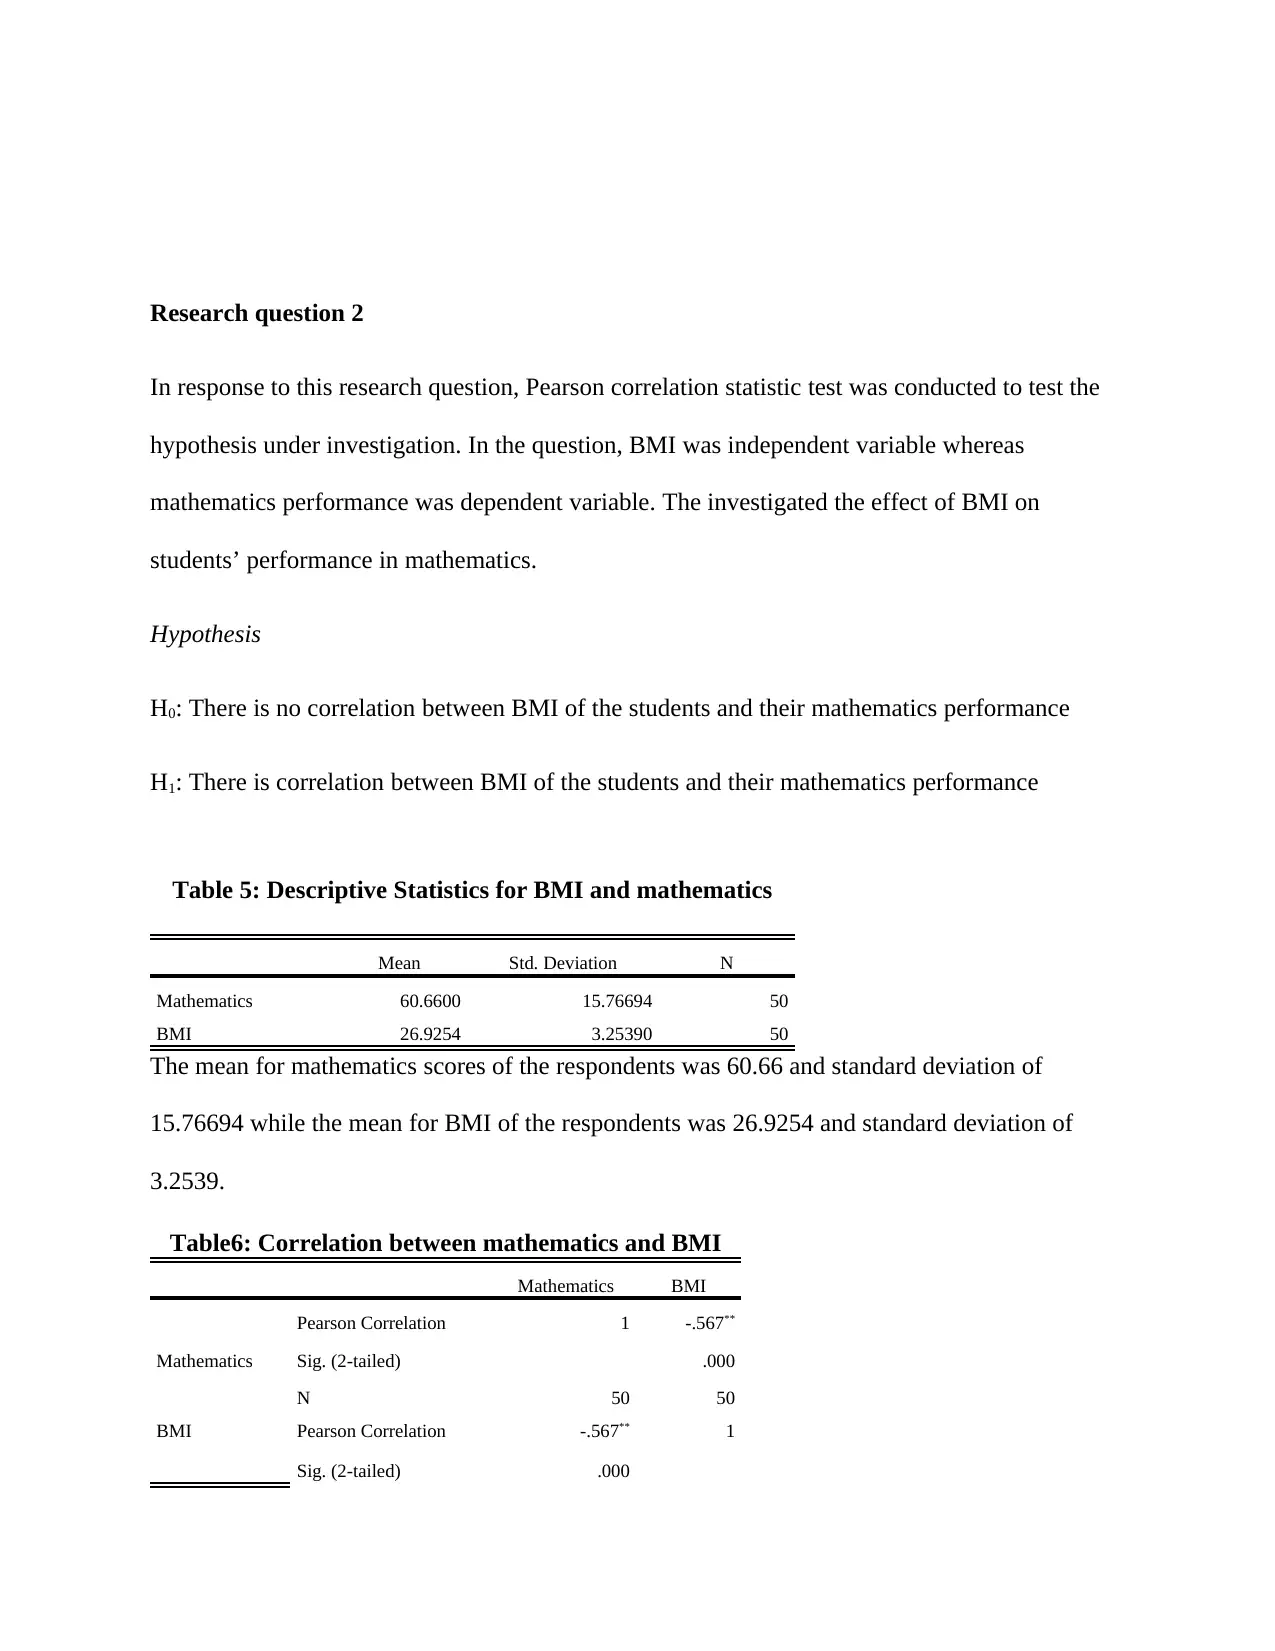
Research question 2
In response to this research question, Pearson correlation statistic test was conducted to test the
hypothesis under investigation. In the question, BMI was independent variable whereas
mathematics performance was dependent variable. The investigated the effect of BMI on
students’ performance in mathematics.
Hypothesis
H0: There is no correlation between BMI of the students and their mathematics performance
H1: There is correlation between BMI of the students and their mathematics performance
Table 5: Descriptive Statistics for BMI and mathematics
Mean Std. Deviation N
Mathematics 60.6600 15.76694 50
BMI 26.9254 3.25390 50
The mean for mathematics scores of the respondents was 60.66 and standard deviation of
15.76694 while the mean for BMI of the respondents was 26.9254 and standard deviation of
3.2539.
Table6: Correlation between mathematics and BMI
Mathematics BMI
Mathematics
Pearson Correlation 1 -.567**
Sig. (2-tailed) .000
N 50 50
BMI Pearson Correlation -.567** 1
Sig. (2-tailed) .000
⊘ This is a preview!⊘
Do you want full access?
Subscribe today to unlock all pages.
Trusted by 1+ million students worldwide
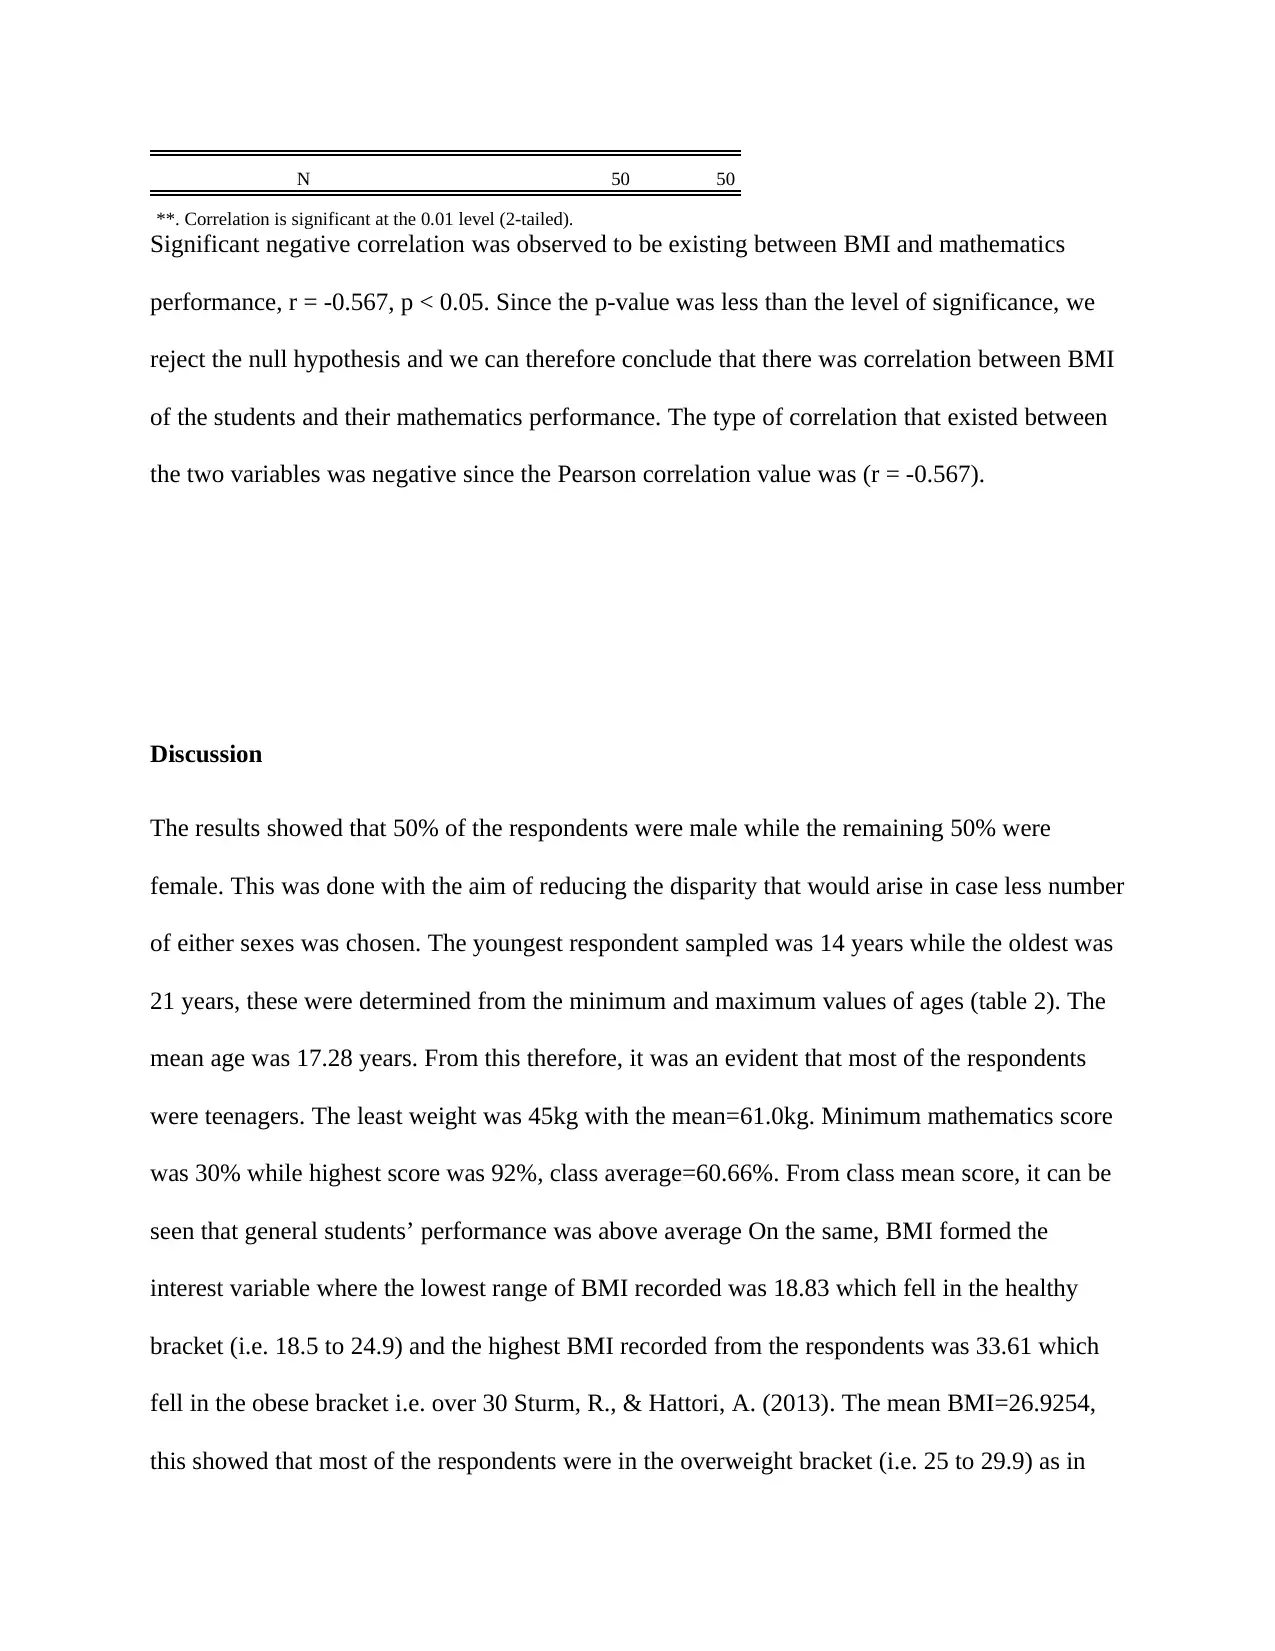
N 50 50
**. Correlation is significant at the 0.01 level (2-tailed).
Significant negative correlation was observed to be existing between BMI and mathematics
performance, r = -0.567, p < 0.05. Since the p-value was less than the level of significance, we
reject the null hypothesis and we can therefore conclude that there was correlation between BMI
of the students and their mathematics performance. The type of correlation that existed between
the two variables was negative since the Pearson correlation value was (r = -0.567).
Discussion
The results showed that 50% of the respondents were male while the remaining 50% were
female. This was done with the aim of reducing the disparity that would arise in case less number
of either sexes was chosen. The youngest respondent sampled was 14 years while the oldest was
21 years, these were determined from the minimum and maximum values of ages (table 2). The
mean age was 17.28 years. From this therefore, it was an evident that most of the respondents
were teenagers. The least weight was 45kg with the mean=61.0kg. Minimum mathematics score
was 30% while highest score was 92%, class average=60.66%. From class mean score, it can be
seen that general students’ performance was above average On the same, BMI formed the
interest variable where the lowest range of BMI recorded was 18.83 which fell in the healthy
bracket (i.e. 18.5 to 24.9) and the highest BMI recorded from the respondents was 33.61 which
fell in the obese bracket i.e. over 30 Sturm, R., & Hattori, A. (2013). The mean BMI=26.9254,
this showed that most of the respondents were in the overweight bracket (i.e. 25 to 29.9) as in
Paraphrase This Document
Need a fresh take? Get an instant paraphrase of this document with our AI Paraphraser
conferment with the BMI overweight scale that overweight people have the BMI of 25 to 29.9
Wadden et al (2013).
Hypothesis tested in the first research question was concerning whether there was significant
mean difference between male and female respondents in mathematics performance, independent
t-test showed that there was no significant difference, p-value (.178) was greater than the
significant level value (0.05) thus the null hypothesis was not rejected.
Last research question, the hypothesis tested using Pearson correlation coefficient (r) showed
that there was significant negative correlation between BMI and mathematics performance. The
increase in BMI of the students was resulting to lower scores on mathematics performance. This
result differs with previously conducted research by Florin, T. A., Shults, J., & Stettler, N. (2011)
that no correlation existed between BMI and school performance of the students in most of the
subjects except in physics. In this study, test showed that BMI had negative correlation with the
students’ performance in mathematics.
References
Batsis, J. A., Barre, L. K., Mackenzie, T. A., Pratt, S. I., Lopez‐Jimenez, F., & Bartels, S. J.
(2013). Variation in the prevalence of sarcopenia and sarcopenic obesity in older adults
associated with different research definitions: dual‐energy X‐ray absorptiometry data
from the National Health and Nutrition Examination Survey 1999–2004. Journal of the
American Geriatrics Society, 61(6), 974-980.
Choy, L. T. (2014). The strengths and weaknesses of research methodology: Comparison and
complimentary between qualitative and quantitative approaches. IOSR Journal of
Humanities and Social Science, 19(4), 99-104.
Creswell, J. W., & Creswell, J. D. (2017). Research design: Qualitative, quantitative, and mixed
methods approaches. Sage publications.
Dolnicar, S. (2013). Asking good survey questions. Journal of Travel Research, 52(5), 551-574.
Florin, T. A., Shults, J., & Stettler, N. (2011). Perception of overweight is associated with poor
academic performance in US adolescents. Journal of School Health, 81(11), 663-670.
Kilpatrick, J. (2014). History of research in mathematics education. In Encyclopedia of
mathematics education (pp. 267-272). Springer Netherlands.
Kühberger, A., Fritz, A., & Scherndl, T. (2014). Publication bias in psychology: a diagnosis
based on the correlation between effect size and sample size. PloS one, 9(9), e105825.
Sturm, R., & Hattori, A. (2013). Morbid obesity rates continue to rise rapidly in the United
States. International journal of obesity, 37(6), 889.
⊘ This is a preview!⊘
Do you want full access?
Subscribe today to unlock all pages.
Trusted by 1+ million students worldwide
1 out of 13
Related Documents


Your All-in-One AI-Powered Toolkit for Academic Success.
+13062052269
info@desklib.com
Available 24*7 on WhatsApp / Email
![[object Object]](/_next/static/media/star-bottom.7253800d.svg)
Unlock your academic potential
Copyright © 2020–2026 A2Z Services. All Rights Reserved. Developed and managed by ZUCOL.