Comparative Analysis of Clustering Techniques in Business Applications

Verified

Added on  2020/05/11

|10
|1748
|51
AI Summary
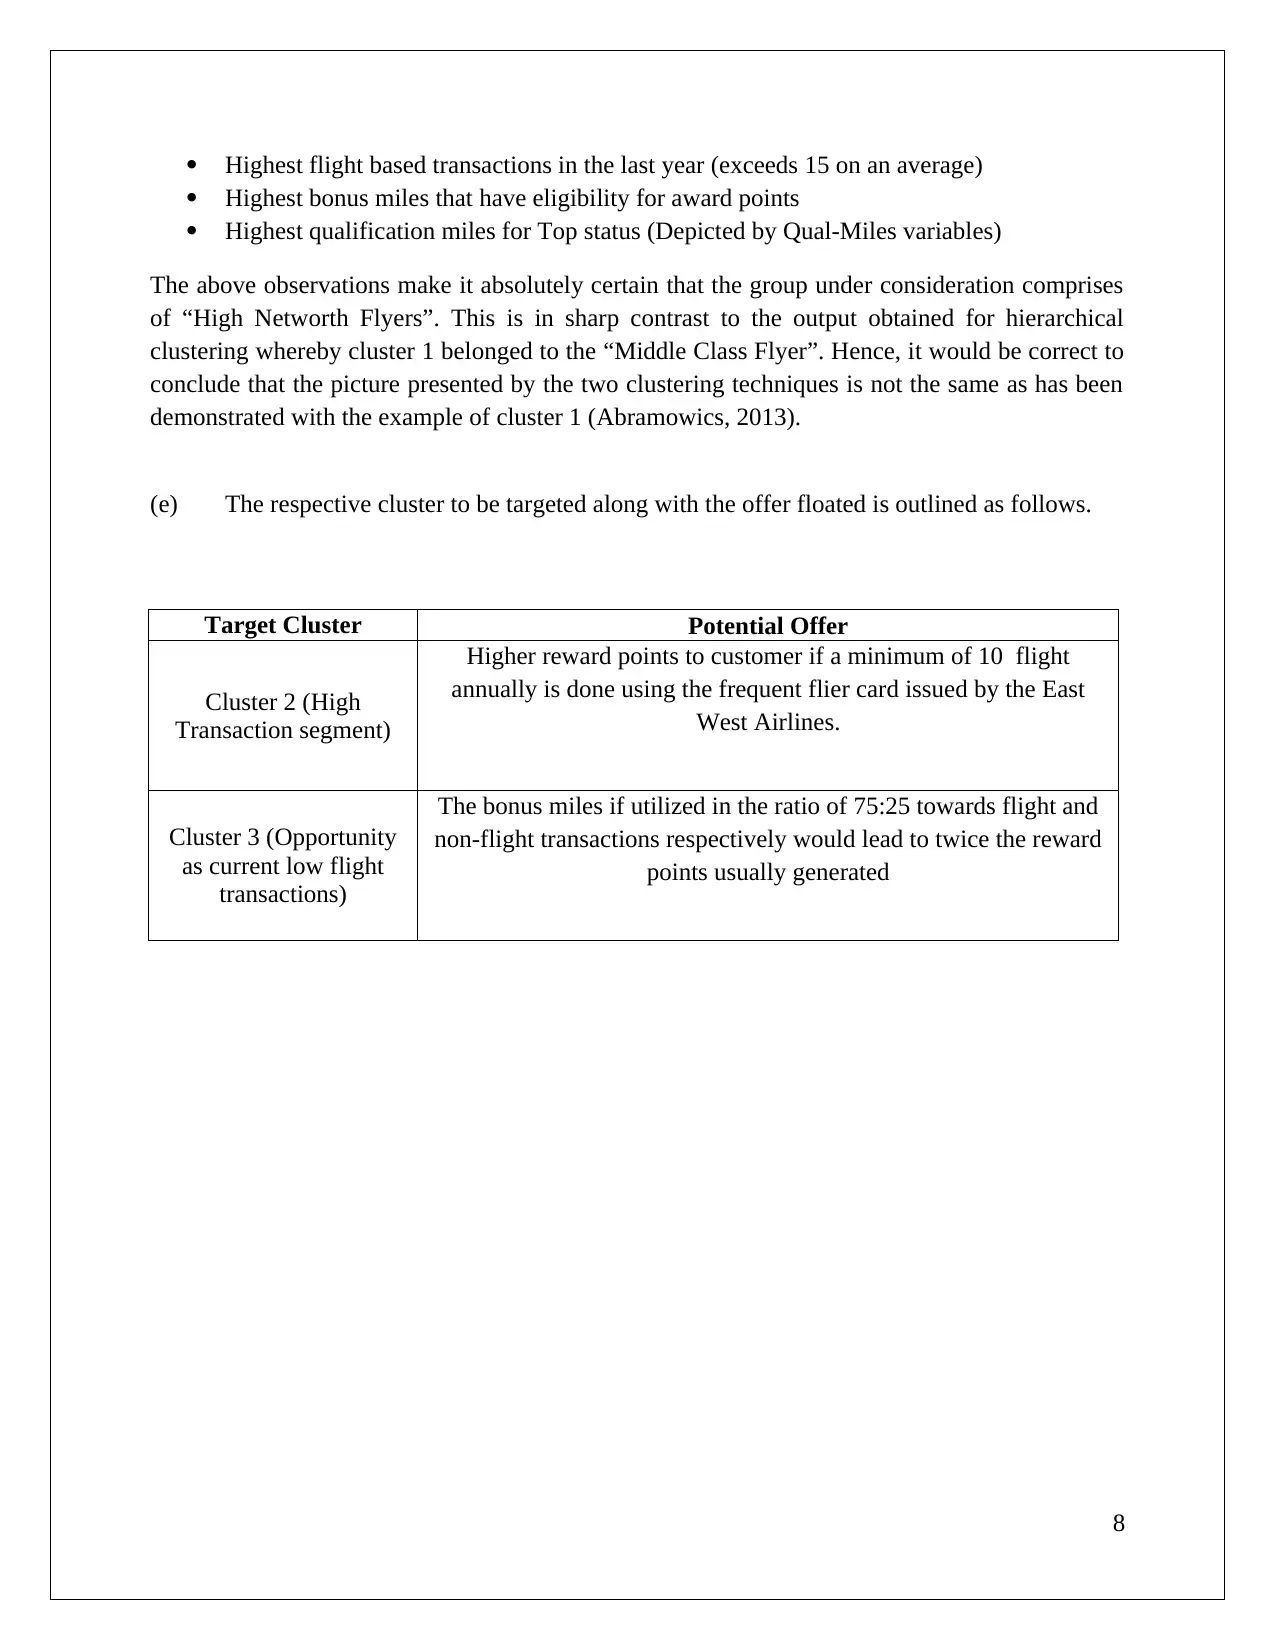
The assignment presents an analytical approach to understanding association rule algorithms within the domain of data mining, focusing on their application in deriving meaningful business insights from transaction datasets. A significant portion is dedicated to evaluating two clustering techniques: hierarchical clustering and K-Means clustering, applied to an airline customer dataset. The objective is to determine how different methodologies categorize customers based on spending behavior and travel frequency. This comparative analysis highlights the varying outcomes of each technique and their implications for business strategy. Additionally, strategic offers tailored to specific customer clusters identified by these methods are proposed, illustrating a practical application of data mining in enhancing business intelligence efforts.
Document Page
Data Mining
[Pick the date]
Student Id and Name
tabler-icon-diamond-filled.svg

Paraphrase This Document

Need a fresh take? Get an instant paraphrase of this document with our AI Paraphraser
Document Page
1. Association rule
The small cosmetic data file has been analysed using the XL miner tool in order to generate the
association rule output using the features provided by XL Miner tool. This output is shown as
follows.
The output clearly highlights that the minimum confidence level has been set as 50%.
(i) The objective is to interpret the first three association rules that have been outlined in the
above XL Miner output (Ana, 2014).
Rule 1
The first rule is highlighted in the first row and highlights that if brushes are bought then with a
probability of 1, the underlying customer would also buy nail polish.
Rule 2
1
Document Page
The second rule is highlighted in the second row and highlights that if nail polish is bought then
with a probability of 0.6322, the underlying customer would also buy brushes.
Rule 3
The third rule is highlighted in the third row and highlights that if nail polish is bought then with
a probability of 0.5920, the underlying customer would also buy bronzer.
(ii) In the above output, only 9 rules were displayed owing to the support level indicated as
100. For producing more rules, there is a need to lower the corresponding support level to
50. As a result, the output produced is indicated below.
For the association rules, redundancy is a common issues and usually such rules are identified
and deleted so that the utility of output is enhanced and duplication can be prevented.
Redundancy of a rule happens only in relation to a rule which is just above and tends to predict
the underlying support level of the rule facing redundancy. In the output indicated above, there
2
Document Page
are a host of redundant rules which are essentially not adding any value to the output (Ragsdale,
2014). In the given output, there are a vast number of redundant rules marked as
2,4,6,8,10,12,14,16. With regards to their respective ancestor i.e. 1, 3, 5, 7,9,11, 13, 15 the above
rules are redundant. This is because any of the pair of rules from the above lists has the same
support and even the confidence value is also the same. Thus, there is rule redundancy observed
in which the superior rule is safeguarded while the inferior one is removed (Shumulei et. al.,
2016).
The association rules utility is derived from the collective purview of the rules and not their
individual use. This is because when the rules are considered collectively, a big picture tends to
emerge which is not the case with individual rules. However, in respect of individual rules also
certain key features are noteworthy which involve support and confidence. The support for a rule
indicates the importance and is denoted by the lift ratio which ideally should be higher so as to
enhance the overall importance. The confidence is captured by the confidence level which is
indicative of the underlying conditional probability of events captured by the respective rules
(Ragsdale, 2014).
(iii) There has been a modification of the minimum confidence percentage that has altered
from the earlier case of 50% to 75%. The resultant output is indicated below.
In the output pasted above, it becomes apparent that as the confidence level desired has
increased, the number of rules that have been displayed have reduced to only one. This is
3
tabler-icon-diamond-filled.svg

Paraphrase This Document

Need a fresh take? Get an instant paraphrase of this document with our AI Paraphraser
Document Page
because the other rules have failed to comply with the minimum confidence level of 75%. The
only rule which is able to comply has been highlighted in the output and it is evident that the
underlying confidence level is 100%. As a result, it is imperative that the minimum confidence
level must be chosen wisely or else there would be certain rules which even though are
significant but would not be captured in the output and hence might undermine the utility of the
output (Shumueli, et. al., 2016).
Question 2
(a) The relevant output from the hierarchical clustering of the East West Airlines data has
been indicated in the form of dendrogram. This has been obtained using XL Miner as the
underlying platform.
The number of clusters that are formed in the clustering process are three which can be outlined
through namely two ways. The output tends to have three clusters i.e. 1 , 2 and 3 whose labeling
would be discussed in part ©. Also, in the above dendogram a cutoff distance in the range of
975<x<1000, a horizontal line drawn would tend to intersect the above dendrogram at three
unique points indicating the existence of three clusters (Ana, 2014).
4
Document Page
(b) Normalisation is critical in hierarchical clustering as the absence of the same can lead to
following issues.
.
The distance between centroids of clusters is not computed accurately using raw data as the
scale brings in a distorting effect..
The clusters formed and the result lacks accuracy and hence the overall utility is lesser if
raw data is used.
The above findings can be validated using the output of the raw data which captured the distance
between centroids.
It is apparent from the above dendrogram that there has been a distortion in the distance of the
clusters and hence the utility of the output is comparatively lesser. Thus, it makes sense to run
hierarchical clustering using normalised data instead of raw data so that the output is more
accurate and has higher utility for the underlying researcher.
(c) The objective is to label the clusters that are derived on the basis of the hierarchical
clustering. In this process, the cluster individual attributes need to be paid attention. The
methodology used to provide a label to each cluster is based on cashing in the common
features of a group of observations found in a particular cluster. The selected output of
the clusters is exhibited below.
5
Document Page
Certain entries from the cluster 1 output are outlined above. One of the common trait is the low
flying frequency is the past one year. This is also corroborated by the low non-flight bonus
transactions. Additionally, the bonus balance miles which can be converted into award point also
are lowest amongst the three clusters. Clearly, the overall spending capacity of this group does
not seem high and hence appropriate categorization would be “Middle Class Flyers”.
Certain entries from the cluster 2 output are outlined above. One of the common trait is the high
flying frequency is the past one year. This is also corroborated by the high non-flight bonus
transactions. Additionally, the bonus balance miles which can be converted into award point also
are highest amongst the three clusters. Clearly, the overall spending capacity of this group does
seem high and hence appropriate categorization would be “High Networth Flyers”.
6
tabler-icon-diamond-filled.svg

Paraphrase This Document

Need a fresh take? Get an instant paraphrase of this document with our AI Paraphraser
Document Page
Certain entries from the cluster 3 output are outlined above. One of the common trait is the low
flying frequency is the past one year. But, it is accompanied by high non-flight bonus
transactions. Clearly, the appropriate categorization for these customers would be “Non-Frequent
Flyers”.
(d) As per the question, while the given airlines customer data has been already analysed
using hierarchical clustering, the objective is to now analyze this using another clustering
technique named K-Means Clustering. The resultant clustering pattern produced by these
two methods then needs to be compared using the K Means clustering output highlighted
below.
The number of clusters for both techniques is essentially three and thus focus should be on the
respective classification that is given to these. In case, each of the clusters has the same label in
both the techniques, then it might be said that a similar picture results from the two clustering
methodologies.
For instance, consider cluster 1 in the output pasted above. Three observations which are peculiar
to this group are highlighted above
7
Document Page
Highest flight based transactions in the last year (exceeds 15 on an average)
Highest bonus miles that have eligibility for award points
Highest qualification miles for Top status (Depicted by Qual-Miles variables)
The above observations make it absolutely certain that the group under consideration comprises
of “High Networth Flyers”. This is in sharp contrast to the output obtained for hierarchical
clustering whereby cluster 1 belonged to the “Middle Class Flyer”. Hence, it would be correct to
conclude that the picture presented by the two clustering techniques is not the same as has been
demonstrated with the example of cluster 1 (Abramowics, 2013).
(e) The respective cluster to be targeted along with the offer floated is outlined as follows.
Target Cluster Potential Offer
Cluster 2 (High
Transaction segment)
Higher reward points to customer if a minimum of 10 flight
annually is done using the frequent flier card issued by the East
West Airlines.
Cluster 3 (Opportunity
as current low flight
transactions)
The bonus miles if utilized in the ratio of 75:25 towards flight and
non-flight transactions respectively would lead to twice the reward
points usually generated
8
Document Page
Reference
Abramowics, W. (2013) Business Information Systems Workshops: BIS 2013 International
Workshops (5th ed.). New York: Springer.
Ana, A. (2014) Integration of Data Mining in Business Intelligence System (4th ed.). Sydney:
IGA Global
Ragsdale, C. (2014) Spread sheet Modelling and Decision Analysis: A Practical Introduction to
Business Analytics (7th ed.). London: Cengage Learning.
Shumueli, G., Bruce, C.P., Yahav, I., Patel, R. N., Kenneth, C., & Lichtendahl, J. (2016) Data
Mining For Business Analytics: Concepts Techniques and Application (2nd ed.).London:
John Wiley & Sons.
9
chevron_up_icon
1 out of 10
circle_padding
hide_on_mobile
zoom_out_icon