Financial Analysis of AstraZeneca
VerifiedAdded on  2020/01/16
|21
|4018
|450
Report
AI Summary
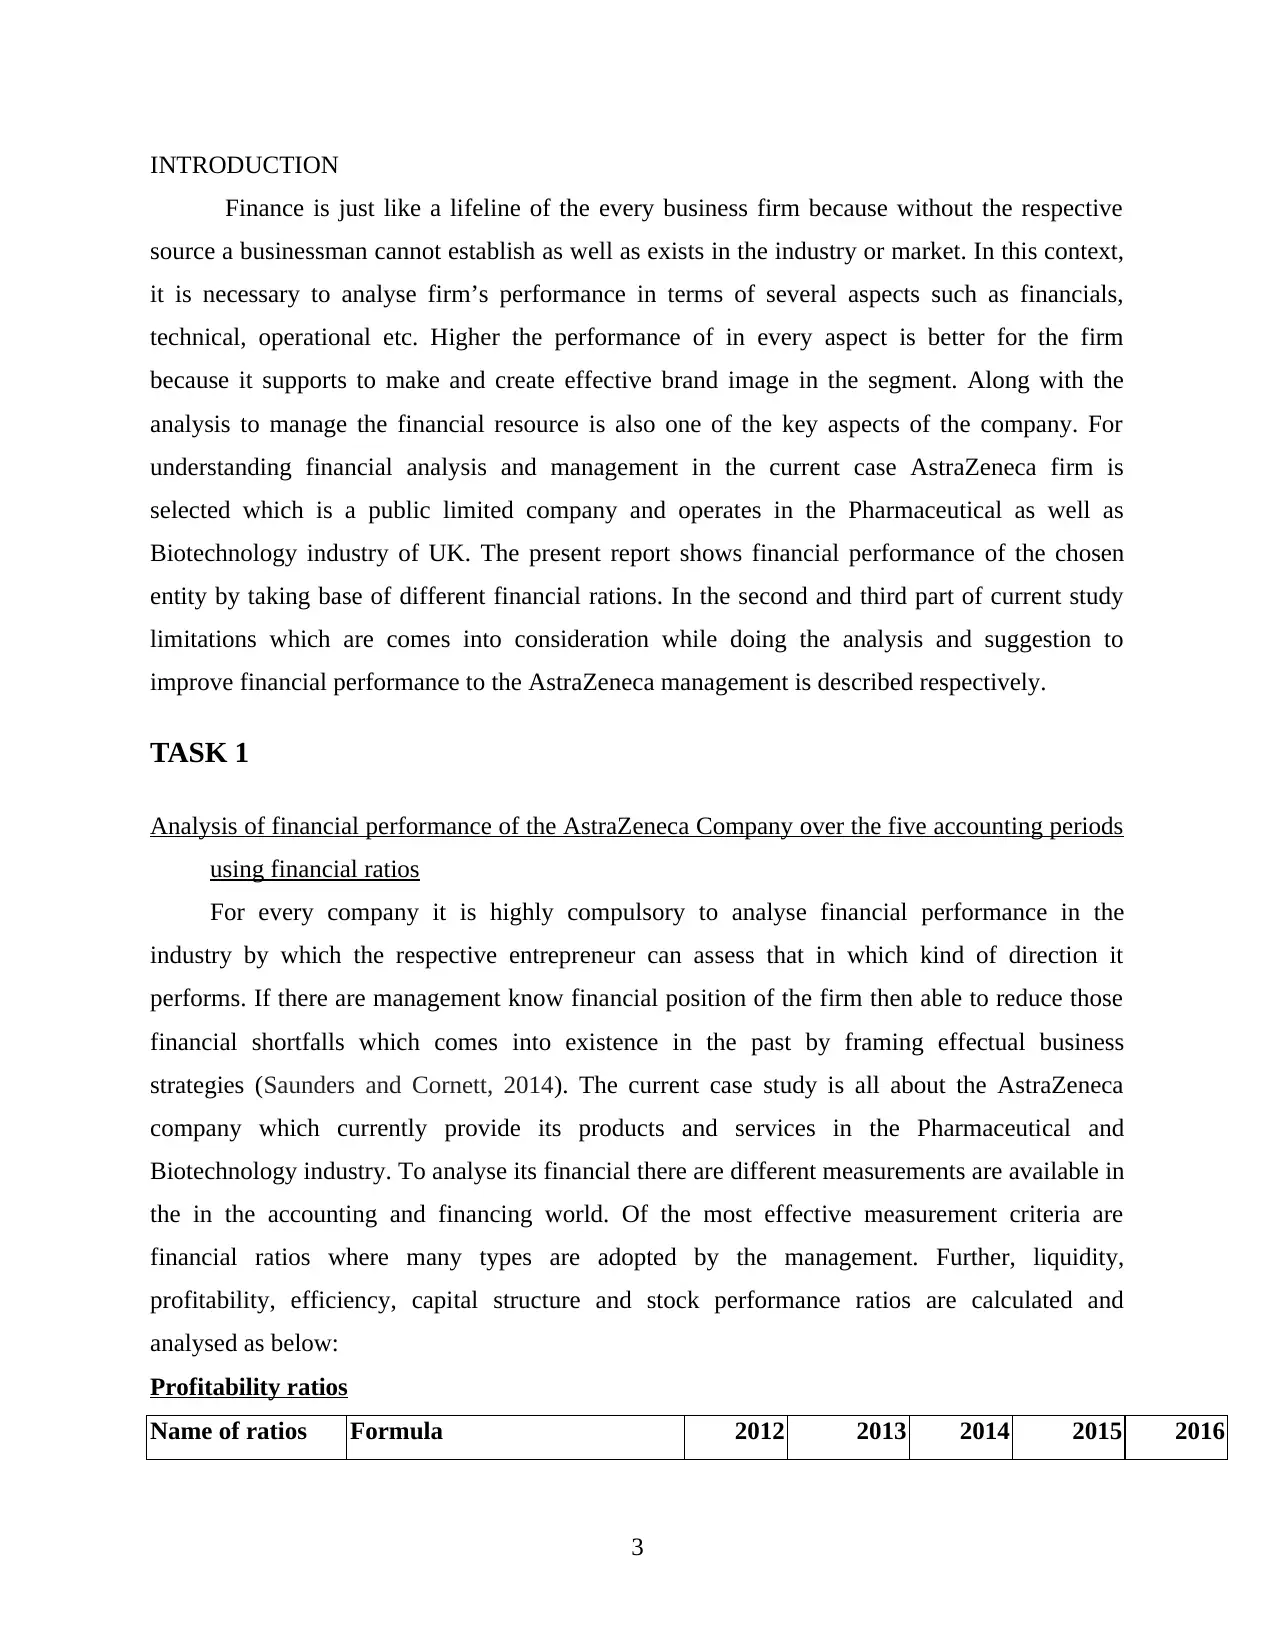
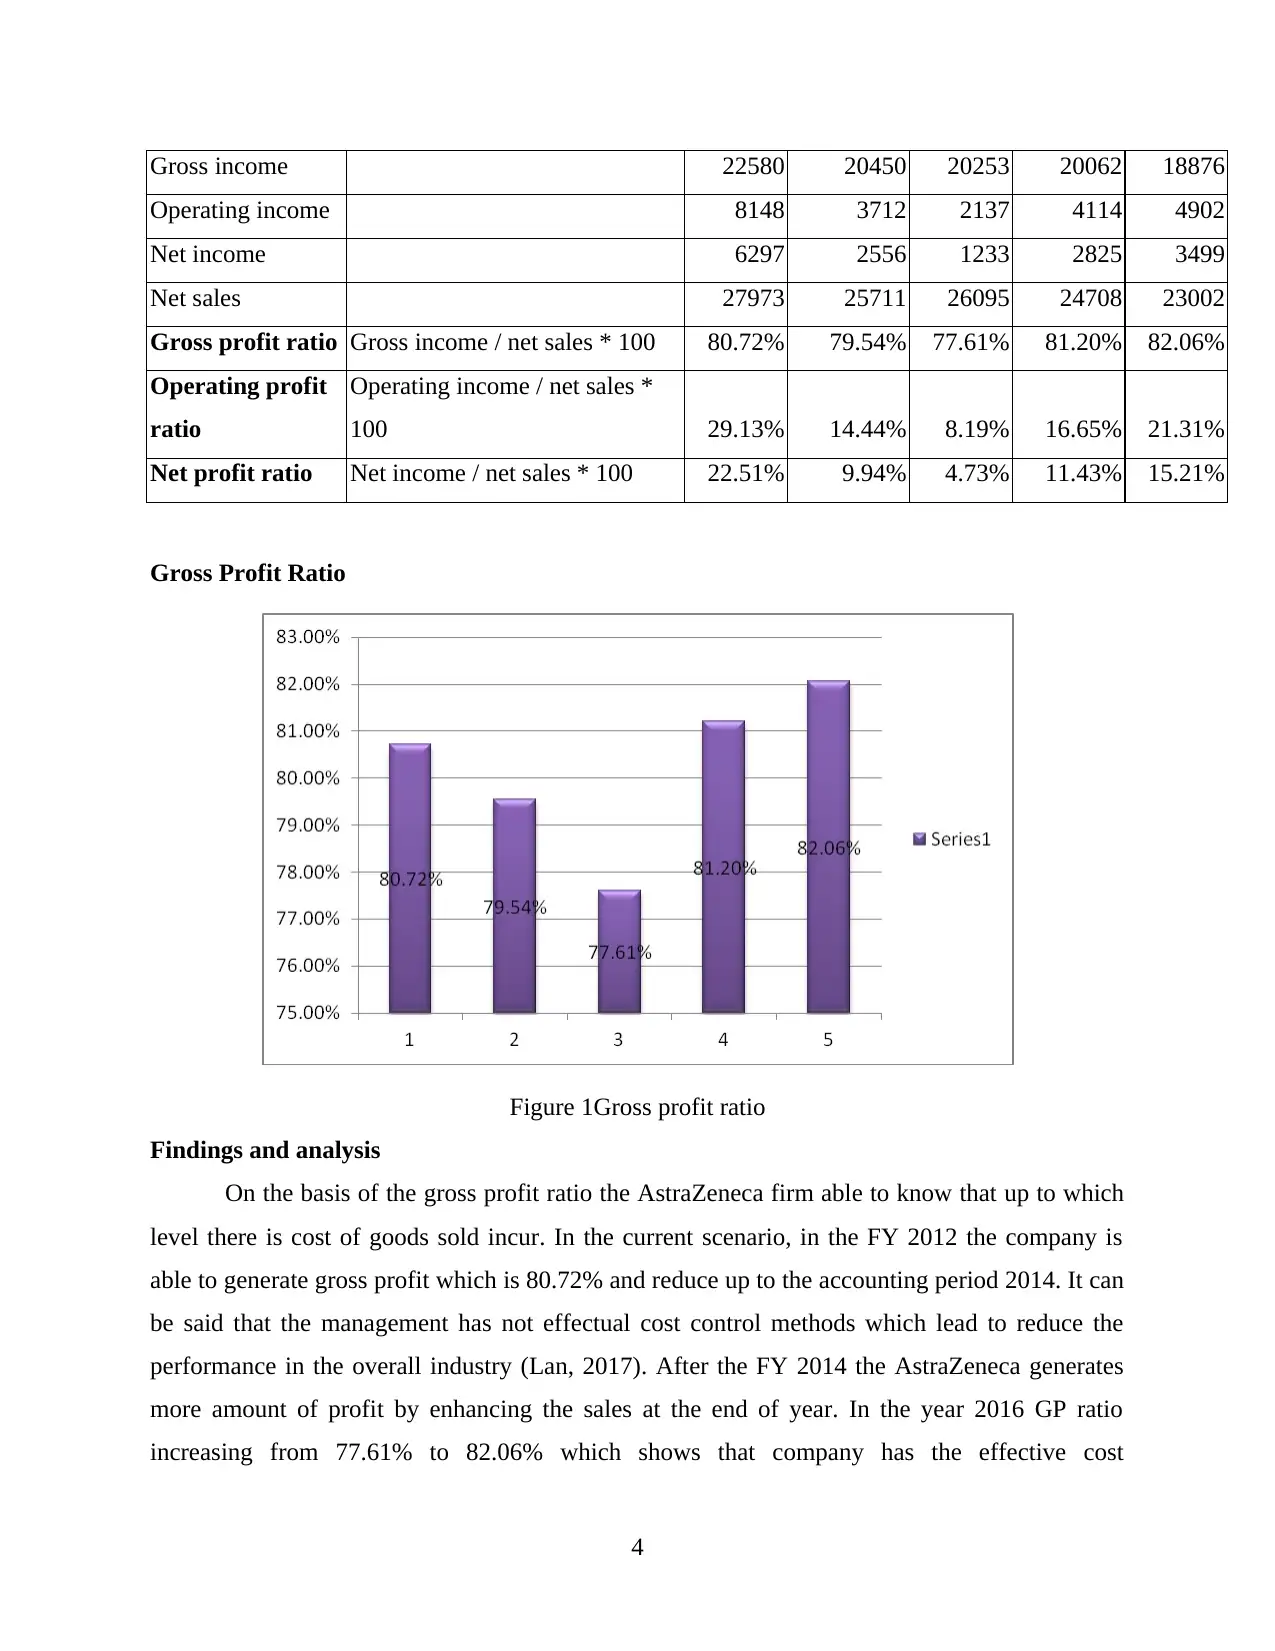
This report provides a comprehensive financial analysis of AstraZeneca PLC, a public limited company operating in the pharmaceutical and biotechnology industry. The analysis spans five accounting periods and utilizes various financial ratios to assess profitability, liquidity, efficiency, capital structure, and stock market performance. Specific ratios examined include gross profit ratio, operating profit ratio, net profit ratio, current ratio, quick ratio, debt-to-equity ratio, interest coverage ratio, stock turnover ratio, fixed assets turnover ratio, total assets turnover ratio, earnings per share, and return on equity. The report also discusses limitations of the analysis, such as reliance on quantitative data and the potential for variations in accounting practices. Finally, it offers suggestions for AstraZeneca to improve its financial performance, including enhancing marketing efforts, implementing cost-control strategies, increasing shareholder returns, and engaging in corporate social responsibility initiatives. The overall conclusion highlights AstraZeneca's relatively poor financial performance from 2012-2014, with improvement seen from 2014-2016, but still needing further strategic improvements.

FINANCIAL ANALYSIS
AND MANAGEMENT
(PART1)
AND MANAGEMENT
(PART1)
Paraphrase This Document
Need a fresh take? Get an instant paraphrase of this document with our AI Paraphraser


TABLE OF CONTENTS
TASK 1............................................................................................................................................3
Analysis of financial performance of the AstraZeneca Company over the five accounting
periods using financial ratios.......................................................................................................3
TASK 2..........................................................................................................................................15
Limitations and problems of the current analysis......................................................................15
TASK 3..........................................................................................................................................16
Suggestions to AstraZeneca firm in order to improvement and enhance financial performance
...................................................................................................................................................16
CONCLUSION..............................................................................................................................17
REFERENCES..............................................................................................................................18
1
⊘ This is a preview!⊘
Do you want full access?
Subscribe today to unlock all pages.

Trusted by 1+ million students worldwide

TABLE OF FIGURES
Figure 2Gross profit ratio................................................................................................................3
Figure 3Operating profit ratio..........................................................................................................4
Figure 4Net profit ratio....................................................................................................................5
Figure 5Current ratio.......................................................................................................................6
Figure 6Quick ratio..........................................................................................................................7
Figure 7Debt to equity ratio.............................................................................................................8
Figure 8Interest coverage ratio........................................................................................................9
Figure 9Stock turnover ratio..........................................................................................................10
Figure 10Fixed assets turnover ratio..............................................................................................11
Figure 11Total assets turnover ratio..............................................................................................12
Figure 12Earnings per ratio...........................................................................................................13
Figure 13Return on equity.............................................................................................................14
2
Paraphrase This Document
Need a fresh take? Get an instant paraphrase of this document with our AI Paraphraser

INTRODUCTION
Finance is just like a lifeline of the every business firm because without the respective
source a businessman cannot establish as well as exists in the industry or market. In this context,
it is necessary to analyse firm’s performance in terms of several aspects such as financials,
technical, operational etc. Higher the performance of in every aspect is better for the firm
because it supports to make and create effective brand image in the segment. Along with the
analysis to manage the financial resource is also one of the key aspects of the company. For
understanding financial analysis and management in the current case AstraZeneca firm is
selected which is a public limited company and operates in the Pharmaceutical as well as
Biotechnology industry of UK. The present report shows financial performance of the chosen
entity by taking base of different financial rations. In the second and third part of current study
limitations which are comes into consideration while doing the analysis and suggestion to
improve financial performance to the AstraZeneca management is described respectively.
TASK 1
Analysis of financial performance of the AstraZeneca Company over the five accounting periods
using financial ratios
For every company it is highly compulsory to analyse financial performance in the
industry by which the respective entrepreneur can assess that in which kind of direction it
performs. If there are management know financial position of the firm then able to reduce those
financial shortfalls which comes into existence in the past by framing effectual business
strategies (Saunders and Cornett, 2014). The current case study is all about the AstraZeneca
company which currently provide its products and services in the Pharmaceutical and
Biotechnology industry. To analyse its financial there are different measurements are available in
the in the accounting and financing world. Of the most effective measurement criteria are
financial ratios where many types are adopted by the management. Further, liquidity,
profitability, efficiency, capital structure and stock performance ratios are calculated and
analysed as below:
Profitability ratios
Name of ratios Formula 2012 2013 2014 2015 2016
3

Gross income 22580 20450 20253 20062 18876
Operating income 8148 3712 2137 4114 4902
Net income 6297 2556 1233 2825 3499
Net sales 27973 25711 26095 24708 23002
Gross profit ratio Gross income / net sales * 100 80.72% 79.54% 77.61% 81.20% 82.06%
Operating profit
ratio
Operating income / net sales *
100 29.13% 14.44% 8.19% 16.65% 21.31%
Net profit ratio Net income / net sales * 100 22.51% 9.94% 4.73% 11.43% 15.21%
Gross Profit Ratio
Figure 1Gross profit ratio
Findings and analysis
On the basis of the gross profit ratio the AstraZeneca firm able to know that up to which
level there is cost of goods sold incur. In the current scenario, in the FY 2012 the company is
able to generate gross profit which is 80.72% and reduce up to the accounting period 2014. It can
be said that the management has not effectual cost control methods which lead to reduce the
performance in the overall industry (Lan, 2017). After the FY 2014 the AstraZeneca generates
more amount of profit by enhancing the sales at the end of year. In the year 2016 GP ratio
increasing from 77.61% to 82.06% which shows that company has the effective cost
4
⊘ This is a preview!⊘
Do you want full access?
Subscribe today to unlock all pages.

Trusted by 1+ million students worldwide

management strategies as well as methods. It can be criticised that it not having those kinds of
strategies which supports to manage and reduce costing to produce medicines and drugs.
Operating Profit Ratio
Figure 1Operating profit ratio
Findings and analysis
According the above prepared graph of operating profit ratio it can be analysed that
company generates better operating income at the financing year ending 2012. In the current
study OP ratio of AstraZeneca Plc declines from 29.13% to 8.19% from the accounting year
2012 to the FY 2014. It clearly states that in the production and manufacturing process of
medicines and other pharmaceutical products there is cost incurs higher as compare to the
previous years (Bodie, 2013). Furthermore, from the FY 2014 to the financing period 2016
financial performance gets improve because of enhancing OP ratio from 8.19% to 21.31%. It can
be said that firm not able to use operation strategy in effective manner which lead to decline the
respective analysed ratio. In the current era, performance in terms of finance of AstraZeneca
entity is higher and profitable. It can suggested that the firm needs to carry on and continue with
the existing business strategies along with eliminating past techniques.
Net Profit Ratio
5
Paraphrase This Document
Need a fresh take? Get an instant paraphrase of this document with our AI Paraphraser

Figure 2Net profit ratio
Findings and analysis
The above graph is made using data of the net profit ratio of AstraZeneca firm which
indicates that management is how much able to improve sales along with reducing total indirect
costs. In the fiscal year 2012 the company had NP ratio 22.51% which reduce in the future year
up to 2014 and reaches to 4.73%. After the respective period NP ratio consistently enhance
which indicates that in the FY 2015 and 2016 total expenses which are associated with
AstraZeneca in indirect manner are reduces continuously. At the end of accounting year 2016 the
NP ratio of AstraZeneca enterprise is 15.21% which is better compare to the previous year
(Brigham and Houston, 2012). In the opposite side to this, overall financial and profitable
performance of the AstraZeneca is highly better at the period ending 2012 compare to other all.
Liquidity ratios
Name of ratios Formula 2012 2013 2014 2015 2016
Current assets 19048 20335 16697 16007 13262
Current liabilities 13903 16051 17330 14869 15256
Stock 2061 1909 1960 2143 2334
Prepaid expenses 0 1571 136 0 0
Current ratio
(CR) Current assets / current liabilities 1.37 1.27 0.96 1.08 0.87
6

Quick ratio
Current assets – (inventory +
prepaid expenses) / current
liabilities 1.22 1.05 0.84 0.93 0.72
Current Ratio
Figure 3Current ratio
Findings and analysis
Another kind of ratio which bsupports to assess financial performanec in the
Pharmaceutical and Bitechnology sector is current ratio by which the firm analsye that up to
which level it able to fulfil obligations in terms of debt and loan. It has been asceratined from the
aformentioned graph that at the end of 2012 current ratio was 1.37:1 which reduces continuolsy
up to the FY 2014. Apart from this, in the FY 2015 it was increase up to 1.08:1 and then deline
in the further FY that is 2016 and touch up to 0.87:1. While making comparison with the
standard ratio that is 2:1, the AstraZeneca not able to grab it and improve from the respective
benchmark. It can be said from this that current assists are more and higher in comparison to the
current liabilities which are having nature of cash convertible.
Quick Ratio
7
⊘ This is a preview!⊘
Do you want full access?
Subscribe today to unlock all pages.

Trusted by 1+ million students worldwide

Figure 4Quick ratio
Findings and analysis
It has been analysed that the AstraZeneca management able to combat and grab the ideal
ratio of quid or acid test in the FY 2012 and 2013 which is such as 1:1. The overall trend of the
quick ratio is reducing which shows that AstraZeneca is less capable to pay the debt amount
using the current assets and liabilities. At the initial year 2012 the ratio was 1.22:1 which reduce
up to 0.72:1 in the financial year 2016. It can be clearly visualized that quick ratio of
AstraZeneca company continuously fluctuating because of having lesser current liabilities and
assets other than prepaid costs and stock level (Doucette and et.al., 2012). In this, the firm needs
to frame techniques and tactics for improve the financial position and performance in the
Biotechnology and Pharmaceutical segment.
Capital structure ratios
Name of ratios Formula 2012 2013 2014 2015 2016
Debt 9409 8588 8397 14137 14495
Equity 23737 23224 19627 18490 14854
Debt to equity
ratio Debt / equity 0.40 0.37 0.72 0.78 0.98
EBIT 8148 3712 2137 4114 4902
Interest expenses 958 495 418 469 680
Interest coverage EBIT / expenses on interest 8.51 7.50 5.11 8.77 7.21
8
Paraphrase This Document
Need a fresh take? Get an instant paraphrase of this document with our AI Paraphraser

ratio
Debt to Equity ratio
Figure 5Debt to equity ratio
Findings and analysis
On the basis of above calculated and presented debt to equity ratio it can be interpreted
that it is incrsaing over the every years. From the FY 2012 to the fiscal period 2014 it increases
which is from 0.4:1 to 0.72:1. Afterwards at the end of the year 2016 the debt to equity ratio in
AstraZeneca goes up which is 0.98:1. On the basis of this trend of debt to equity ratio it has been
said that it takes more amount every year from the different source of finance. Along with this
the shareholders not invest and put sum of money in AstraZeneca to purchase its shares (Healy
and Palepu, 2012). Profit level improves in the last two years where AstraZeneca not need to
take debt but due to providing lesser return and dividend amount equity fund goes down
continuously which is the result that dent equity ratio increase from 0.4:1 to 0.98:1 from FY
2012 to 2016.
Interest Coverage Ratio
9

Figure 6Interest coverage ratio
Findings and analysis
The interest coverage ratio is the proportion of interest amount and earnings before
interest and tax (EBIT) which indicates that with the help of operating income AstraZeneca is
how much able to pay interest expenses. In the current case, interest coverage ratio of
AstraZeneca is 8.51 which reduces in FY 2013 and 2015 to 7.5and 7.21 respectively. Moreover,
in the accounting period of 2016 the mentioned ratio reduce from 2015 which is from 8.77 to
7.21 where it can be clearly analysed that it has cash flows as compare to the payments and
expenses of the interest charge. Apart from this, due to more amount of debt compare to equity
finance the management has to pay higher interest amount which lead to reduce such ratio (Aebi,
Sabato and Schmid, 2012).
Efficiency ratios
Name of ratios Formula 2012 2013 2014 2015 2016
Net sales 27973 25711 26095 24708 23002
Stock or inventory 2061 1909 1960 2143 2334
Stock turnover
ratio Net sales / stock 13.57 13.47 13.31 11.53 9.86
Net sales 27973 25711 26095 24708 23002
Fixed assets 34486 35564 41898 44117 49264
Fixed assets Net sales / fixed assets 0.81 0.72 0.62 0.56 0.47
10
⊘ This is a preview!⊘
Do you want full access?
Subscribe today to unlock all pages.

Trusted by 1+ million students worldwide
1 out of 21
Related Documents
Your All-in-One AI-Powered Toolkit for Academic Success.
 +13062052269
info@desklib.com
Available 24*7 on WhatsApp / Email
Unlock your academic potential
Copyright © 2020–2026 A2Z Services. All Rights Reserved. Developed and managed by ZUCOL.


