A Detailed Financial Analysis and Management Report on AstraZeneca
VerifiedAdded on 2020/01/15
|12
|2891
|467
Report
AI Summary
This report presents a financial analysis of AstraZeneca PLC, evaluating its operational performance, viability, stability, growth, and profitability. The analysis includes both quantitative and qualitative aspects, focusing on financial objectives, competitive environment, and the importance of Research and Development (R&D). The report examines various financial ratios, including profitability (Gross Margin, Net Margin), liquidity (Current Ratio, Quick Ratio), efficiency, and solvency ratios (Debt/Equity ratio, Interest Coverage ratio), to assess AstraZeneca's performance. The analysis reveals a decline in several key financial metrics in 2014, such as profitability and liquidity, indicating challenges in its financial performance. The report also discusses AstraZeneca's corporate strategies and priorities, including customer health improvement, R&D programs, and investment strategies. The conclusion suggests that while non-financial performance indicators offer potential for future growth, the company should focus on improving financial performance through strategies such as increasing sales revenue, controlling costs, and effective working capital management. The report provides recommendations for shareholders and offers insights into AstraZeneca's financial health and strategic direction.

FINANCIAL ANALYSIS
AND MANAGEMENT
AND MANAGEMENT
Paraphrase This Document
Need a fresh take? Get an instant paraphrase of this document with our AI Paraphraser

Table of Contents
INTRODUCTION......................................................................................................................1
Quantitative and Qualitative analysis.........................................................................................1
CONCLUSION..........................................................................................................................7
REFERENCES...........................................................................................................................8
APPENDIX................................................................................................................................9
INTRODUCTION
Financial analysis is the process of evaluating company's operation, viability,
stability, growth and profitability. However, financial management refers to the planning,
collecting, directing and controlling of firm’s financial operations. It is the process of
collection, procurement and utilizations of funds in an adequate manner to manage
organizational funds and achieve its set targets and objectives. AstraZeneca Plc is a UK
public limited company which operates in pharmaceutical and biologic products listed on
LSE of FTSE 100. Headquarter of the company is located in London, UK established in
1999. It is the world's seventh largest pharmaceutical company and operates in more than 100
countries. It deals with various diseases such as Cardiovascular, gas, infection, neuroscience,
respiratory and inflammation. The reason for choosing this company is that it has a
worldwide presence and good market position in the industry. Present project report will
carry out a critical analysis of its financial as well as non financial performance.
QUANTITATIVE AND QUALITATIVE ANALYSIS
The financial objective of the Astrazeneca (AZN) is to build sustainable growth and
strong position to track good growth in return by 2017. It had announced its new financial
targets in the year 2013 in which company decided to invest in new growth platforms and
launch new products to make extensive growth revenue by 2017. Further, it targets to build
strong market position by generating revenues greater than £45 billion by the year 2023
(AstraZeneca Strategy on track to deliver sustainable growth and value through innovations,
2014). It is continuously focusing to achieve this strategic target by serving large number of
patients. Moreover, the company focuses on creating value for the shareholders through
providing great medicines to protect patients from various diseases.
AZN is operating in a highly competitive environment in the market. It is facing
competition from Pfizer, Novartis, Sanofi, Merck & Co., Roche and GlaxoSmith Kline. Thus,
high competitive pressure is necessary for the company to drive some major changes to
compete effectively. It is a pharmaceutical company hence; Research and Development
(R&D) activities play a crucial role in the organization’s success. It makes company able to
determine patient’s requirement, new diseases and their proper treatment. Further,
technological improvement is another major key factor that drives profitability to the
business. R&D provides assistance to company to become aware about new and innovated
technology and its use (Titman, Martin and Keown, 2015). Thus, AZN needs to make
1 | P a g e
⊘ This is a preview!⊘
Do you want full access?
Subscribe today to unlock all pages.
Trusted by 1+ million students worldwide
investment in advanced technologies and get greater customer satisfaction. Moreover, it has
to upgrade its technology on a regular basis to improve its strategic capabilities.
Operational innovations and technological advancement make AZN able to enhance
their revenues and maximize their profitability. Moreover, customer relationship
management, providing demanded products at affordable prices, responsiveness assist
company to build customer loyalty and gain competitive advantages. Non-financial
performance indicator (NFPI) shows AZN's abilities to improve competitive positions such as
customer expectation, satisfaction, market share, on-time delivery of offered services,
employee-training, brand recognition, product quality, innovations and new product
development. In context to AZN, it launched new products, reduce its delivery time, increase
its number of services, make technological innovations, improve product quality and
introduce new pipeline which contributed to enhance customer satisfaction (Lasher, 2013).
This in turn, it leads to strength competitive position of AstraZeneca. Its Open Innovation
Platform programme assists company to discover and developing new medicines which cure
patient’s diseases in an adequate manner. Thus, there is a greater chance of achieving success
in future period.
Ratio analysis: It is the best way to analyse AZN's performance over the period. It
calculates various kinds of ratios such as profitability, liquidity, solvency, efficiency and
investor’s ratios to study how AZN is performing at the market place. Ratios have been
attached in Appendix.
Profitability ratio: AZN's profitability can be determined through profit and loss account. It
is a sign of company's operational performance and indicates result of its affairs (DeFusco
and et.al, 2015). Gross Margin (GM) and Net Margin (NM) are the most appropriate ratios to
analyse AZN's performance. It has been described hereunder: Gross margin: It indicates the relationship between gross profits and total revenues
where GP is the excess of AZN's sales over the cost of goods sold. As per the above
table, company's GM has been reduced from 79.54% to 77.61% in 2014 henceforth; it
shows that in this year, AZN is not performing in 2013 as well. The reason behind
such decrease in this year was its sales which got improved from 25,711 to 26,095
while cost got increased from 5261 to 5842. Thus, high percentage increase in cost to
11.04% than sales increase to 1.49% resulted in reduced GP from 20,450 to 20,253.
Therefore, it is a poor sign of AZN's performance because of lowering profits (Brooks
and Mukherjee, 2013).
2 | P a g e
Paraphrase This Document
Need a fresh take? Get an instant paraphrase of this document with our AI Paraphraser
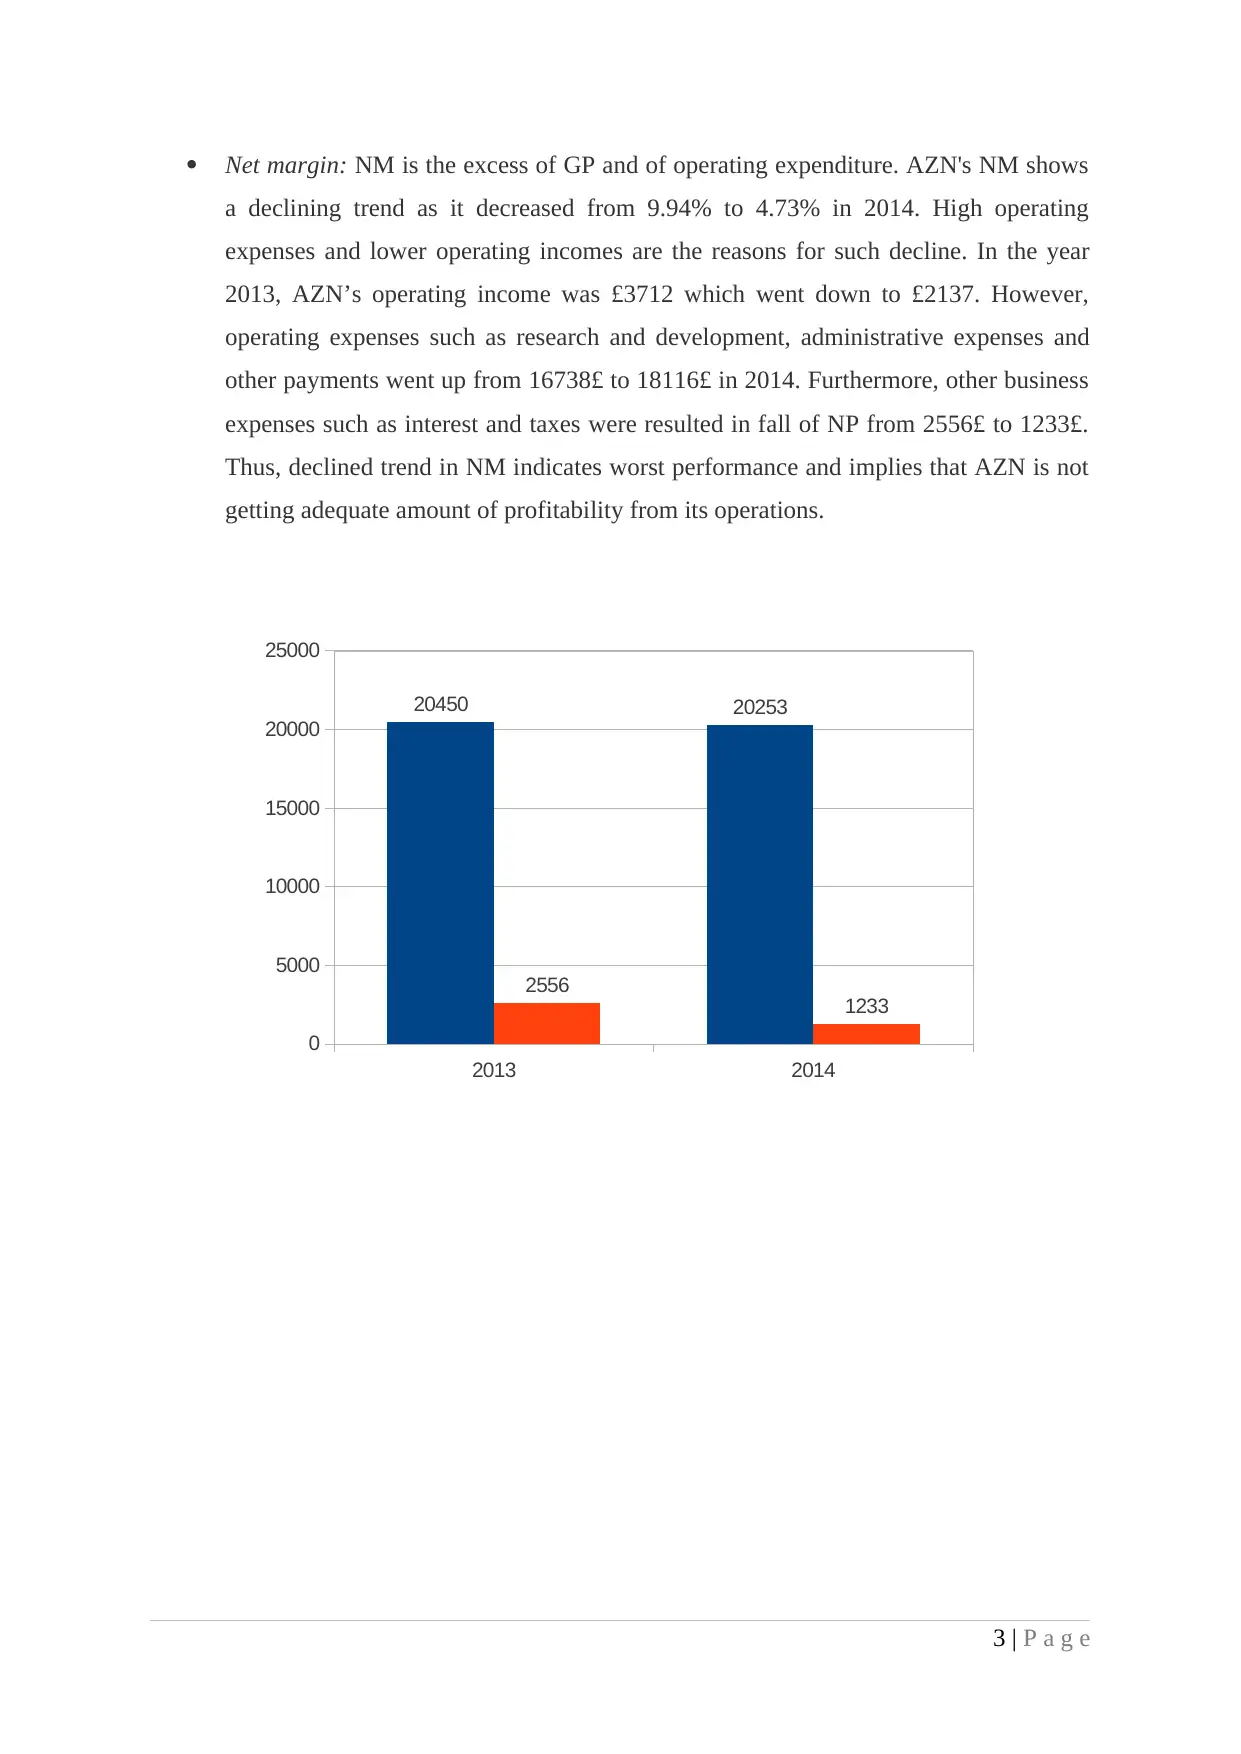
Net margin: NM is the excess of GP and of operating expenditure. AZN's NM shows
a declining trend as it decreased from 9.94% to 4.73% in 2014. High operating
expenses and lower operating incomes are the reasons for such decline. In the year
2013, AZN’s operating income was £3712 which went down to £2137. However,
operating expenses such as research and development, administrative expenses and
other payments went up from 16738£ to 18116£ in 2014. Furthermore, other business
expenses such as interest and taxes were resulted in fall of NP from 2556£ to 1233£.
Thus, declined trend in NM indicates worst performance and implies that AZN is not
getting adequate amount of profitability from its operations.
3 | P a g e
2013 2014
0
5000
10000
15000
20000
25000
20450 20253
2556 1233
Liquidity ratios: Liquidity indicates AZN's ability to make timely payments of their short
term obligations such as creditors, accounts payables and bank overdraft (Healy and Palepu,
2012). Current Ratio (CR) and Quick Ratio (QR) are very significant ratios that measure
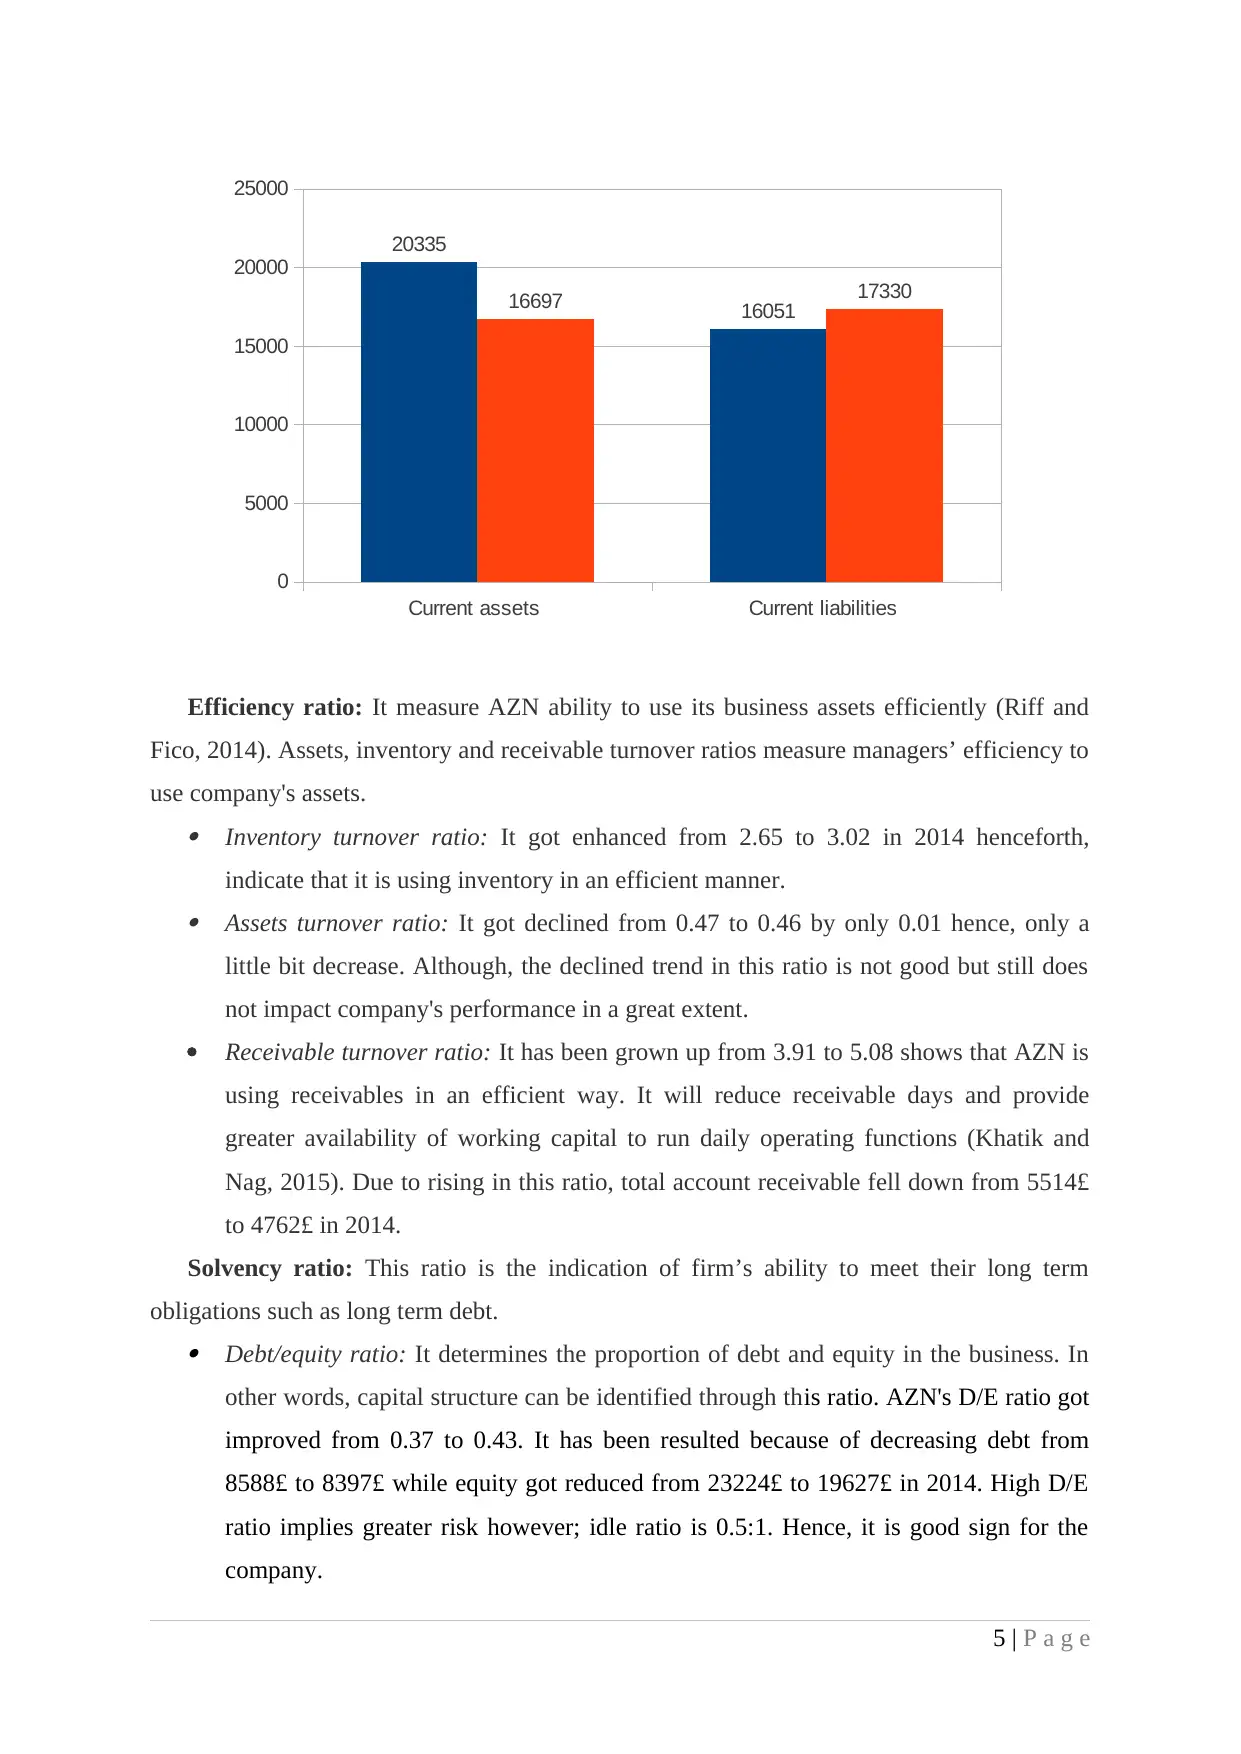
company's liquid position. Current Ratio (CR): It determines the relationship between AZN’s Current Assets
(CA) and Current Liabilities (CL). CA are the company's assets which gets converted
into cash within one year of accounting period whilst CL refers to AZN's short term
debts to which company needs to make payment within one year (Bhatia and Barwal,
2015). In context to Astrazeneca, its CR gets decreased from 1.27 to 0.96 in year
2014. It is because of decreasing company's CA and its increasing CL from £20,335
to £16,697 and £16051 to £17330 respectively. High decrease in CA by 17.89%
resulted in reduction of company’s liquidity position. This in turn, AZN's Working
Capital (WC) got reduced from £4284 to negative balance of £633 in 2014. Thus, it
became clear that in 2014, AZN does not have any amount of working capital to
support its daily functioning which creates adverse impact on the operating activities
(McKinney, 2015). Moreover, it is a sign of ability to discharge AZN's short term
obligations.
Quick ratio: Inventory is the most liquid ratio which can be converted into cash
easily. Hence, QR measure that in what extent AZN is able to pay off their creditors
and other short term liability without its inventory. Table presented that AZN's QR
fell down from 1.05 to 0.84. It got happened because increasing inventory from 1571£
to 136£. It indicates that AZN's ability to discharge their short term liabilities got
reduced as compare to 2013 (Shaik, 2015).
4 | P a g e
term obligations such as creditors, accounts payables and bank overdraft (Healy and Palepu,
2012). Current Ratio (CR) and Quick Ratio (QR) are very significant ratios that measure
company's liquid position. Current Ratio (CR): It determines the relationship between AZN’s Current Assets
(CA) and Current Liabilities (CL). CA are the company's assets which gets converted
into cash within one year of accounting period whilst CL refers to AZN's short term
debts to which company needs to make payment within one year (Bhatia and Barwal,
2015). In context to Astrazeneca, its CR gets decreased from 1.27 to 0.96 in year
2014. It is because of decreasing company's CA and its increasing CL from £20,335
to £16,697 and £16051 to £17330 respectively. High decrease in CA by 17.89%
resulted in reduction of company’s liquidity position. This in turn, AZN's Working
Capital (WC) got reduced from £4284 to negative balance of £633 in 2014. Thus, it
became clear that in 2014, AZN does not have any amount of working capital to
support its daily functioning which creates adverse impact on the operating activities
(McKinney, 2015). Moreover, it is a sign of ability to discharge AZN's short term
obligations.
Quick ratio: Inventory is the most liquid ratio which can be converted into cash
easily. Hence, QR measure that in what extent AZN is able to pay off their creditors
and other short term liability without its inventory. Table presented that AZN's QR
fell down from 1.05 to 0.84. It got happened because increasing inventory from 1571£
to 136£. It indicates that AZN's ability to discharge their short term liabilities got
reduced as compare to 2013 (Shaik, 2015).
4 | P a g e
⊘ This is a preview!⊘
Do you want full access?
Subscribe today to unlock all pages.
Trusted by 1+ million students worldwide
Efficiency ratio: It measure AZN ability to use its business assets efficiently (Riff and
Fico, 2014). Assets, inventory and receivable turnover ratios measure managers’ efficiency to
use company's assets. Inventory turnover ratio: It got enhanced from 2.65 to 3.02 in 2014 henceforth,
indicate that it is using inventory in an efficient manner. Assets turnover ratio: It got declined from 0.47 to 0.46 by only 0.01 hence, only a
little bit decrease. Although, the declined trend in this ratio is not good but still does
not impact company's performance in a great extent.
Receivable turnover ratio: It has been grown up from 3.91 to 5.08 shows that AZN is
using receivables in an efficient way. It will reduce receivable days and provide
greater availability of working capital to run daily operating functions (Khatik and
Nag, 2015). Due to rising in this ratio, total account receivable fell down from 5514£
to 4762£ in 2014.
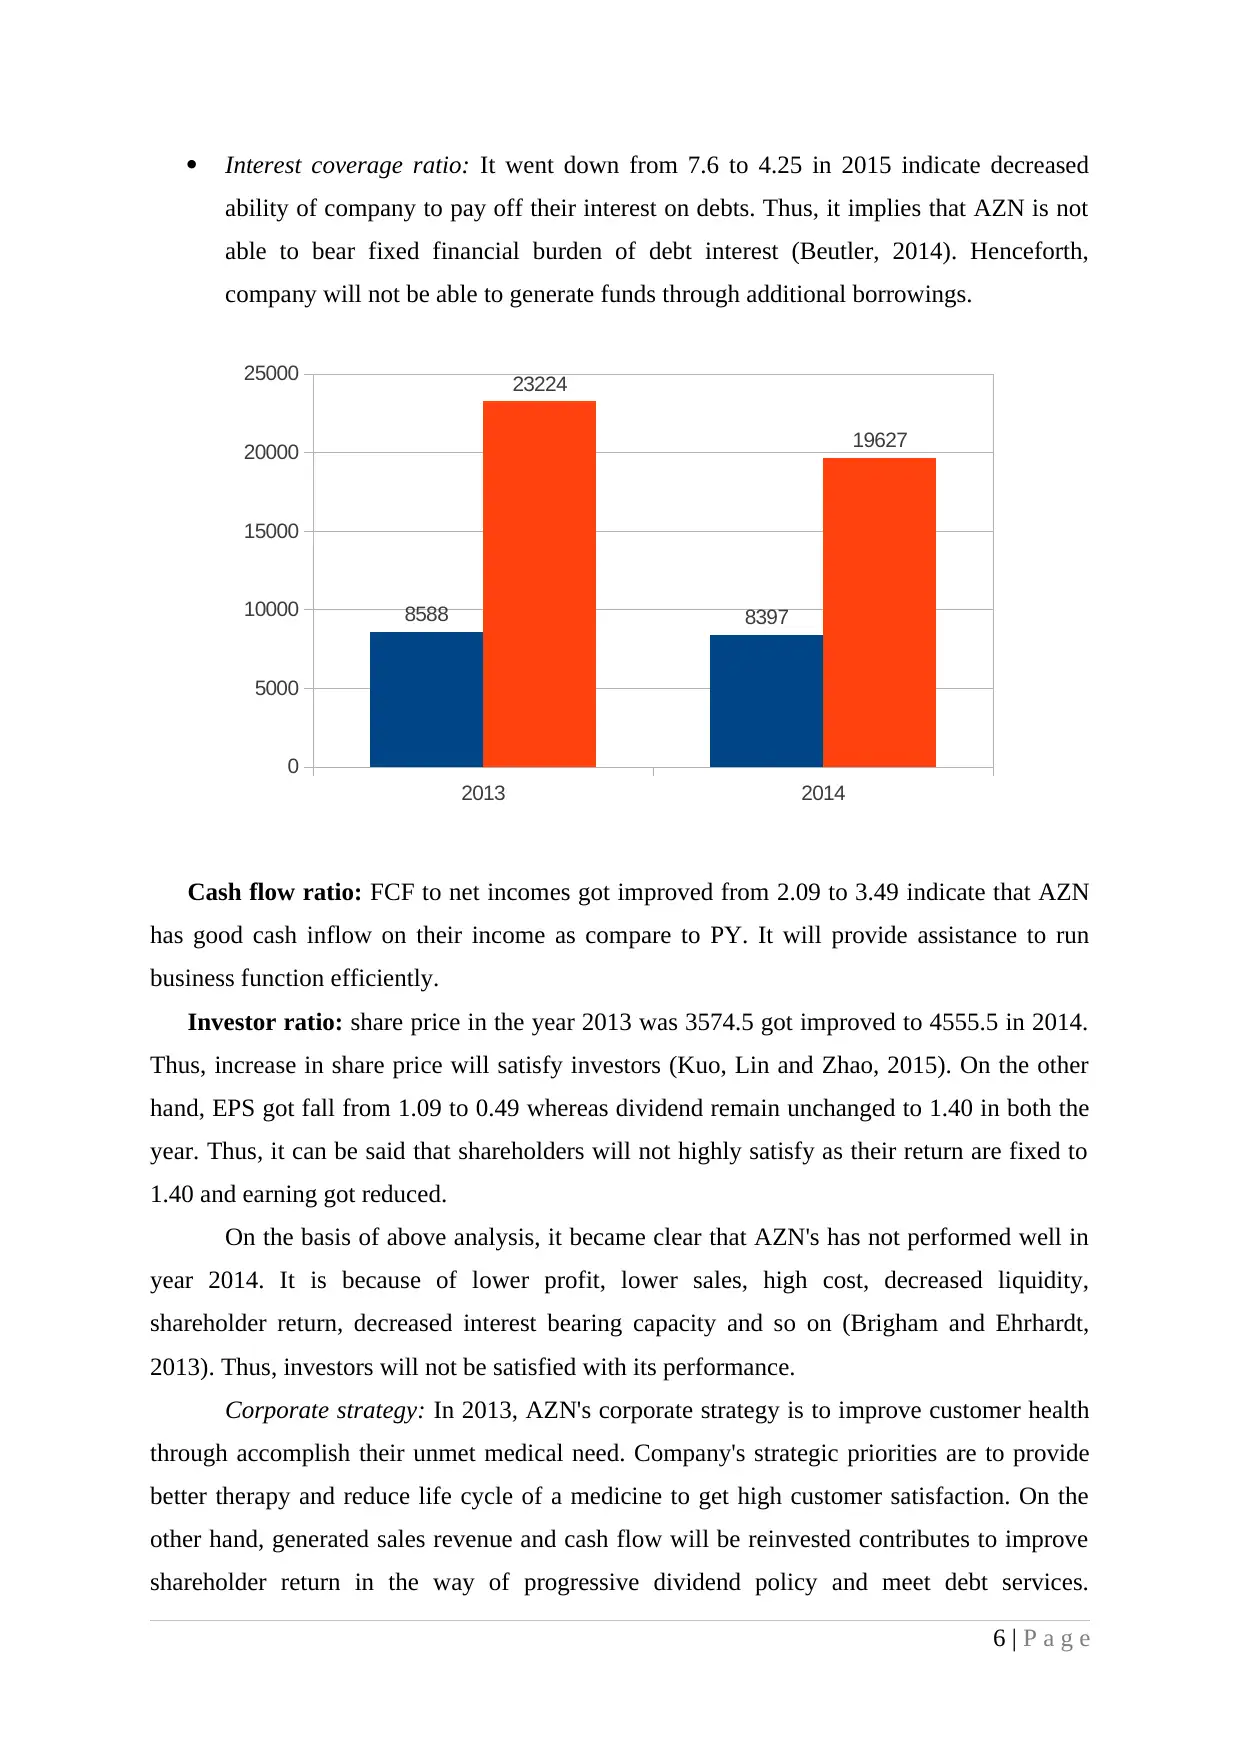
Solvency ratio: This ratio is the indication of firm’s ability to meet their long term
obligations such as long term debt. Debt/equity ratio: It determines the proportion of debt and equity in the business. In
other words, capital structure can be identified through this ratio. AZN's D/E ratio got
improved from 0.37 to 0.43. It has been resulted because of decreasing debt from
8588£ to 8397£ while equity got reduced from 23224£ to 19627£ in 2014. High D/E
ratio implies greater risk however; idle ratio is 0.5:1. Hence, it is good sign for the
company.
5 | P a g e
Current assets Current liabilities
0
5000
10000
15000
20000
25000
20335
1605116697 17330
Fico, 2014). Assets, inventory and receivable turnover ratios measure managers’ efficiency to
use company's assets. Inventory turnover ratio: It got enhanced from 2.65 to 3.02 in 2014 henceforth,
indicate that it is using inventory in an efficient manner. Assets turnover ratio: It got declined from 0.47 to 0.46 by only 0.01 hence, only a
little bit decrease. Although, the declined trend in this ratio is not good but still does
not impact company's performance in a great extent.
Receivable turnover ratio: It has been grown up from 3.91 to 5.08 shows that AZN is
using receivables in an efficient way. It will reduce receivable days and provide
greater availability of working capital to run daily operating functions (Khatik and
Nag, 2015). Due to rising in this ratio, total account receivable fell down from 5514£
to 4762£ in 2014.
Solvency ratio: This ratio is the indication of firm’s ability to meet their long term
obligations such as long term debt. Debt/equity ratio: It determines the proportion of debt and equity in the business. In
other words, capital structure can be identified through this ratio. AZN's D/E ratio got
improved from 0.37 to 0.43. It has been resulted because of decreasing debt from
8588£ to 8397£ while equity got reduced from 23224£ to 19627£ in 2014. High D/E
ratio implies greater risk however; idle ratio is 0.5:1. Hence, it is good sign for the
company.
5 | P a g e
Current assets Current liabilities
0
5000
10000
15000
20000
25000
20335
1605116697 17330
Paraphrase This Document
Need a fresh take? Get an instant paraphrase of this document with our AI Paraphraser
Interest coverage ratio: It went down from 7.6 to 4.25 in 2015 indicate decreased
ability of company to pay off their interest on debts. Thus, it implies that AZN is not
able to bear fixed financial burden of debt interest (Beutler, 2014). Henceforth,
company will not be able to generate funds through additional borrowings.
Cash flow ratio: FCF to net incomes got improved from 2.09 to 3.49 indicate that AZN
has good cash inflow on their income as compare to PY. It will provide assistance to run
business function efficiently.
Investor ratio: share price in the year 2013 was 3574.5 got improved to 4555.5 in 2014.
Thus, increase in share price will satisfy investors (Kuo, Lin and Zhao, 2015). On the other
hand, EPS got fall from 1.09 to 0.49 whereas dividend remain unchanged to 1.40 in both the
year. Thus, it can be said that shareholders will not highly satisfy as their return are fixed to
1.40 and earning got reduced.
On the basis of above analysis, it became clear that AZN's has not performed well in
year 2014. It is because of lower profit, lower sales, high cost, decreased liquidity,
shareholder return, decreased interest bearing capacity and so on (Brigham and Ehrhardt,
2013). Thus, investors will not be satisfied with its performance.
Corporate strategy: In 2013, AZN's corporate strategy is to improve customer health
through accomplish their unmet medical need. Company's strategic priorities are to provide
better therapy and reduce life cycle of a medicine to get high customer satisfaction. On the
other hand, generated sales revenue and cash flow will be reinvested contributes to improve
shareholder return in the way of progressive dividend policy and meet debt services.
6 | P a g e
2013 2014
0
5000
10000
15000
20000
25000
8588 8397
23224
19627
Moreover, its R & D programme refers to creation and acquisition of intellectual business
property through innovations, patent it to ensure assets protection and organize clinical
development programme to determine safety of offered medicines (Pioneering science life-
changing medicines, 2013). Thus, it can be said that AZN aims at delivering life changing
medicines to improve patient’s health. However, in 2014, its strategic priorities are
investment and reinvestment. Providing best quality of healthcare products, growth platforms
and pipeline are its priorities which satisfy customer to a great extent. Under the growth
platforms, Brillinta, diabetes, respiratory, emerging market and Japan generated large amount
of revenues for AZN. Moreover, balanced R & D investment, business development and
value enhancing programme deliver growth to the company. In this year, AZN doubled its
number of medicines to achieve high long-term growth and success.
CONCLUSION
The above project report concluded that financial performance of AZN is not very
impressive while NFP bring high opportunity to achieve potential growth in future period.
Therefore, it can be recommended shareholders neither sell their current holdings nor invest
more funds in AZN's equity. However, company should be advised that they should make
strategies and competent policies to improve their financial performance. They keep focus on
increasing their sales revenue, controlling cost, getting high profitability and managing
working capital to run operations successfully.
7 | P a g e
⊘ This is a preview!⊘
Do you want full access?
Subscribe today to unlock all pages.
Trusted by 1+ million students worldwide
REFERENCES
Books and Journals
Beutler, I.F., 2014. What makes wealth grow? A wealth sensitive financial statement
analysis. Journal of Financial Counseling and Planning. 25(1).
Bhatia, S. and Barwal, N., 2015. STUDY OF EFFICIENCY OF WORKING CAPITAL
MANAGEMENT PRACTICES AND THE EFFECT ON THE PROFITABILITY OF
THE FIRM: A STUDY OF REAL ESTATE SECTOR OF INDIA. Indian Journal of
Accounting. 47. p. 1.
Brigham, E. and Ehrhardt, M., 2013. Financial management: Theory & practice. Cengage
Learning.
Brooks, R. and Mukherjee, A.K., 2013. Financial management: core concepts. Pearson.
DeFusco, R.A. and et.al., 2015. Quantitative investment analysis. John Wiley & Sons.
Healy, P. and Palepu, K., 2012. Business Analysis Valuation: Using Financial Statements.
Cengage Learning.
Khatik, S.K. and Nag, A.K., 2015. PERFORMANCE MEASUREMENT SYSTEM IN
INDIAN BANKING SECTOR IN CAMEL FRAMEWORK: A COMPARATIVE
STUDY OF PRIVATE AND FOREIGN BANKS IN INDIA. Delhi Business Review.
16(1). p. 75.
Kuo, W.Y., Lin, T.C. and Zhao, J., 2015. Cognitive limitation and investment performance:
Evidence from limit order clustering. Review of Financial Studies. 28(3). pp. 838-875.
Lasher, W.R., 2013. Practical financial management. Nelson Education.
McKinney, J.B., 2015. Effective financial management in public and nonprofit agencies.
ABC-CLIO.
Riff, D., Lacy, S. and Fico, F., 2014. Analyzing media messages: Using quantitative content
analysis in research. Routledge.
Shaik, S., 2015. Impact of liquidity risk on variations in efficiency and productivity: A panel
gamma simulated maximum likelihood estimation. European Journal of Operational
Research. 245(2). pp. 463-469.
Titman, S., Martin, J.D. and Keown, A.J., 2015. Financial management: Principles and
applications. Prentice Hall.
Online
AstraZeneca Strategy on track to deliver sustainable growth and value through innovations,
2014. [Online]. Available through:
<https://www.astrazeneca.com/our-company/media-centre/press-releases/2014/
astrazeneca-strategy-update-institutional-investors-financial-analysts-
18112014.html>. [Accessed on 18th February, 2016].
Pioneering science life-changing medicines, 2013. [Pdf]. Available through:
<http://www.astrazeneca-annualreports.com/2013/_assets/pdfs/Strategic_report.pdf>.
[Accessed on 18th February, 2016].
8 | P a g e
Paraphrase This Document
Need a fresh take? Get an instant paraphrase of this document with our AI Paraphraser
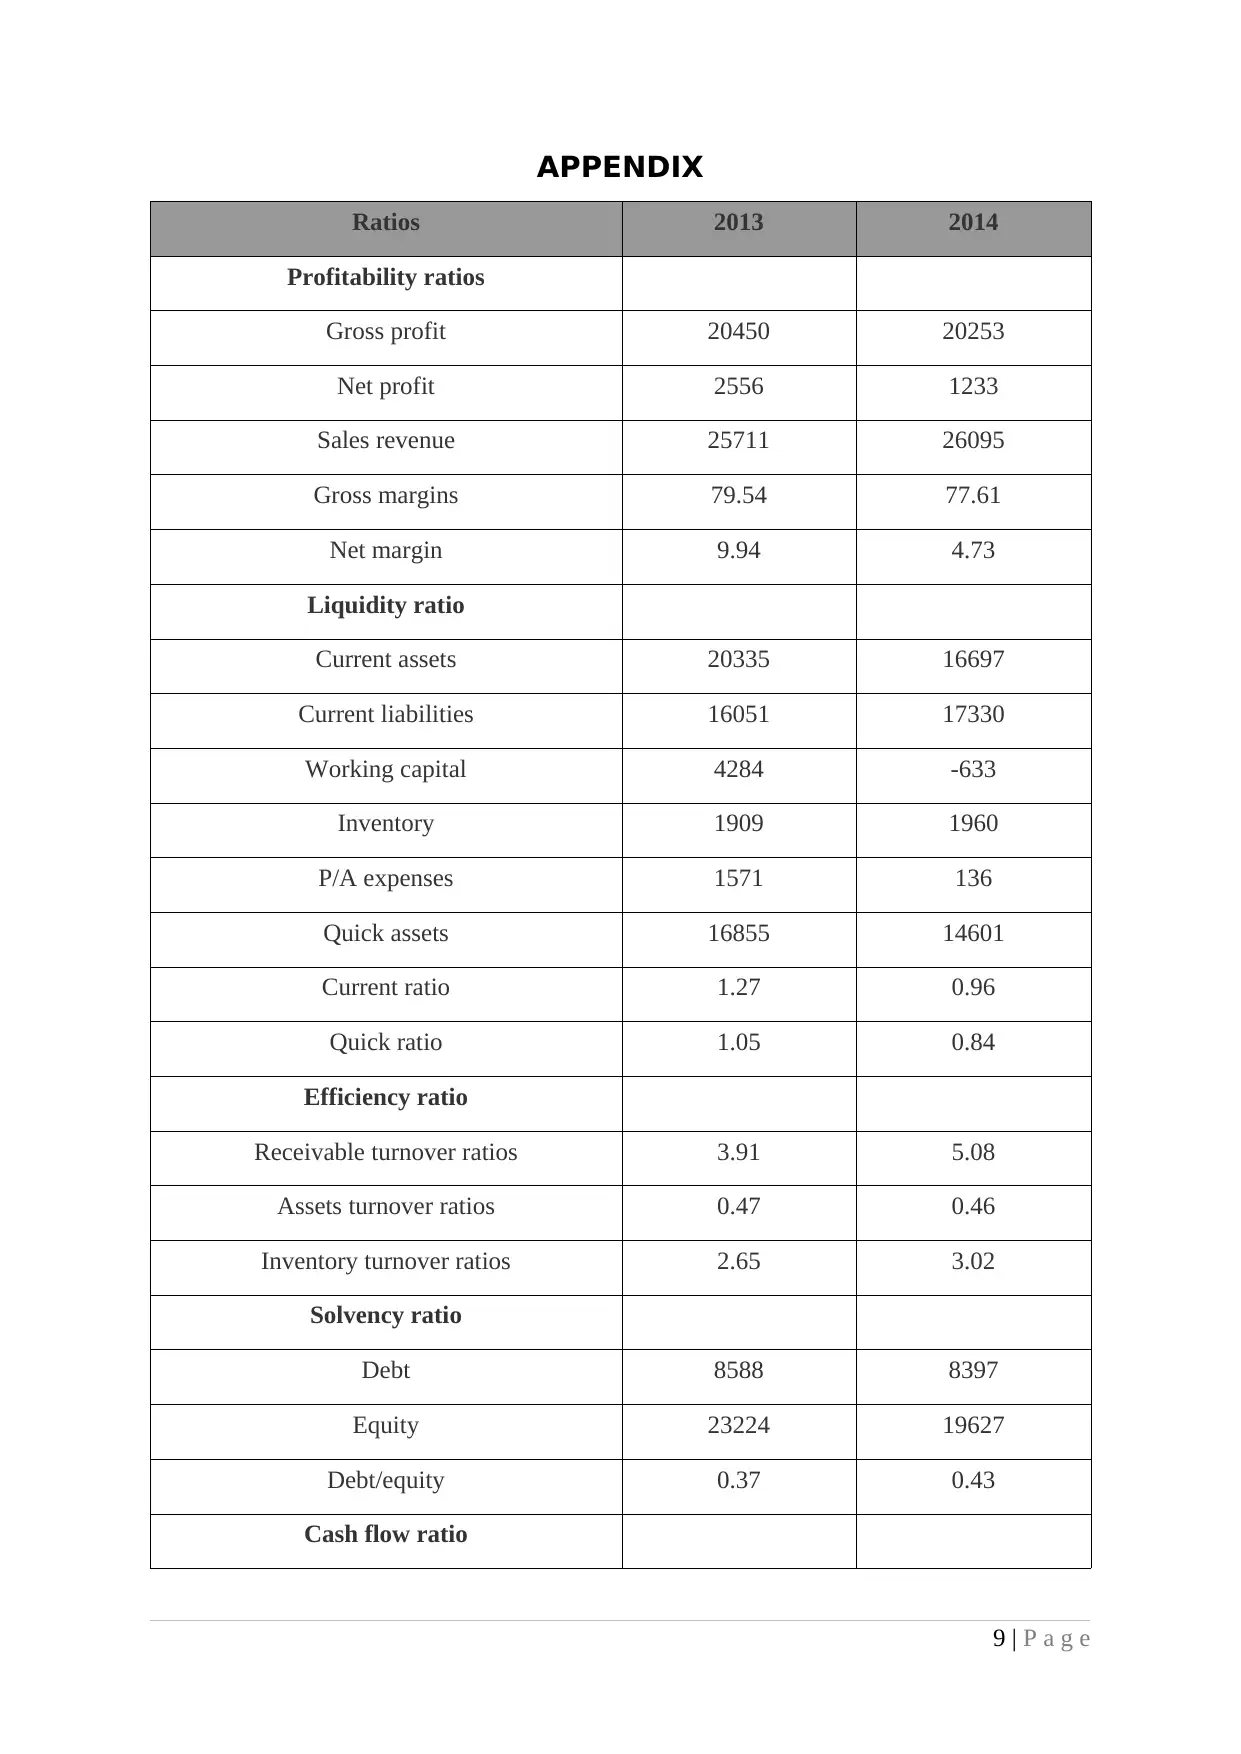
APPENDIX
Ratios 2013 2014
Profitability ratios
Gross profit 20450 20253
Net profit 2556 1233
Sales revenue 25711 26095
Gross margins 79.54 77.61
Net margin 9.94 4.73
Liquidity ratio
Current assets 20335 16697
Current liabilities 16051 17330
Working capital 4284 -633
Inventory 1909 1960
P/A expenses 1571 136
Quick assets 16855 14601
Current ratio 1.27 0.96
Quick ratio 1.05 0.84
Efficiency ratio
Receivable turnover ratios 3.91 5.08
Assets turnover ratios 0.47 0.46
Inventory turnover ratios 2.65 3.02
Solvency ratio
Debt 8588 8397
Equity 23224 19627
Debt/equity 0.37 0.43
Cash flow ratio
9 | P a g e

Free cash flow/Net income 2.09 3.49
Investor ratio
Earnings per share 1.02 0.49
Share price 3574.5 4555.5
Dividend 1.4 1.4
10 | P a g e
Investor ratio
Earnings per share 1.02 0.49
Share price 3574.5 4555.5
Dividend 1.4 1.4
10 | P a g e
⊘ This is a preview!⊘
Do you want full access?
Subscribe today to unlock all pages.
Trusted by 1+ million students worldwide
1 out of 12
Related Documents


Your All-in-One AI-Powered Toolkit for Academic Success.
+13062052269
info@desklib.com
Available 24*7 on WhatsApp / Email
![[object Object]](/_next/static/media/star-bottom.7253800d.svg)
Unlock your academic potential
Copyright © 2020–2026 A2Z Services. All Rights Reserved. Developed and managed by ZUCOL.