Analyzing AstraZeneca plc: Financial Decision-Making and Ratios
VerifiedAdded on 2023/05/27
|19
|3878
|186
Report
AI Summary
This report provides a comprehensive financial analysis of AstraZeneca plc, a pharmaceutical company, using key financial ratios over a five-year period to evaluate its performance in terms of profitability, liquidity, efficiency, and gearing. The analysis reveals fluctuations in net profit, a slight fall in liquidity, and an increase in debt levels, suggesting areas for improvement in efficiency and capital structure. Additionally, the report explores investment appraisal techniques such as NPV and IRR to assess the viability of potential investments, and considers the possibility of acquiring another company. It concludes with an overall assessment of AstraZeneca plc's financial health and strategic options.
Running head: FINANCE FOR DECISION MAKING
Finance for Decision Making
Name of the Student:
Name of the University:
Author’s Note
Finance for Decision Making
Name of the Student:
Name of the University:
Author’s Note
Paraphrase This Document
Need a fresh take? Get an instant paraphrase of this document with our AI Paraphraser
1FINANCE FOR DECISION MAKING
Table of Contents
1. Introduction..............................................................................................................................3
1.1 Rationale of the Report..........................................................................................................3
1.2 Background of the Company............................................................................................3
1.3 Main Findings...................................................................................................................4
1.4 Structure of the Report......................................................................................................4
2. Evaluation of Current Financial Performance..........................................................................4
2.1 Ratio Analysis........................................................................................................................4
2.2 Evaluation of Ratios........................................................................................................10
2.3 Limitation of Financial Ratios........................................................................................11
3. Future Investment Appraisal..................................................................................................11
3.1 Evaluation of NPV Analysis................................................................................................12
3.2 Evaluation of IRR method..............................................................................................12
3.3 Investment Appraisal Results..........................................................................................12
4. Acquisition of Other Company..............................................................................................14
4.1 Rationale of Choosing the Company...................................................................................14
4.2 Synergy Gain to the Business.........................................................................................14
4.3 Financing Needs..............................................................................................................14
4.4 Risk and Uncertainties....................................................................................................15
4.5 Implication of the Results...............................................................................................15

2FINANCE FOR DECISION MAKING
5. Conclusion..............................................................................................................................15
Reference.......................................................................................................................................17
5. Conclusion..............................................................................................................................15
Reference.......................................................................................................................................17
⊘ This is a preview!⊘
Do you want full access?
Subscribe today to unlock all pages.
Trusted by 1+ million students worldwide
3FINANCE FOR DECISION MAKING
1. Introduction
1.1 Rationale of the Report
The main purpose of this assessment is to analyze the financial statement of a company which
is engaged in the business of Pharmaceutical Company. The assessment would be analyzing the
financial performance of the business on the basis of key financial ratios of the company and the
same is computed for a period of five years. The company has also undertaken an investment for
which an investment appraisal is to be undertaken. The business would also be analyzing the
ability of the business to acquire another company.
1.2 Background of the Company
AstraZeneca plc is engaged in the business of Pharmaceutical business and the company is
Anglo-swedish in nature and is also considered to be a multinational company. The headquarter
of the company is situated in Cambridge and the business expends extensively on Research and
Development and the activities of the business is mainly carried out in three sites which are
Cambridge, Gaithersbury and Maryland (Astrazeneca.com. 2018). The company is known to
produce the best medicines for serious diseases. The company was formed through a merger
agreement between companies Astra AB and Zeneca Group. The profit of the business for the
year 2017 is shown to be $ 2,868 million and the same is shown to have significantly improved
over the years. This shows that the business is growing in terms of generation of profits of the
business.
Paraphrase This Document
Need a fresh take? Get an instant paraphrase of this document with our AI Paraphraser
4FINANCE FOR DECISION MAKING
1.3 Main Findings
The main findings of the assessment is to effectively analyze the financial situation of the
AstraZeneca plc and also conduct investment appraisal techniques for deciding whether the
project which the management wants to invest in is worth making investment or not.
1.4 Structure of the Report
The assessment includes details analysis of the financial performance of the business for
which is to be evaluated with the help of key financial ratios which are included in section 2 of
the assessment. The section 3 of the assessment would be considering the investment which the
company is considering and the same will be evaluated on the basis of investment appraisal
techniques like NPV and IRR approach. The section 4 would be containing an analysis of the
option whether the company can acquire a business of a anther company or not. The last section
which is section 5 would be stating the conclusion of the analysis which is conducted in he
earlier sections.
2. Evaluation of Current Financial Performance
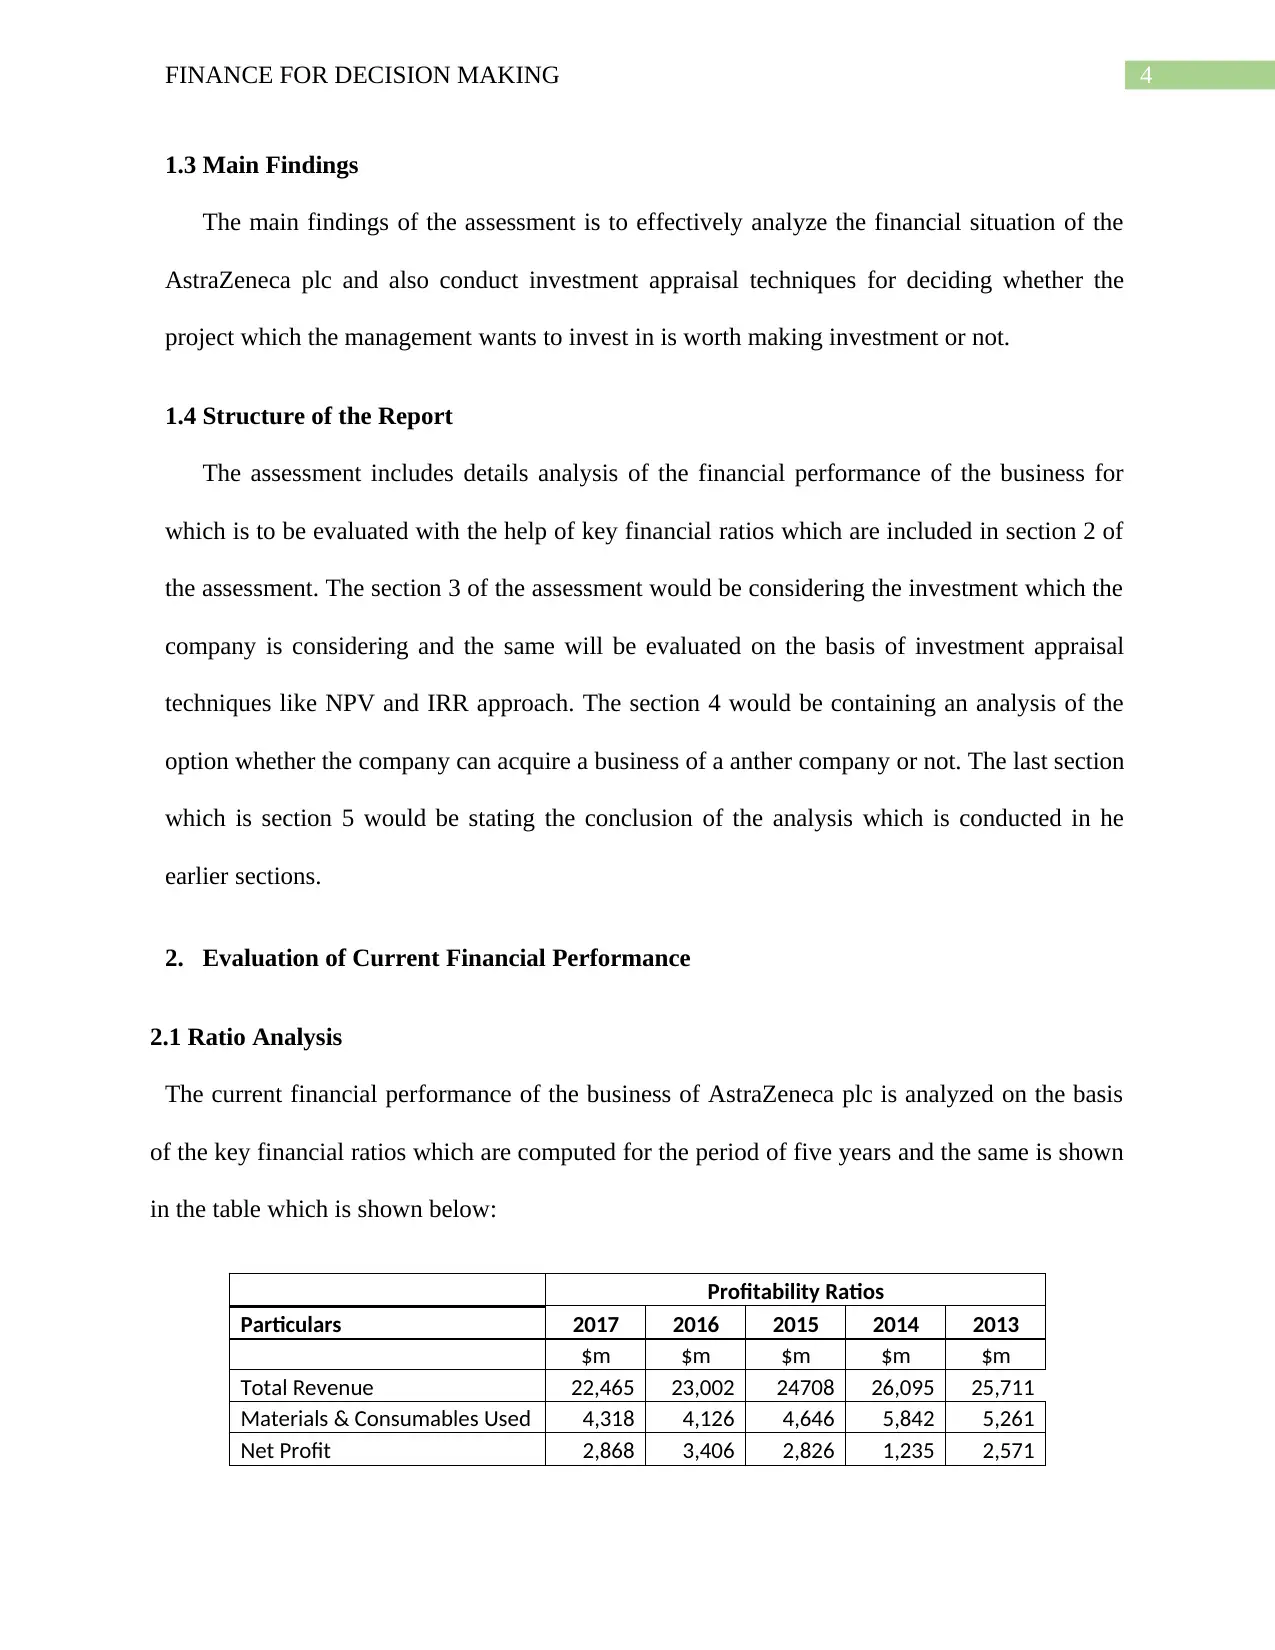
2.1 Ratio Analysis
The current financial performance of the business of AstraZeneca plc is analyzed on the basis
of the key financial ratios which are computed for the period of five years and the same is shown
in the table which is shown below:
Profitability Ratios
Particulars 2017 2016 2015 2014 2013
$m $m $m $m $m
Total Revenue 22,465 23,002 24708 26,095 25,711
Materials & Consumables Used 4,318 4,126 4,646 5,842 5,261
Net Profit 2,868 3,406 2,826 1,235 2,571
1.3 Main Findings
The main findings of the assessment is to effectively analyze the financial situation of the
AstraZeneca plc and also conduct investment appraisal techniques for deciding whether the
project which the management wants to invest in is worth making investment or not.
1.4 Structure of the Report
The assessment includes details analysis of the financial performance of the business for
which is to be evaluated with the help of key financial ratios which are included in section 2 of
the assessment. The section 3 of the assessment would be considering the investment which the
company is considering and the same will be evaluated on the basis of investment appraisal
techniques like NPV and IRR approach. The section 4 would be containing an analysis of the
option whether the company can acquire a business of a anther company or not. The last section
which is section 5 would be stating the conclusion of the analysis which is conducted in he
earlier sections.
2. Evaluation of Current Financial Performance
2.1 Ratio Analysis
The current financial performance of the business of AstraZeneca plc is analyzed on the basis
of the key financial ratios which are computed for the period of five years and the same is shown
in the table which is shown below:
Profitability Ratios
Particulars 2017 2016 2015 2014 2013
$m $m $m $m $m
Total Revenue 22,465 23,002 24708 26,095 25,711
Materials & Consumables Used 4,318 4,126 4,646 5,842 5,261
Net Profit 2,868 3,406 2,826 1,235 2,571
5FINANCE FOR DECISION MAKING
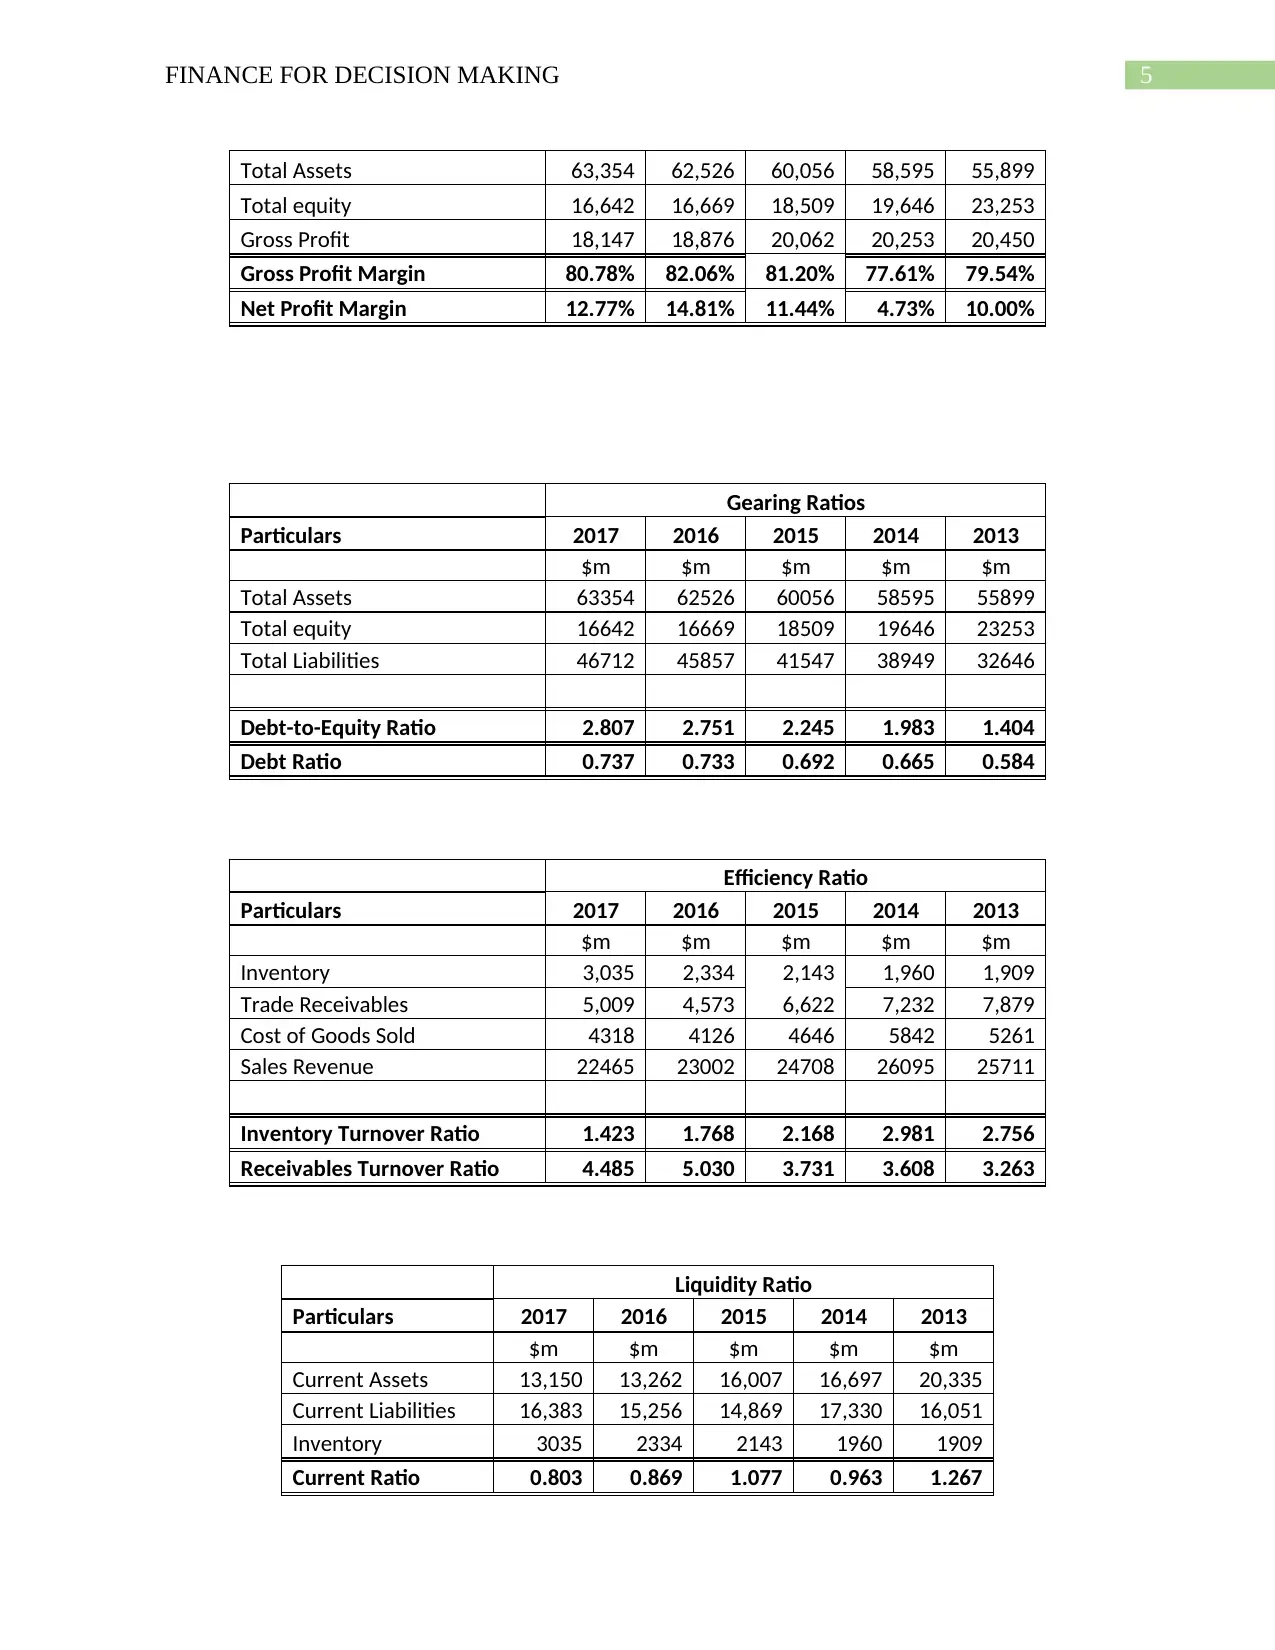
Total Assets 63,354 62,526 60,056 58,595 55,899
Total equity 16,642 16,669 18,509 19,646 23,253
Gross Profit 18,147 18,876 20,062 20,253 20,450
Gross Profit Margin 80.78% 82.06% 81.20% 77.61% 79.54%
Net Profit Margin 12.77% 14.81% 11.44% 4.73% 10.00%
Gearing Ratios
Particulars 2017 2016 2015 2014 2013
$m $m $m $m $m
Total Assets 63354 62526 60056 58595 55899
Total equity 16642 16669 18509 19646 23253
Total Liabilities 46712 45857 41547 38949 32646
Debt-to-Equity Ratio 2.807 2.751 2.245 1.983 1.404
Debt Ratio 0.737 0.733 0.692 0.665 0.584
Efficiency Ratio
Particulars 2017 2016 2015 2014 2013
$m $m $m $m $m
Inventory 3,035 2,334 2,143 1,960 1,909
Trade Receivables 5,009 4,573 6,622 7,232 7,879
Cost of Goods Sold 4318 4126 4646 5842 5261
Sales Revenue 22465 23002 24708 26095 25711
Inventory Turnover Ratio 1.423 1.768 2.168 2.981 2.756
Receivables Turnover Ratio 4.485 5.030 3.731 3.608 3.263
Liquidity Ratio
Particulars 2017 2016 2015 2014 2013
$m $m $m $m $m
Current Assets 13,150 13,262 16,007 16,697 20,335
Current Liabilities 16,383 15,256 14,869 17,330 16,051
Inventory 3035 2334 2143 1960 1909
Current Ratio 0.803 0.869 1.077 0.963 1.267
⊘ This is a preview!⊘
Do you want full access?
Subscribe today to unlock all pages.
Trusted by 1+ million students worldwide
6FINANCE FOR DECISION MAKING
Quick ratio 0.617 0.716 0.932 0.850 1.148
Profitability Ratios
The above tables which are shown above, depicts the key areas of the business which are
liquidity, solvency, profitability and gearing ratios. The profitability ratio table shows gross
profit margin and net profit ratio of the business. Both the estimates are considered to be
important indicators for overall success of the business (Delen, Kuzey and Uyar 2013). The gross
profit ratio shows 80.28% for the year 2017 which depicts that the profitability of the business
has fallen slightly in comparison to previous year’s estimate. Similarly, the net profit ratio has
also decreased from previous year’s analysis which suggest that the overall profitability of
AstraZeneca plc has reduced significantly. The main reason which can be suggested for the fall
in the profitability of the business is due to fall in the sales of the business in comparison to
previous year. In a similar situation, the main competitor of AstraZeneca plc which is Pfizer has
experienced an increase in the profitability of the business (Ongore and Kusa 2013). The
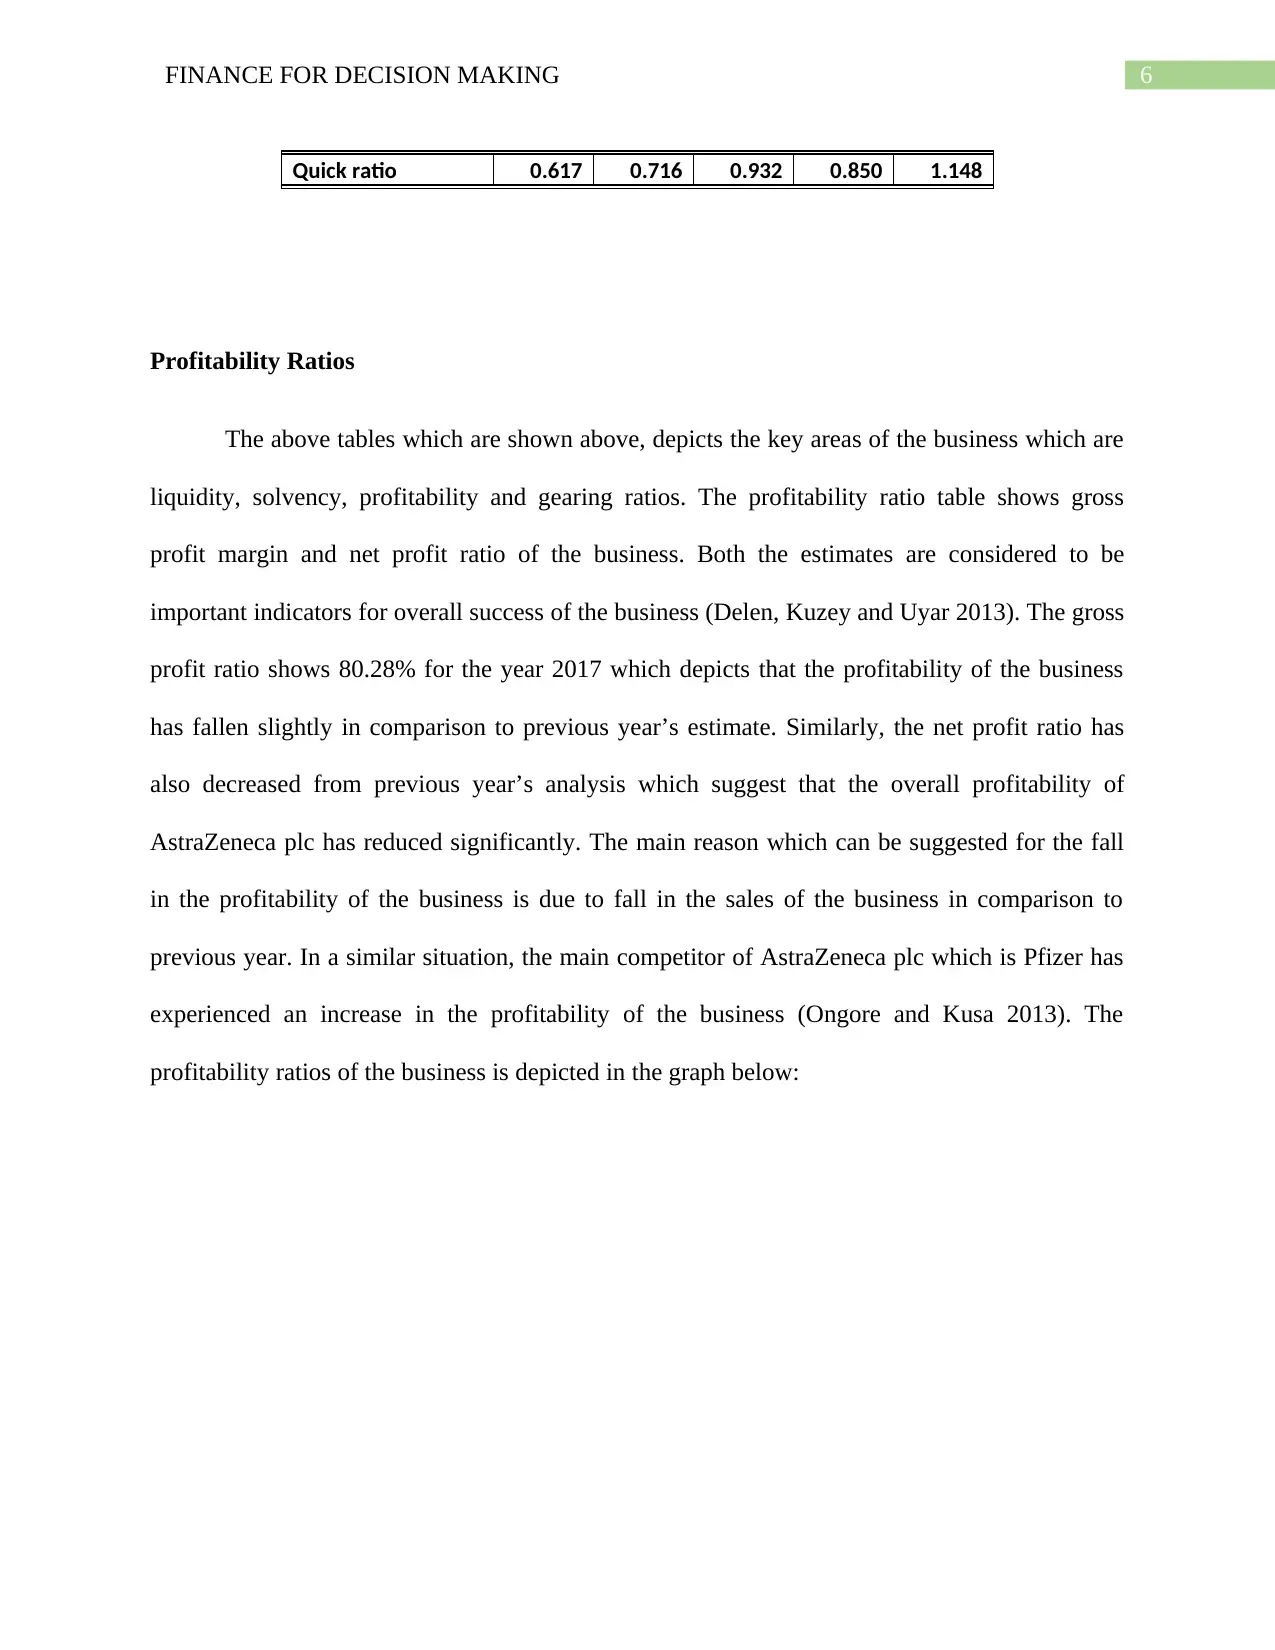
profitability ratios of the business is depicted in the graph below:
Quick ratio 0.617 0.716 0.932 0.850 1.148
Profitability Ratios
The above tables which are shown above, depicts the key areas of the business which are
liquidity, solvency, profitability and gearing ratios. The profitability ratio table shows gross
profit margin and net profit ratio of the business. Both the estimates are considered to be
important indicators for overall success of the business (Delen, Kuzey and Uyar 2013). The gross
profit ratio shows 80.28% for the year 2017 which depicts that the profitability of the business
has fallen slightly in comparison to previous year’s estimate. Similarly, the net profit ratio has
also decreased from previous year’s analysis which suggest that the overall profitability of
AstraZeneca plc has reduced significantly. The main reason which can be suggested for the fall
in the profitability of the business is due to fall in the sales of the business in comparison to
previous year. In a similar situation, the main competitor of AstraZeneca plc which is Pfizer has
experienced an increase in the profitability of the business (Ongore and Kusa 2013). The
profitability ratios of the business is depicted in the graph below:
Paraphrase This Document
Need a fresh take? Get an instant paraphrase of this document with our AI Paraphraser
7FINANCE FOR DECISION MAKING
2017 2016 2015 2014 2013
0.00%
2.00%
4.00%
6.00%
8.00%
10.00%
12.00%
14.00%
16.00%
Net Profit Margin
Figure 1: (Chart Showing Net profit ratio)
Source: (Created by the author)
The graph shows fluctuation in net profit of the business and the same is shown to be
highest in 2016 from where there is a slight fall.
Liquidity Ratios
The liquidity ratios of a business reveal the ability of the business to meet the current
obligations of the business effectively. In case of AstraZeneca plc, both the current ratios and
quick ratio of the business shows fall in the estimates in comparison to estimates which was
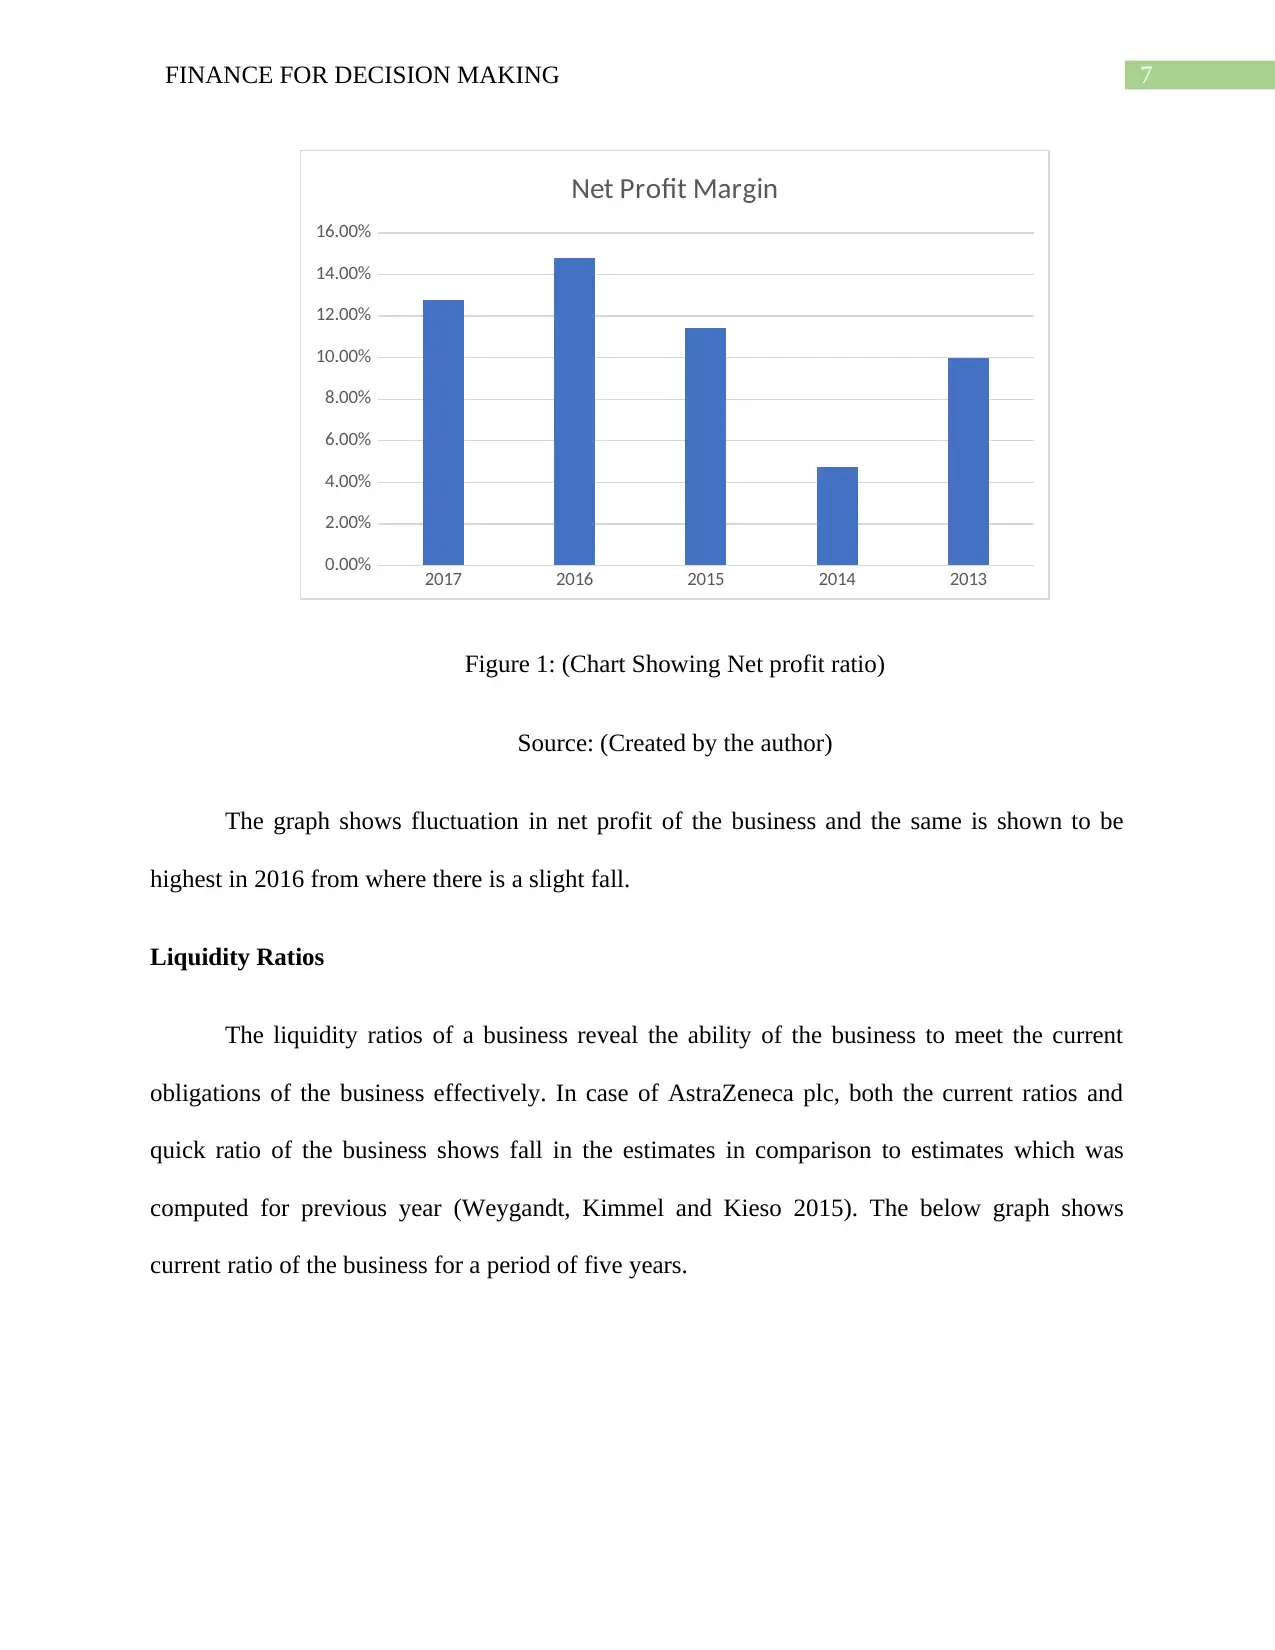
computed for previous year (Weygandt, Kimmel and Kieso 2015). The below graph shows
current ratio of the business for a period of five years.
2017 2016 2015 2014 2013
0.00%
2.00%
4.00%
6.00%
8.00%
10.00%
12.00%
14.00%
16.00%
Net Profit Margin
Figure 1: (Chart Showing Net profit ratio)
Source: (Created by the author)
The graph shows fluctuation in net profit of the business and the same is shown to be
highest in 2016 from where there is a slight fall.
Liquidity Ratios
The liquidity ratios of a business reveal the ability of the business to meet the current
obligations of the business effectively. In case of AstraZeneca plc, both the current ratios and
quick ratio of the business shows fall in the estimates in comparison to estimates which was
computed for previous year (Weygandt, Kimmel and Kieso 2015). The below graph shows
current ratio of the business for a period of five years.
8FINANCE FOR DECISION MAKING
2017 2016 2015 2014 2013
0.000
0.200
0.400
0.600
0.800
1.000
1.200
1.400
Current Rati o
Figure 2: (Chart Showing Current ratio)
Source: (Created by the author)
The above chart represents the current ratio for AstraZeneca plc for a period of five years
and the estimates for the current year shows that improvement is need to be made to the current
ratio of the business or the business might face financial crisis in future.
Efficiency Ratio
The efficiency ratios are computed with a view point of determining whether the business
is efficient or not in terms of different activities which are carried out by the business. The
efficiency ratio which is computed for the business covers the inventory turnover ratio and
receivable turnover ratio. The inventory turnover ratio also shows a slight fall in the estimate and
the same is shown to be 1.423 which was 1,768 in 2016. This suggest that the inventory
management policy of the business has been changed and the same is also not that much efficient
in nature. The receivable turnover ratio reveals the efficiency of the debtor management policy
⊘ This is a preview!⊘
Do you want full access?
Subscribe today to unlock all pages.
Trusted by 1+ million students worldwide
9FINANCE FOR DECISION MAKING
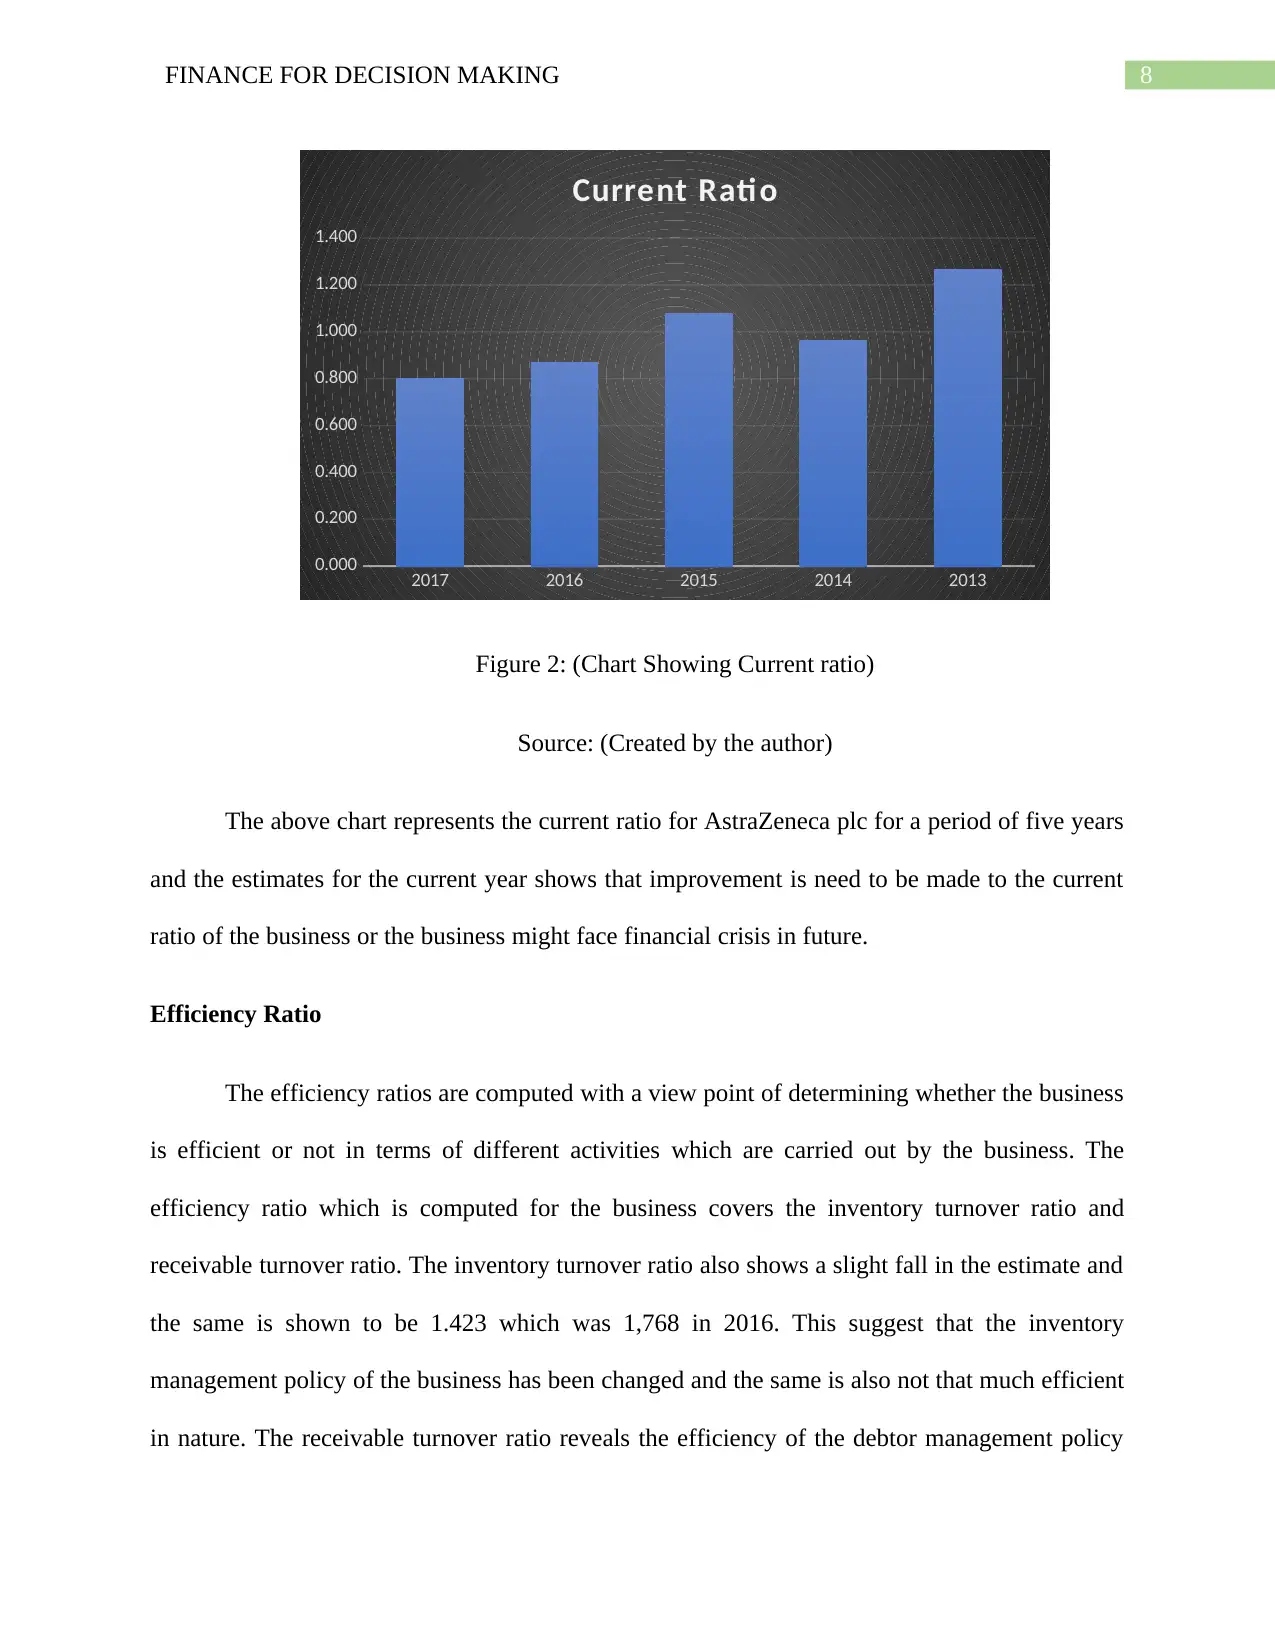
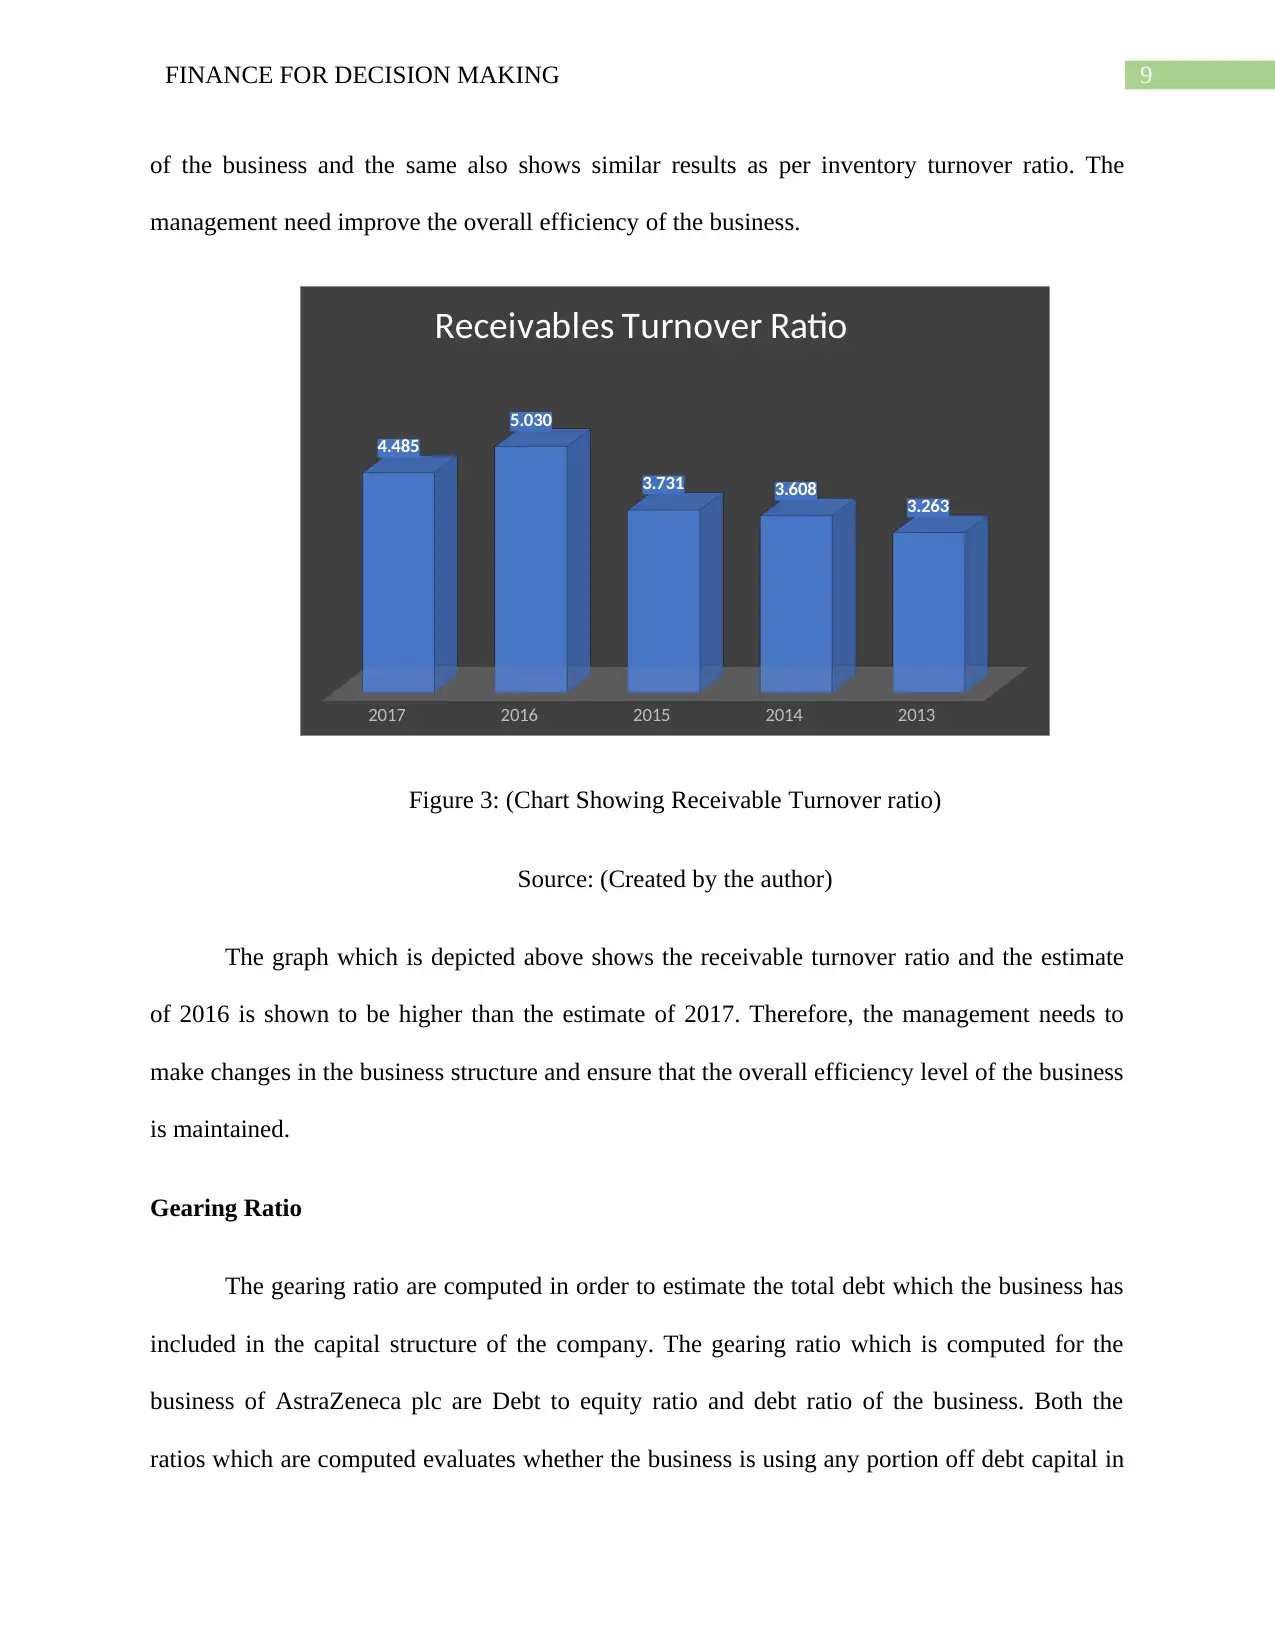
of the business and the same also shows similar results as per inventory turnover ratio. The
management need improve the overall efficiency of the business.
2017 2016 2015 2014 2013
4.485
5.030
3.731 3.608 3.263
Receivables Turnover Ratio
Figure 3: (Chart Showing Receivable Turnover ratio)
Source: (Created by the author)
The graph which is depicted above shows the receivable turnover ratio and the estimate
of 2016 is shown to be higher than the estimate of 2017. Therefore, the management needs to
make changes in the business structure and ensure that the overall efficiency level of the business
is maintained.
Gearing Ratio
The gearing ratio are computed in order to estimate the total debt which the business has
included in the capital structure of the company. The gearing ratio which is computed for the
business of AstraZeneca plc are Debt to equity ratio and debt ratio of the business. Both the
ratios which are computed evaluates whether the business is using any portion off debt capital in
Paraphrase This Document
Need a fresh take? Get an instant paraphrase of this document with our AI Paraphraser
10FINANCE FOR DECISION MAKING
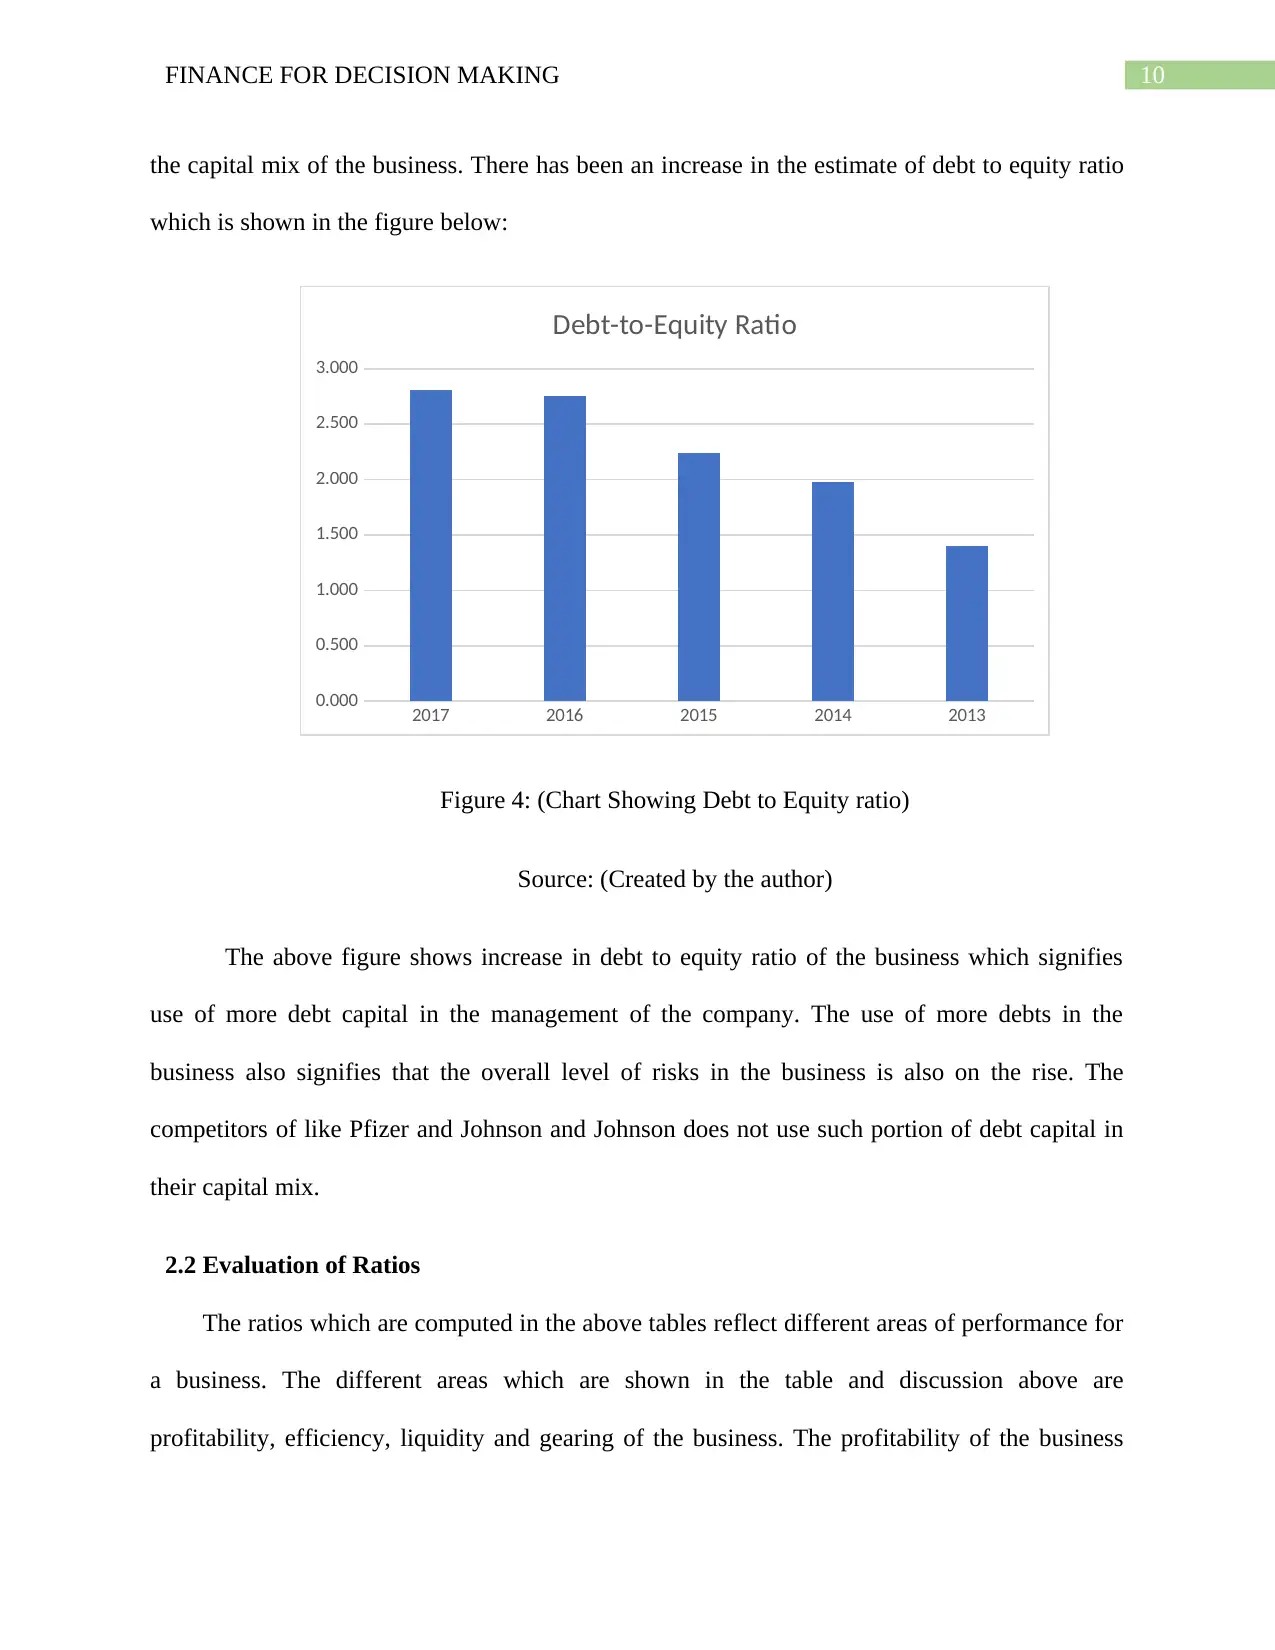
the capital mix of the business. There has been an increase in the estimate of debt to equity ratio
which is shown in the figure below:
2017 2016 2015 2014 2013
0.000
0.500
1.000
1.500
2.000
2.500
3.000
Debt-to-Equity Ratio
Figure 4: (Chart Showing Debt to Equity ratio)
Source: (Created by the author)
The above figure shows increase in debt to equity ratio of the business which signifies
use of more debt capital in the management of the company. The use of more debts in the
business also signifies that the overall level of risks in the business is also on the rise. The
competitors of like Pfizer and Johnson and Johnson does not use such portion of debt capital in
their capital mix.
2.2 Evaluation of Ratios
The ratios which are computed in the above tables reflect different areas of performance for
a business. The different areas which are shown in the table and discussion above are
profitability, efficiency, liquidity and gearing of the business. The profitability of the business
11FINANCE FOR DECISION MAKING
has fallen which is mainly due to the fall in the sales and also rise in the costs of the business and
due to which the net profit of the business has reduced. The liquidity ratio which is presented by
current ratio also shows slight fall which needs to be considered by the management of the
business. The efficiency ratio is depicted receivable turnover ratio and the same reveals that the
business needs to maintain the efficiency and also make amendments to the policy of the debtors
of the business (Weil, Schipper and Francis 2013). The gearing ratio is shown by debt to equity
ratio of the business and the same shows that there has been an increase in the debts of the
business and therefore there has been change in the capital structure of the business.
2.3 Limitation of Financial Ratios
There are a variety of tools which are available to a business for measuring the financial
performance of a business and ratio analysis is one to the tool which is available to a business.
The estimates which are computed in ratio analysis are based on the values which are provided
in the financial statements but it is to be remembered that ratio analysis does not considers the
effect of inflation on such estimates and thus are not efficient tools for measuring the
performance of the business. In addition to this, there are also certain seasonal factors which
can distort ratio analysis and therefore the same needs to be considered before relying on ratios
solely. Moreover, ratio analysis does not work effectively for small businesses in comparison to
larger businesses.
3. Future Investment Appraisal
The investment appraisal techniques are used by businesses for the purpose of estimating a
viability of an investment which the business is planning to undertake. In general conditions,
⊘ This is a preview!⊘
Do you want full access?
Subscribe today to unlock all pages.
Trusted by 1+ million students worldwide
1 out of 19
Related Documents


Your All-in-One AI-Powered Toolkit for Academic Success.
+13062052269
info@desklib.com
Available 24*7 on WhatsApp / Email
![[object Object]](/_next/static/media/star-bottom.7253800d.svg)
Unlock your academic potential
Copyright © 2020–2026 A2Z Services. All Rights Reserved. Developed and managed by ZUCOL.