FINA6000 - Managing Finance: ASX Company Financial Analysis Report

Verified

Added on  2022/09/18

|39
|5023
|24
Report
AI Summary
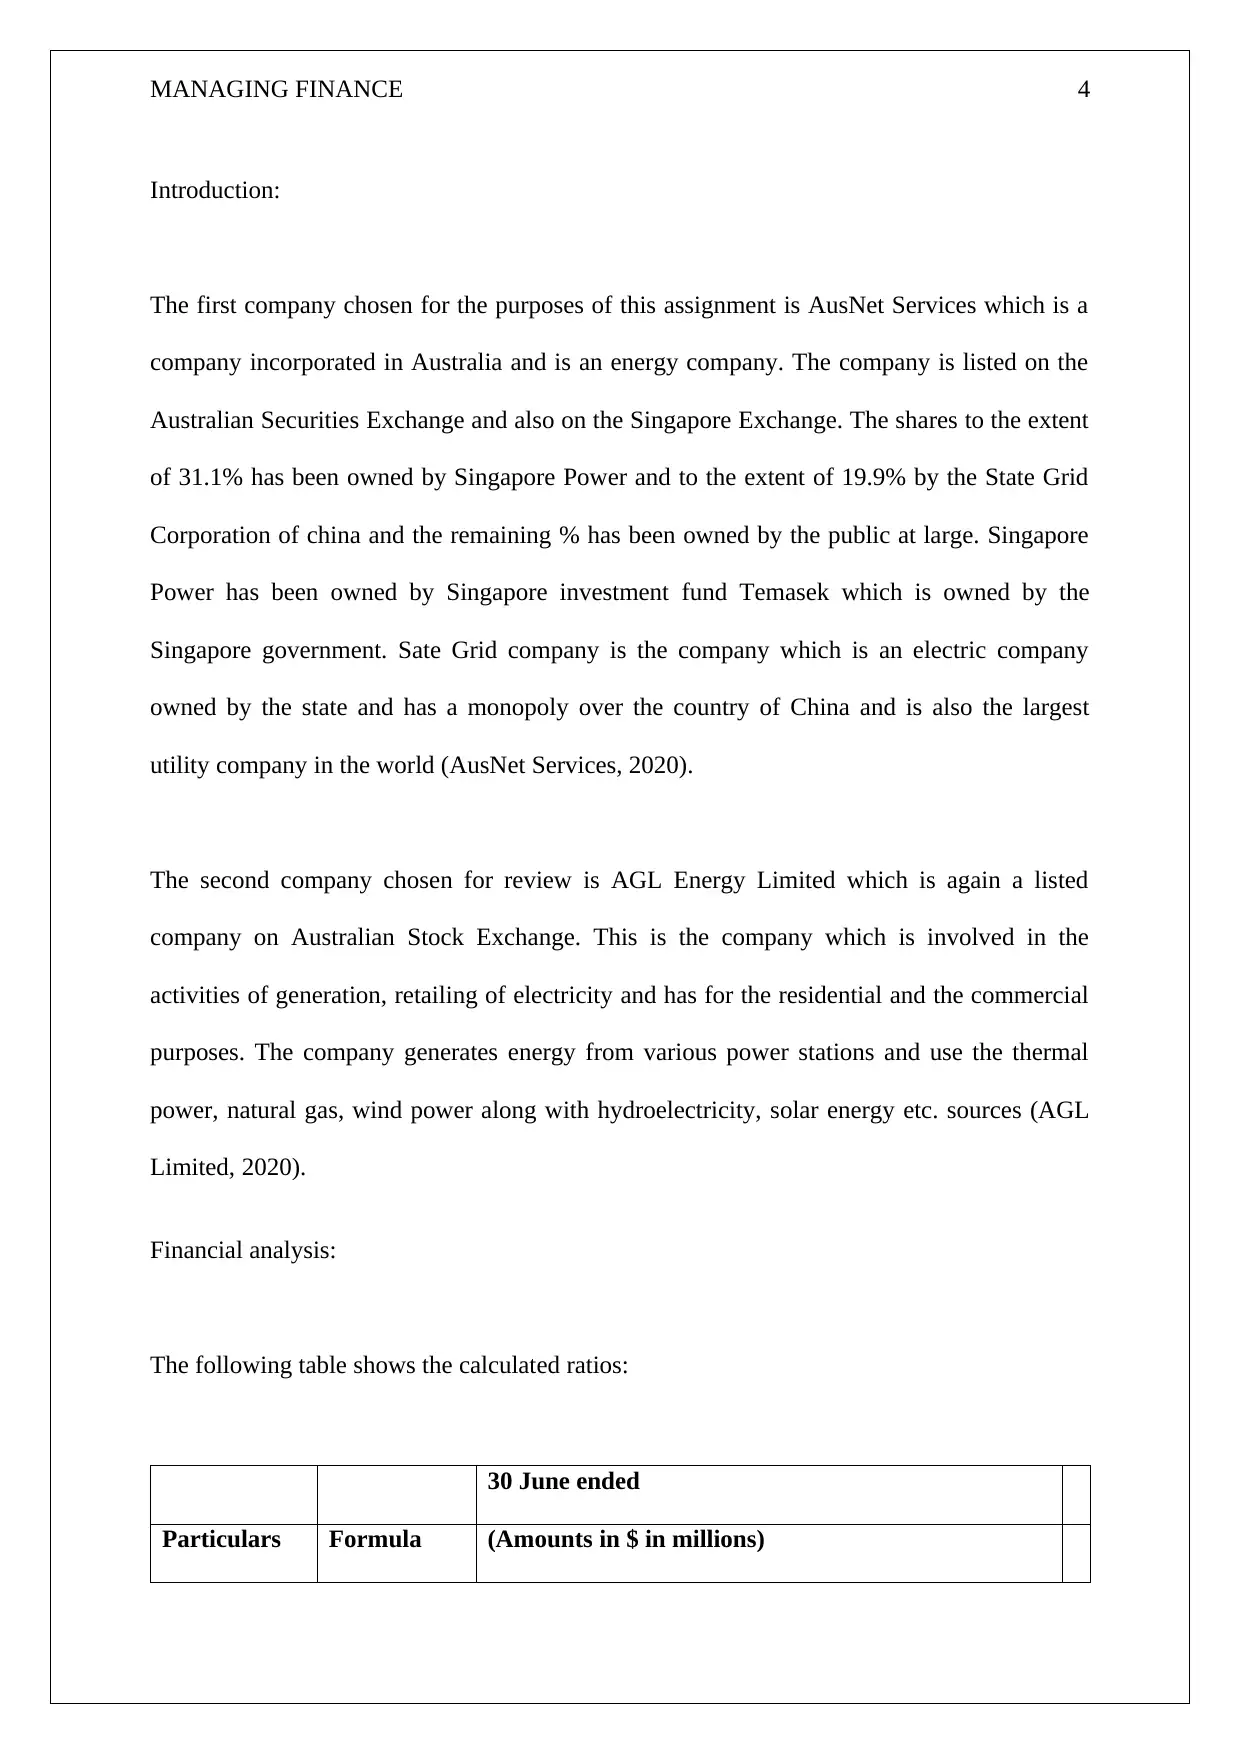
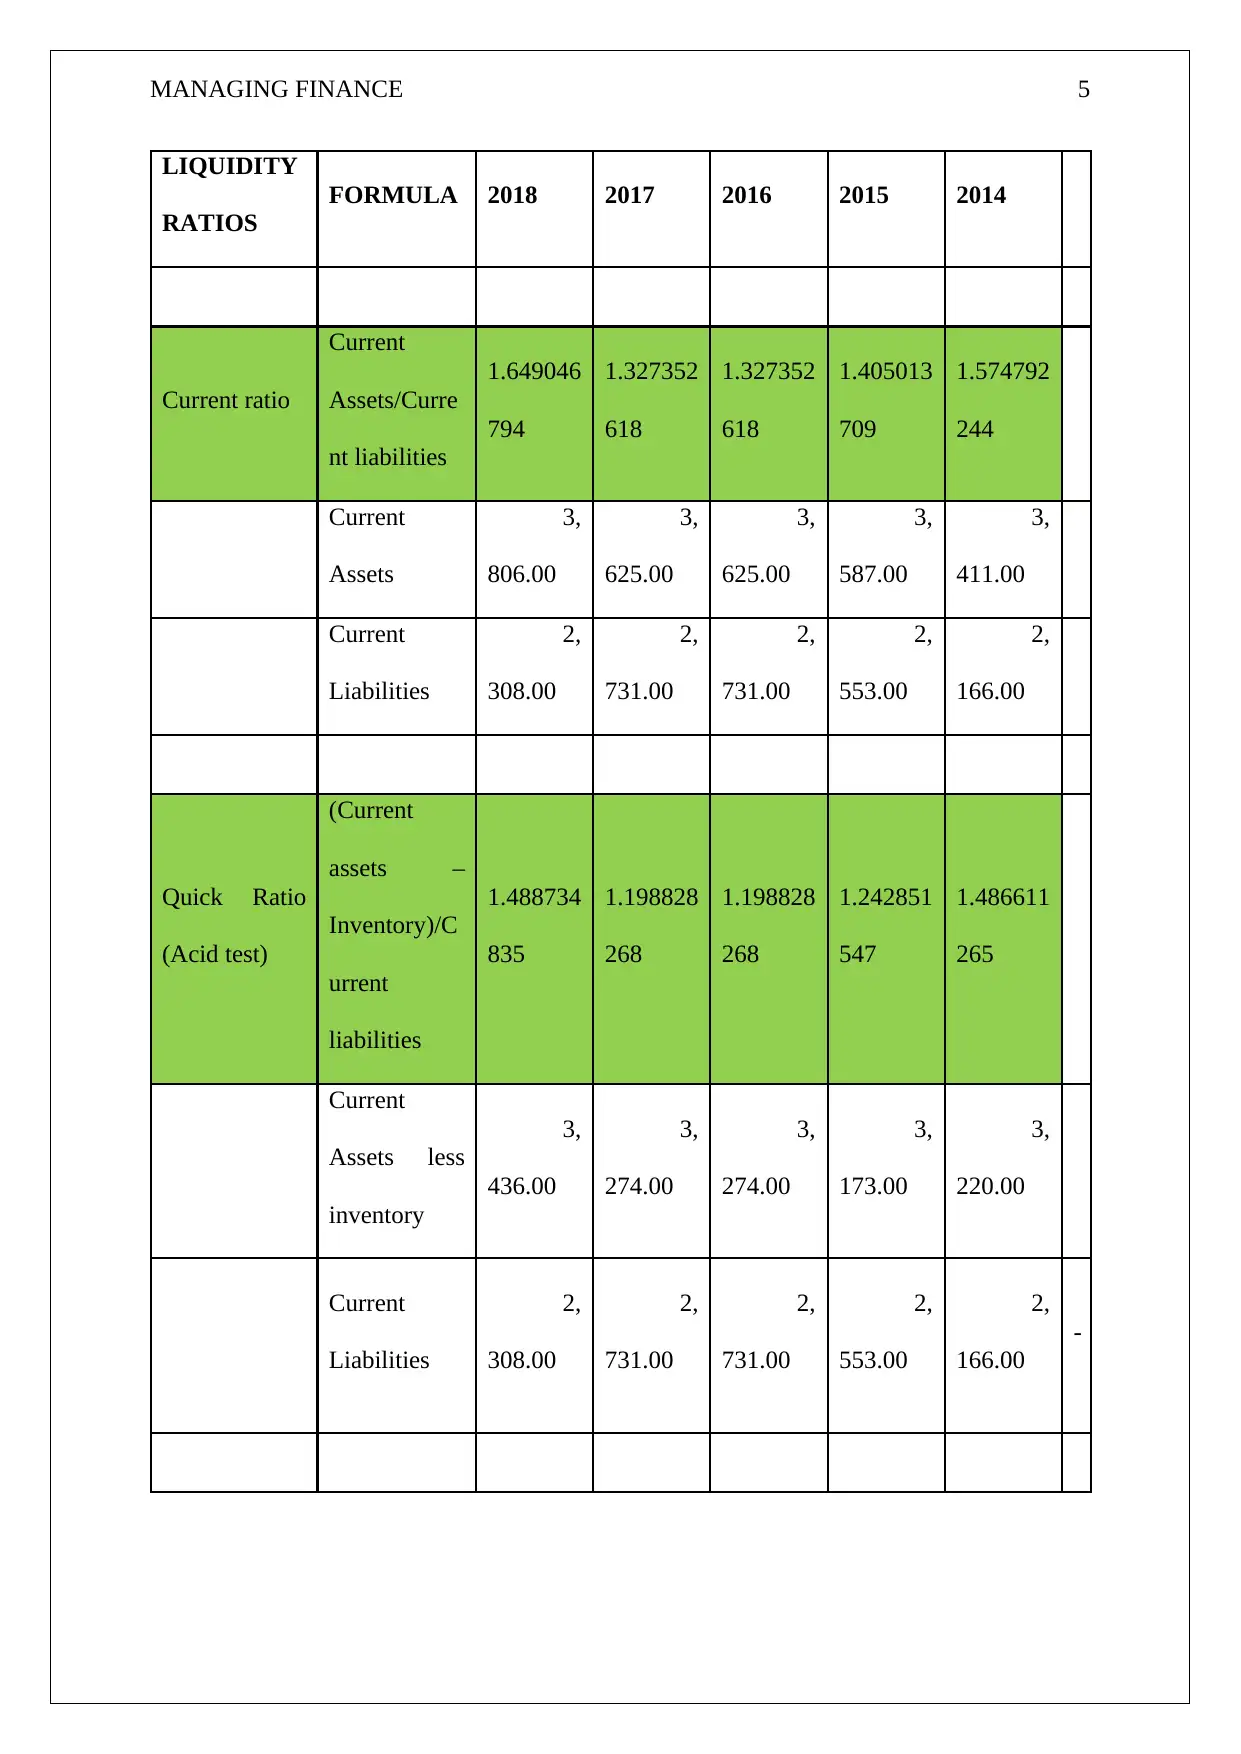
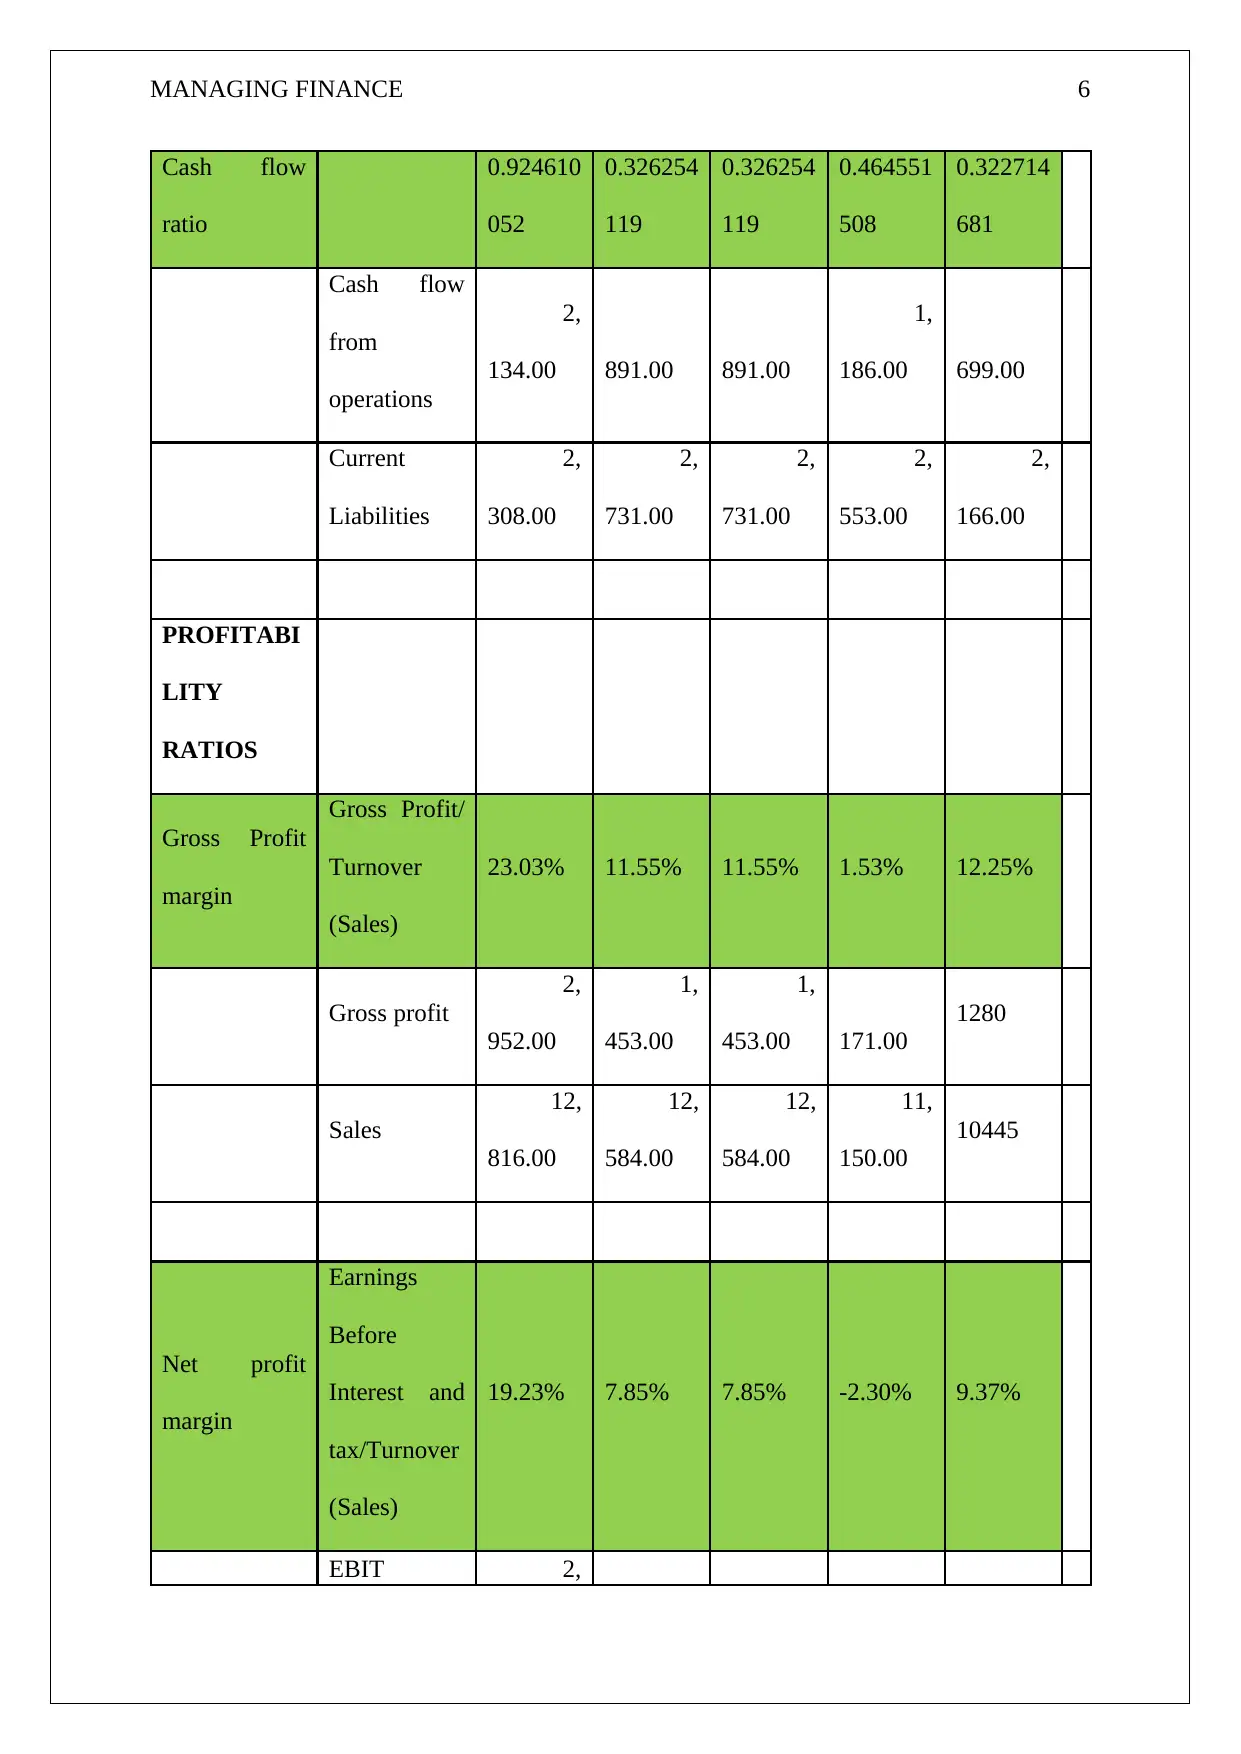
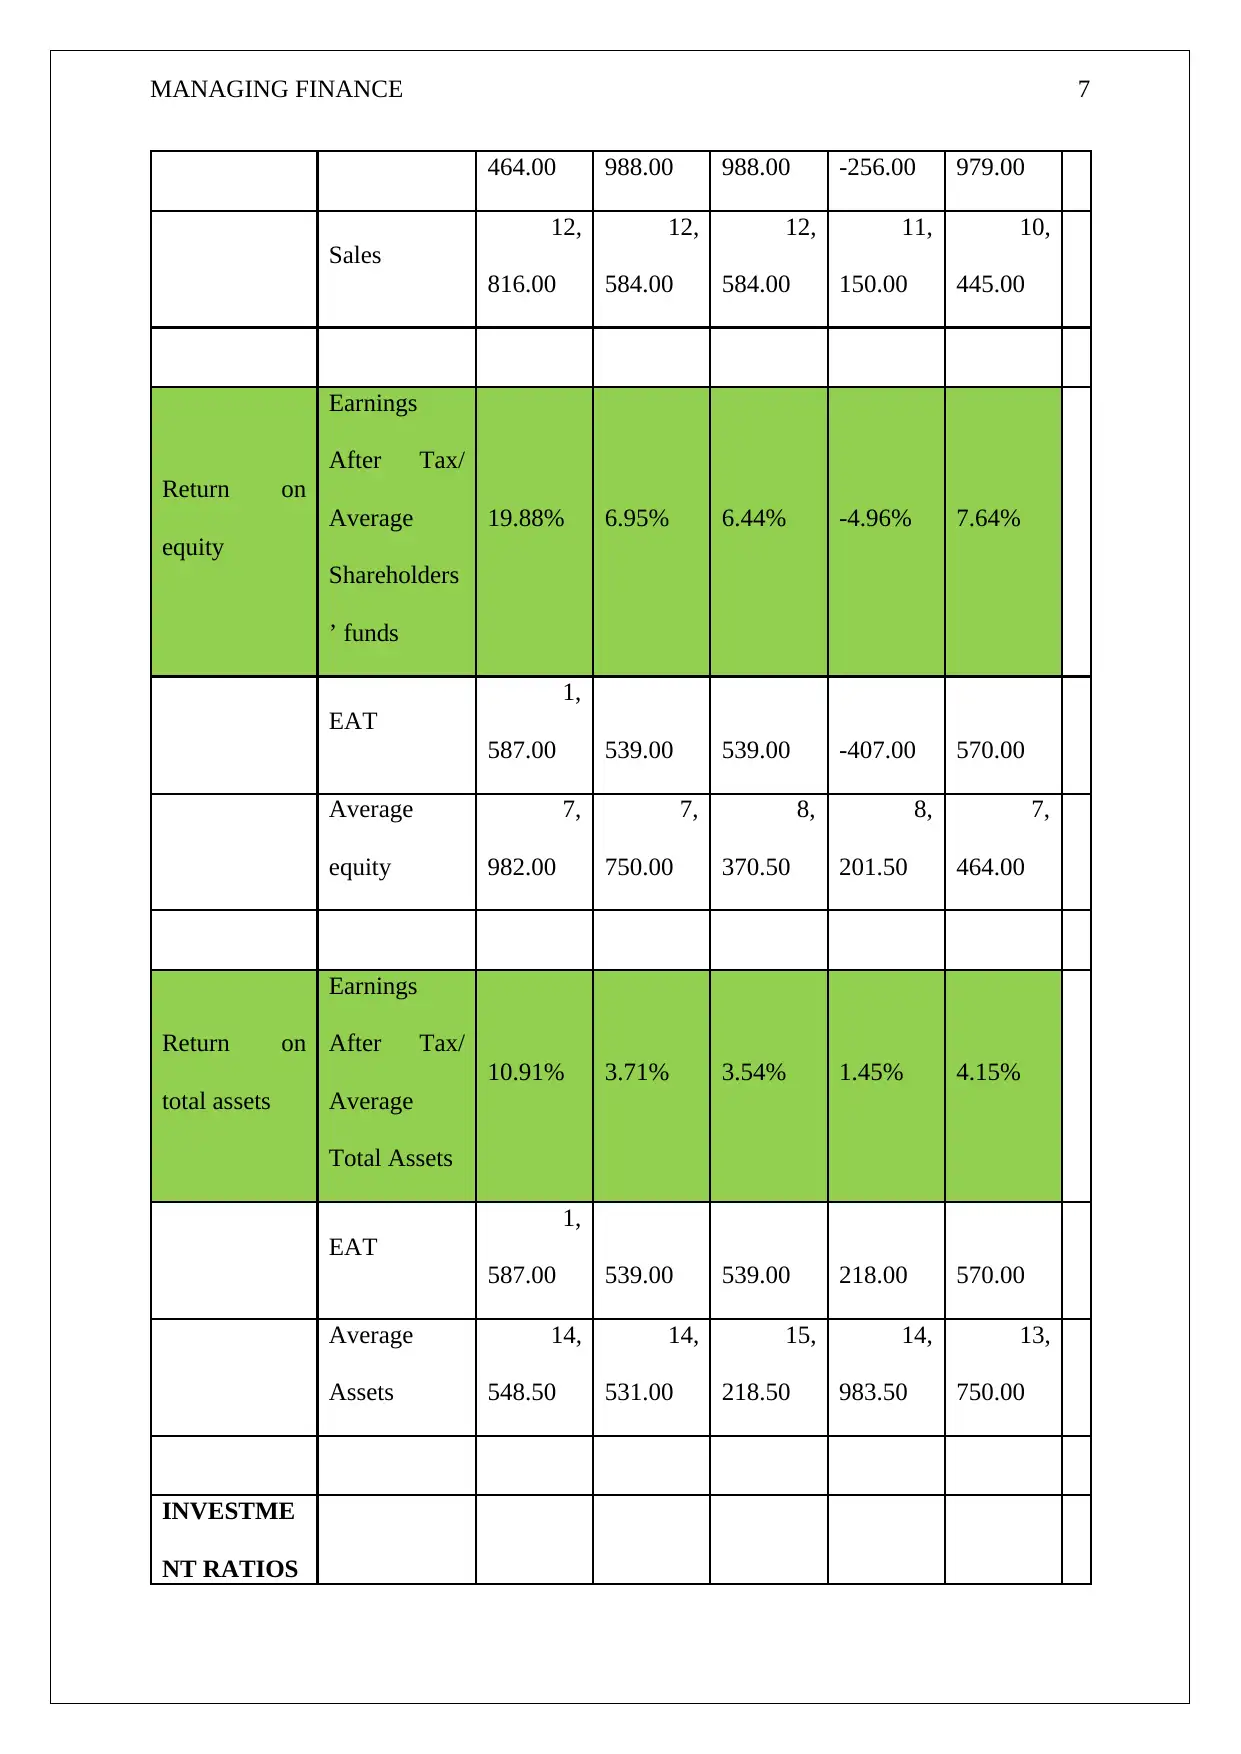
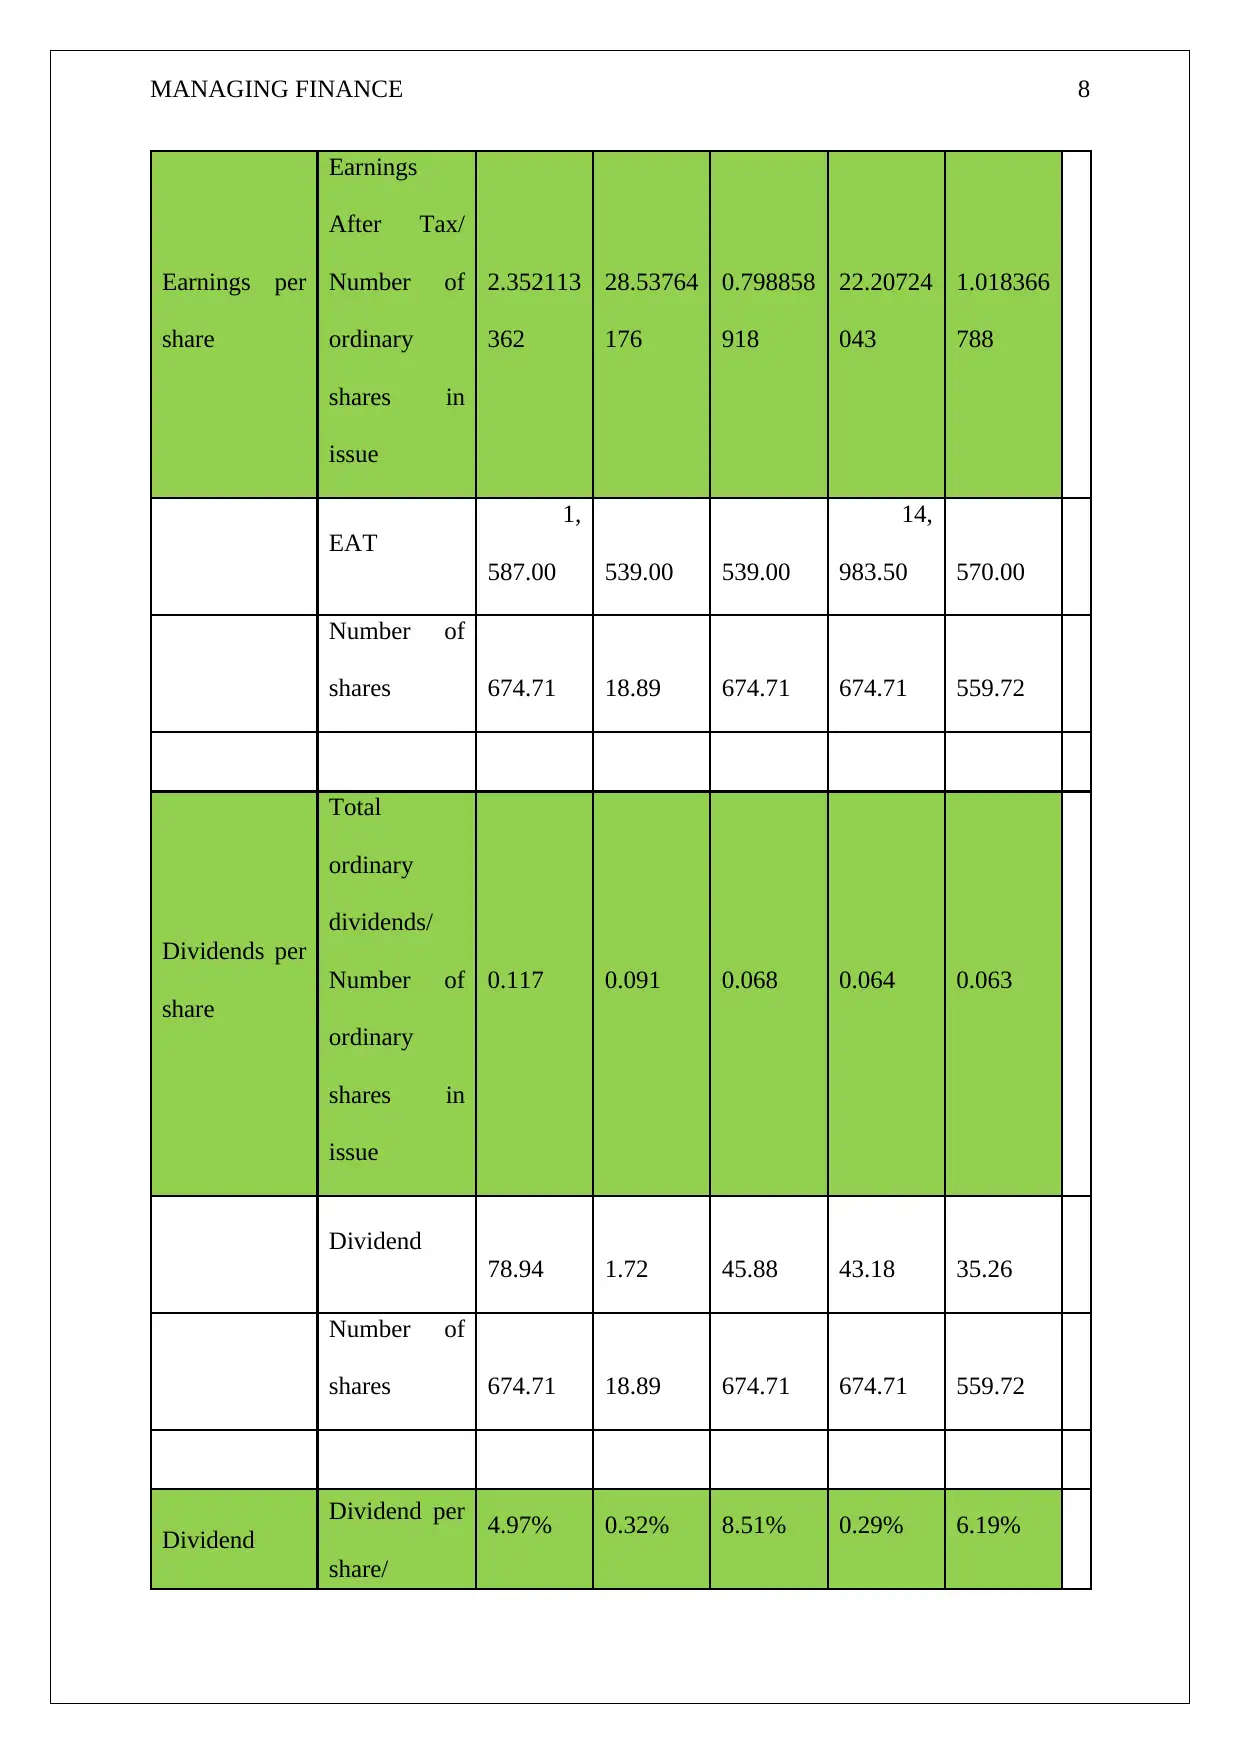
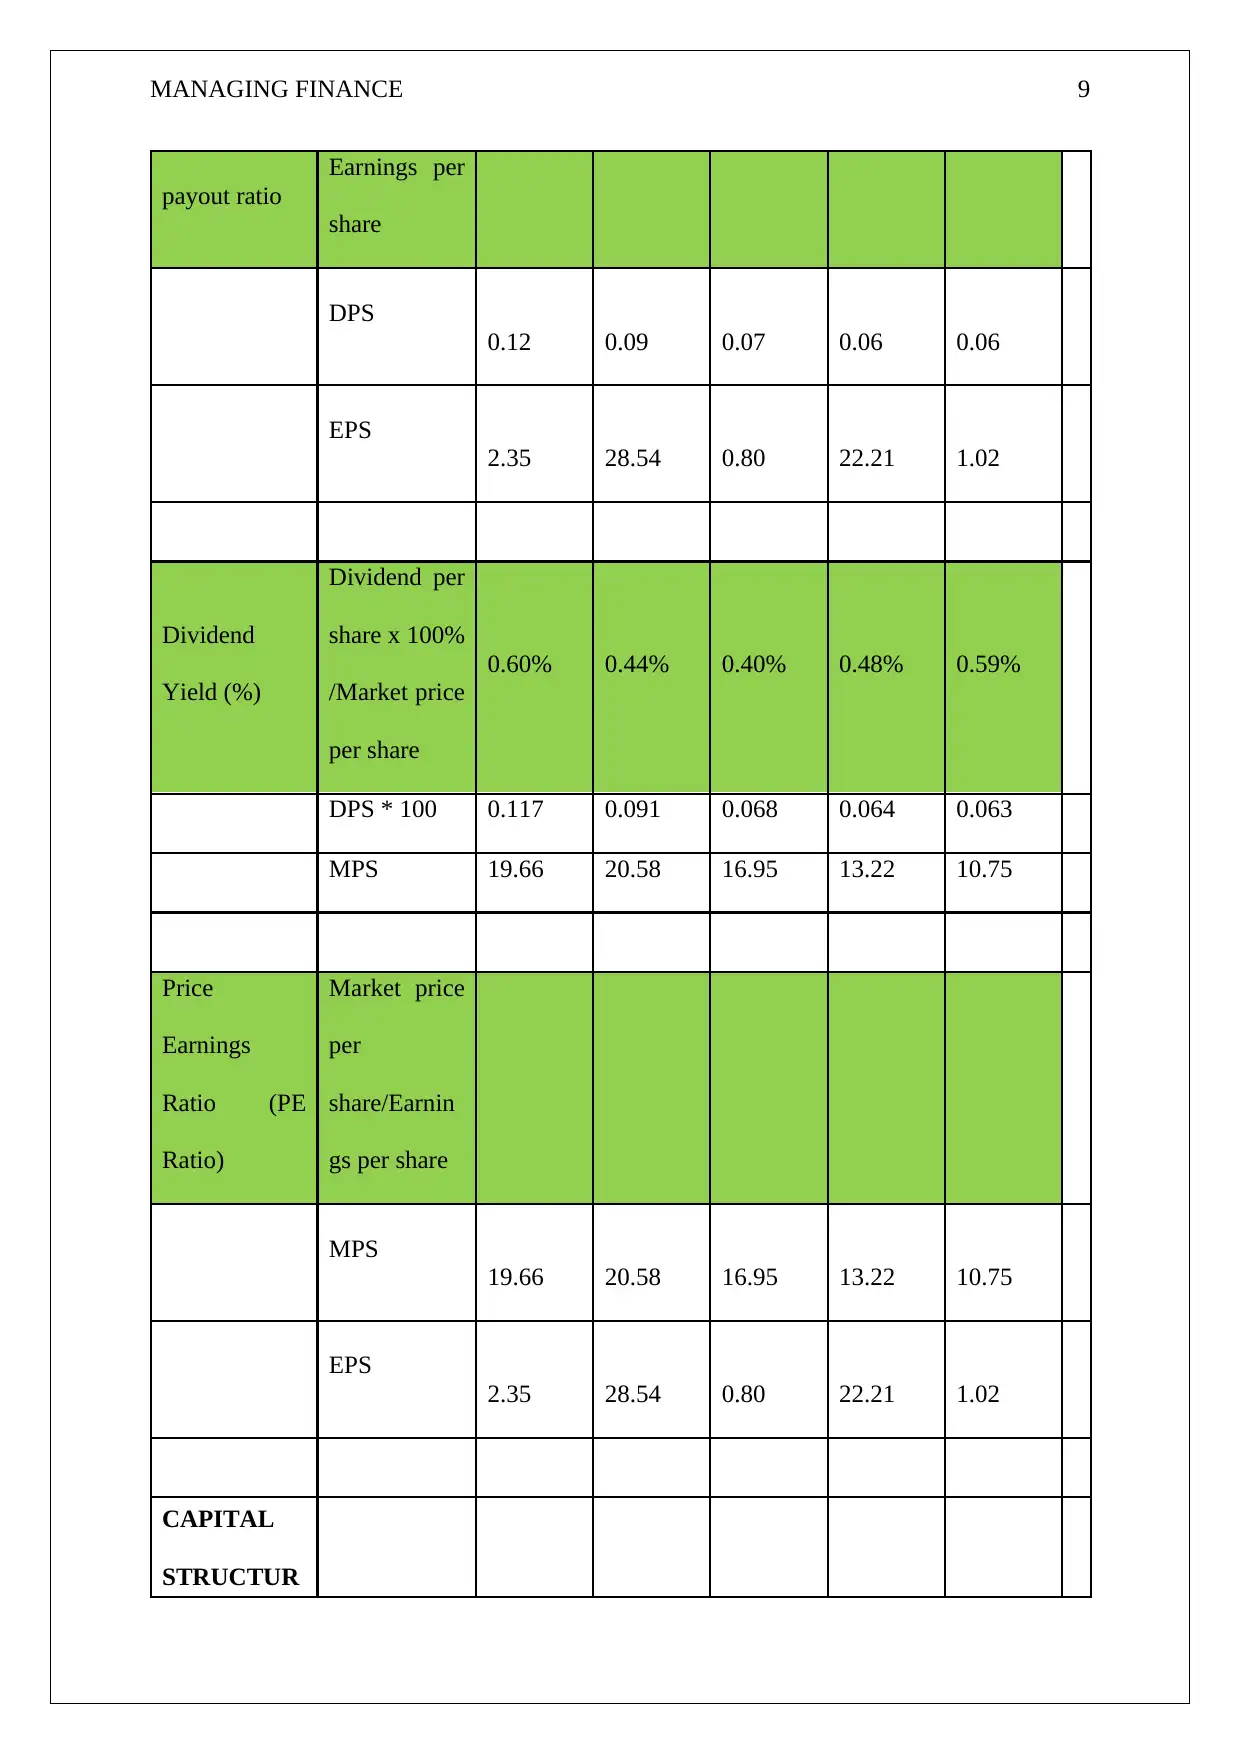
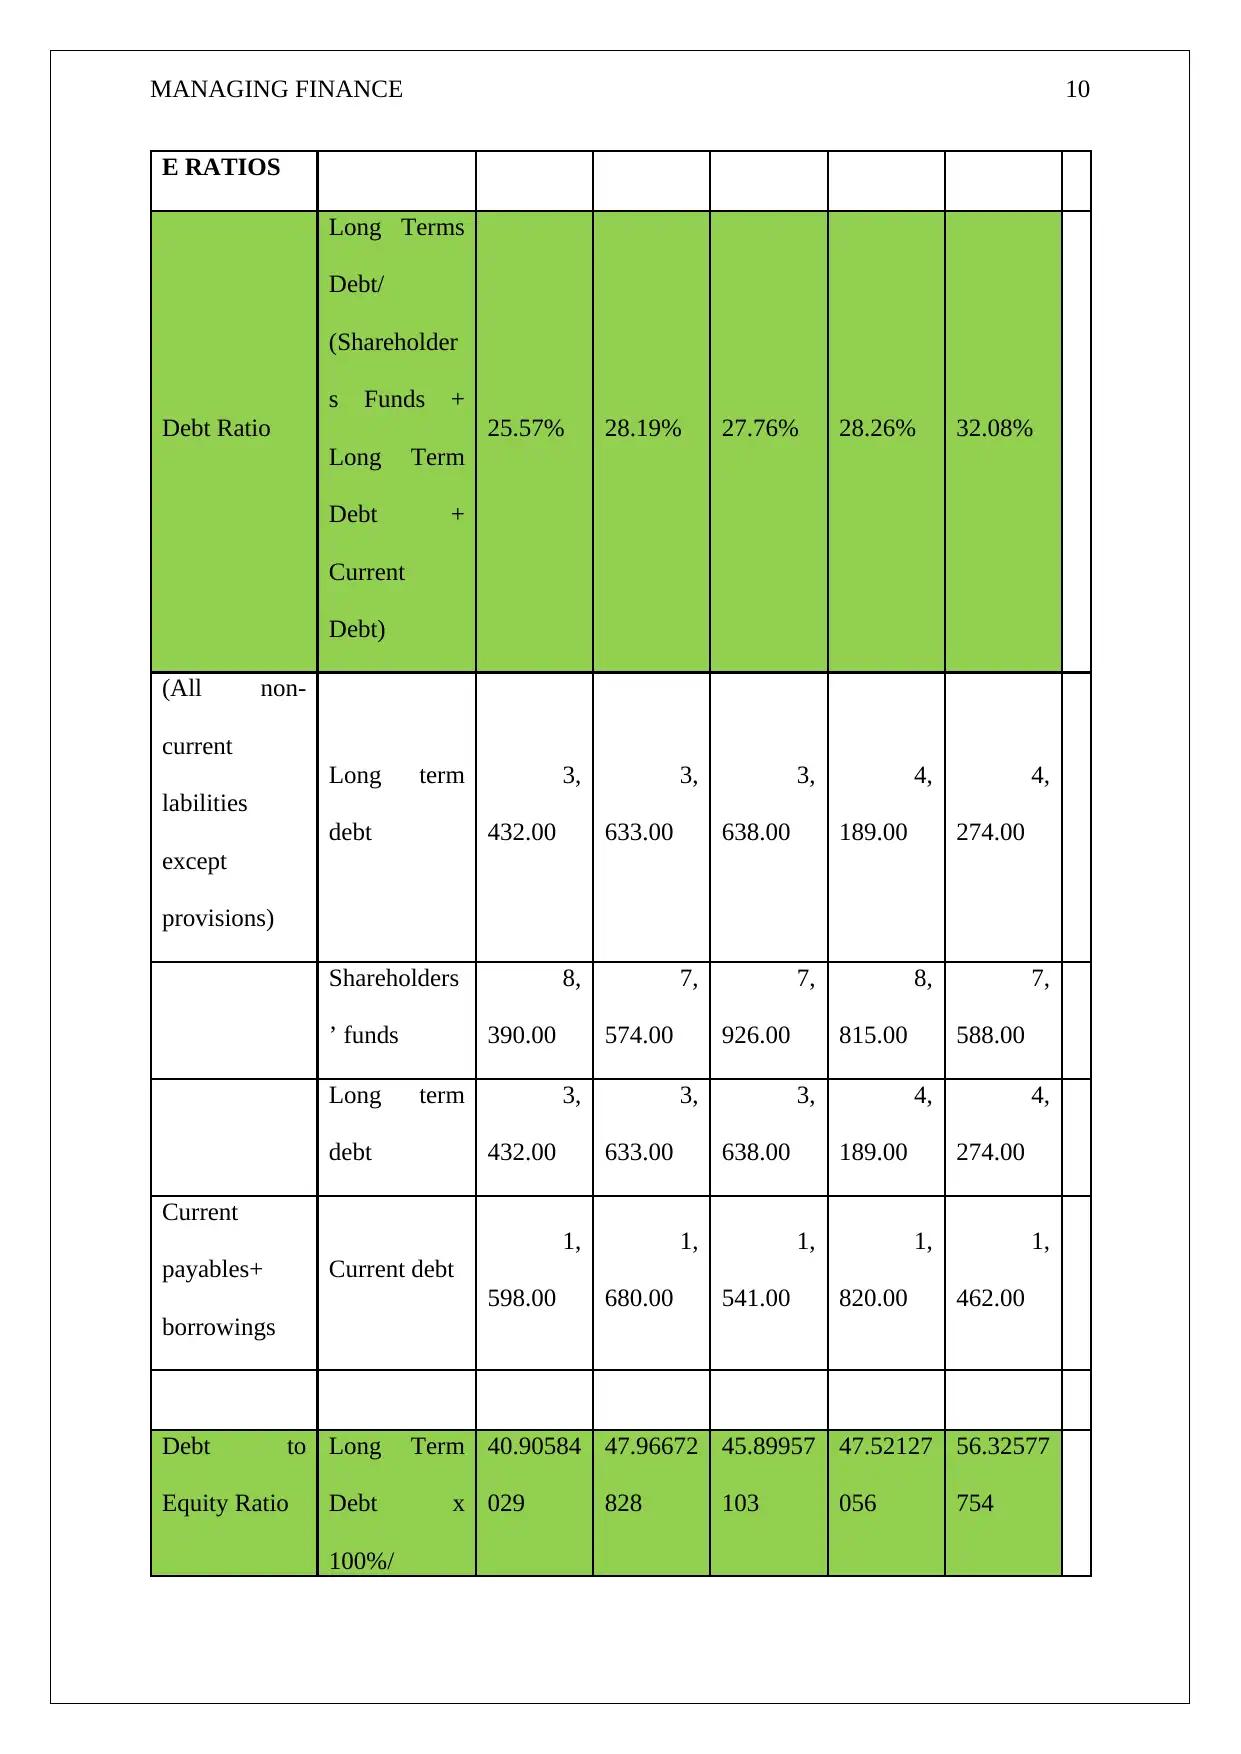
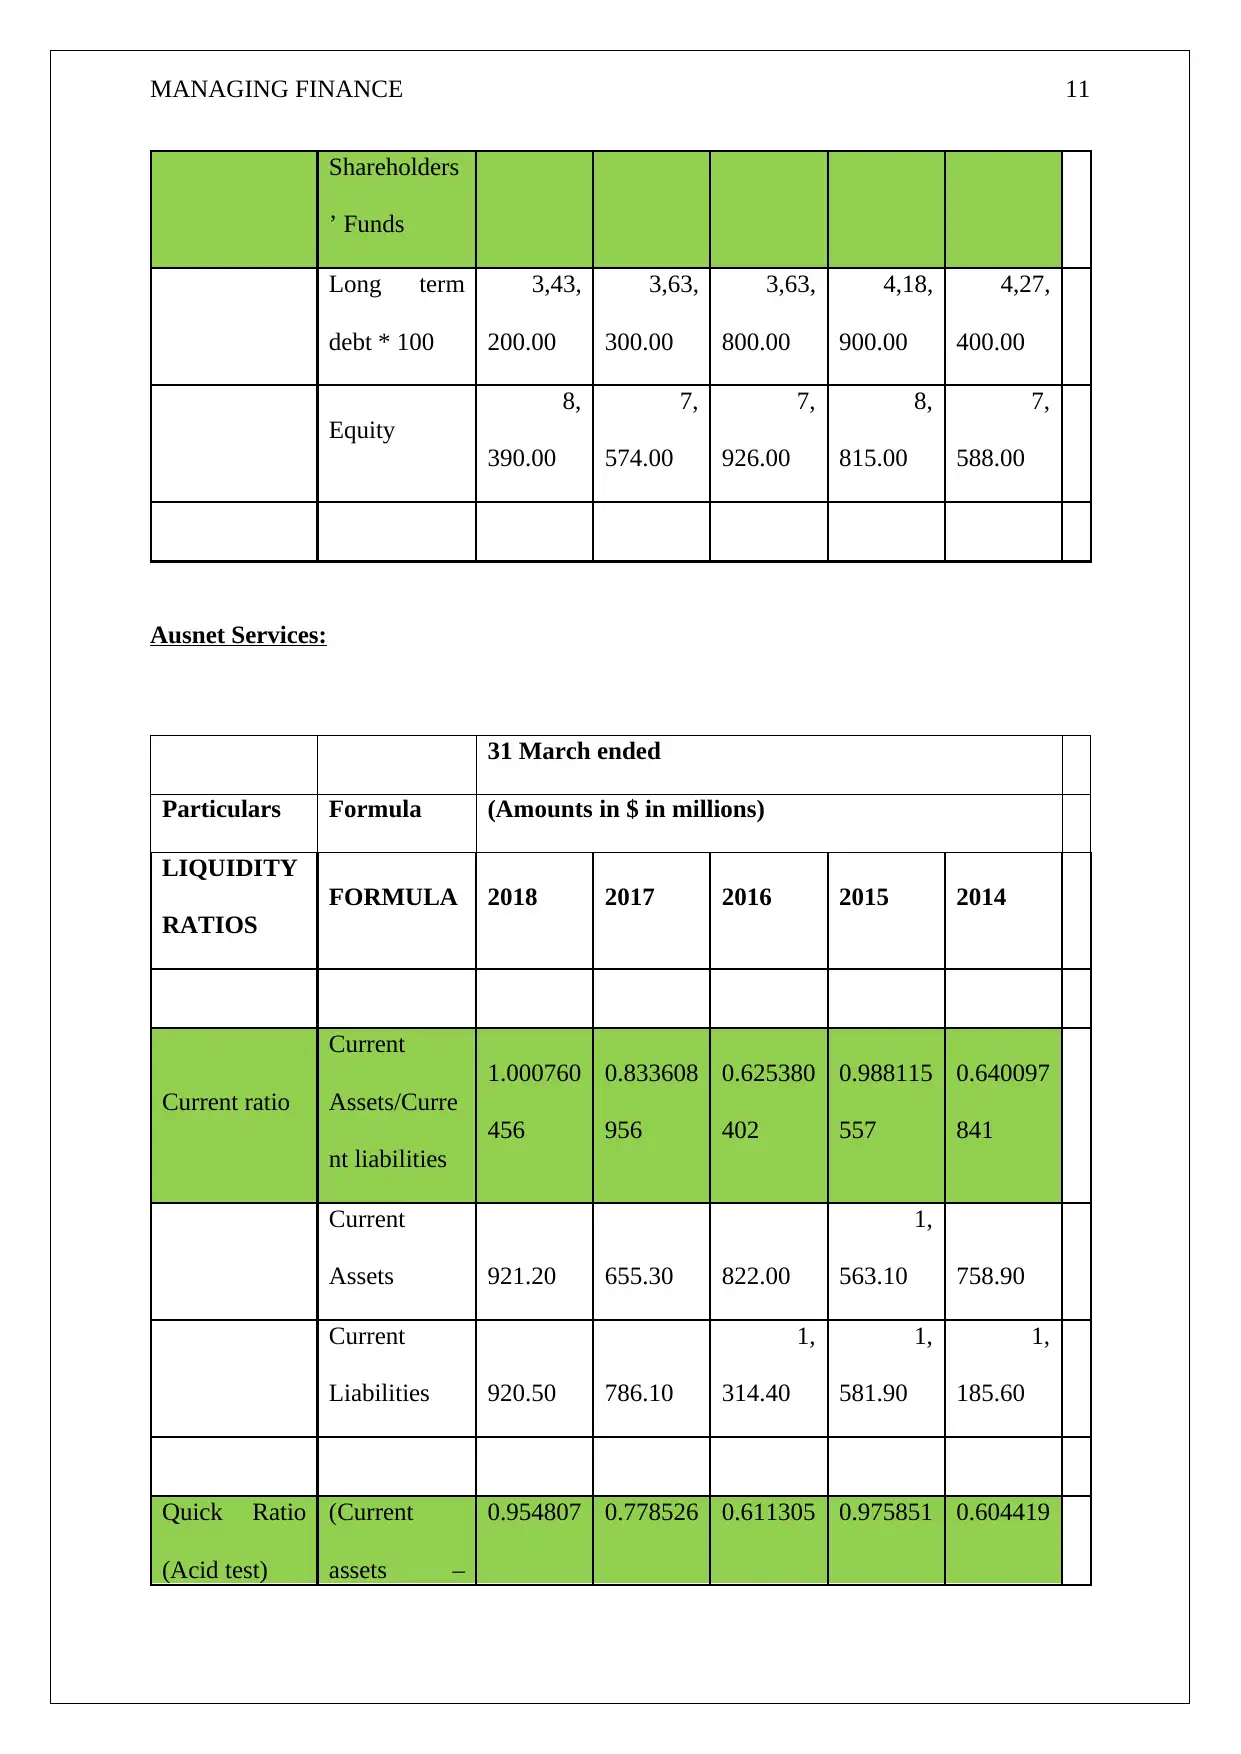
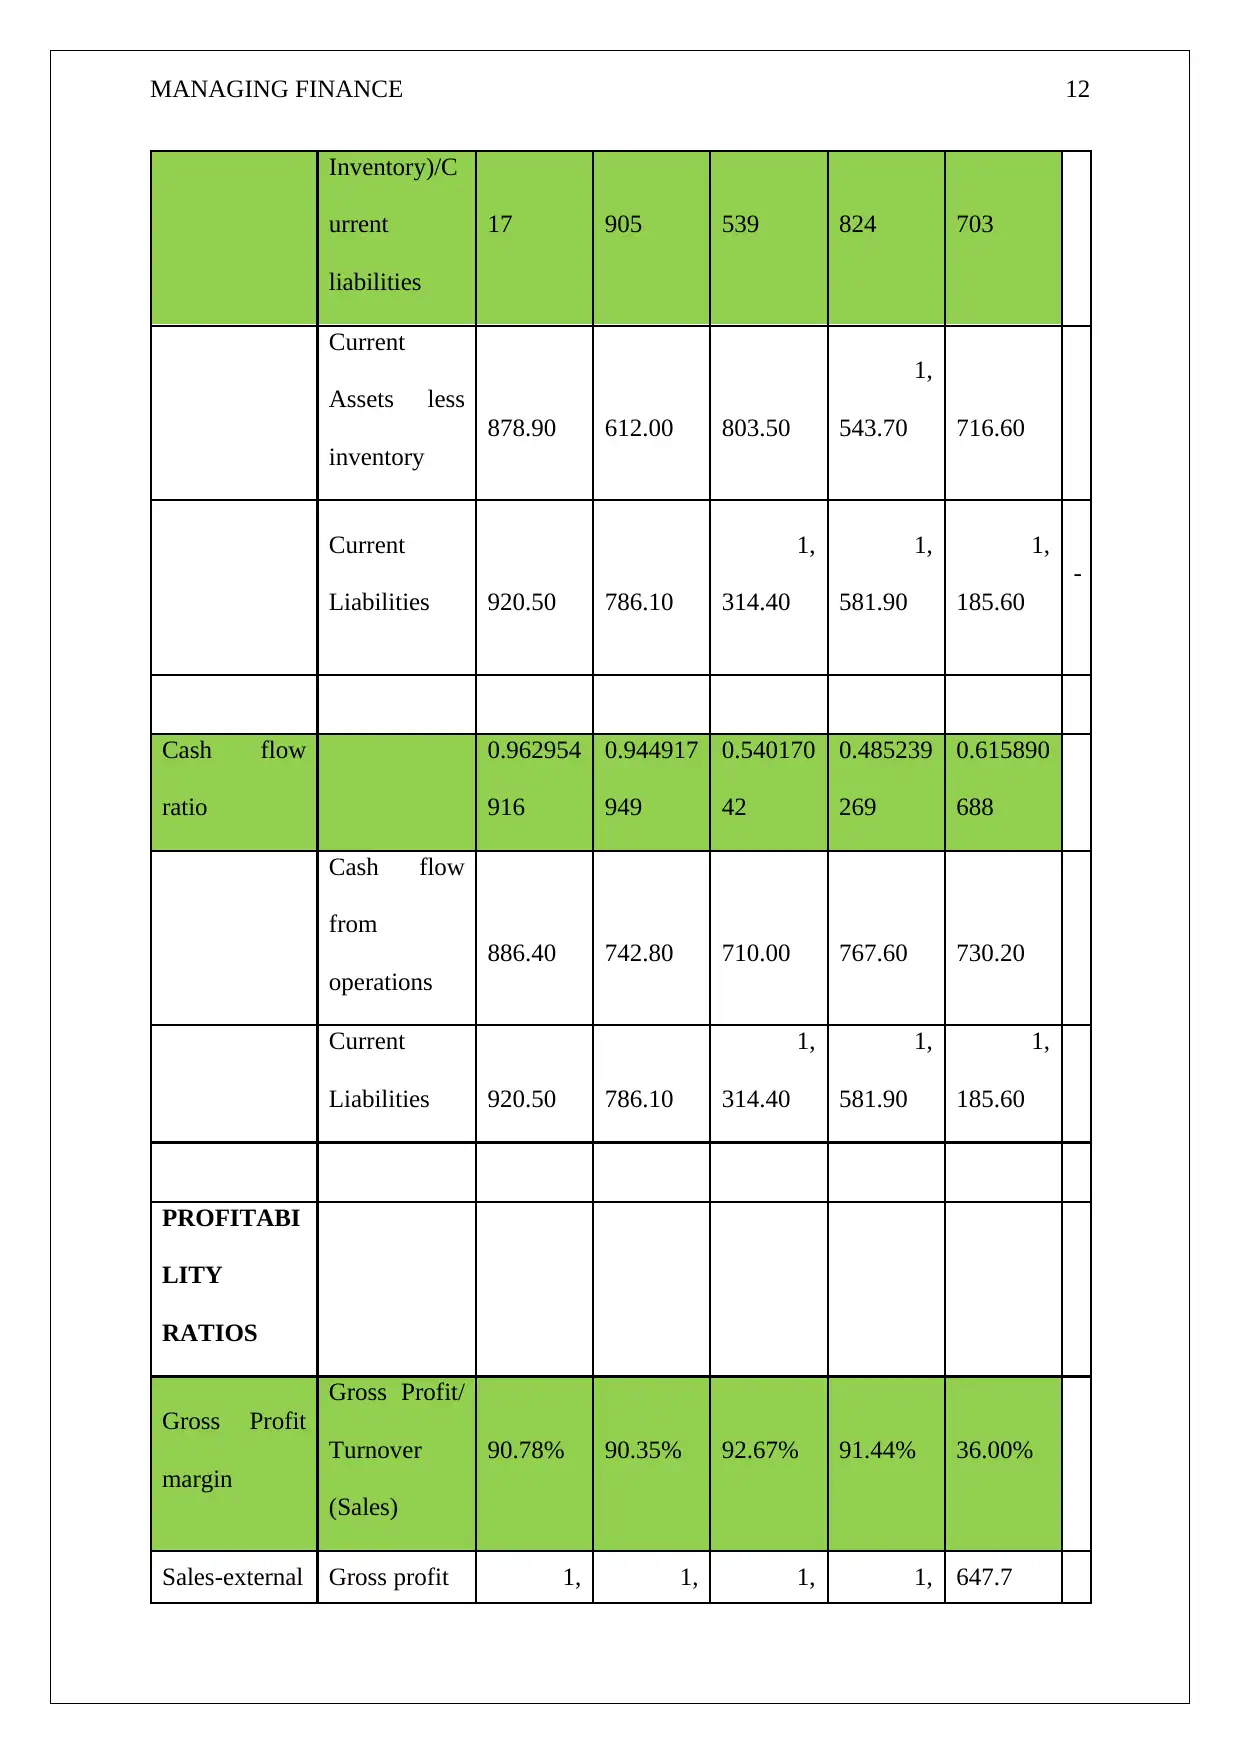
This report provides a comprehensive financial analysis of two ASX-listed companies, AusNet Services Limited and AGL Limited, both operating in the utilities industry. The analysis includes a detailed examination of their financial performance, focusing on profitability, liquidity, and investment ratios. The report also delves into the capital structures of both companies, calculating the weighted average cost of capital and exploring relative valuation based on market-to-book value ratios. Through this in-depth assessment, the report aims to provide insights into the financial health and investment potential of each company, ultimately concluding with a recommendation on which company presents a more favorable investment opportunity. The analysis covers a five-year period and utilizes various financial metrics to assess the companies' efficiency and effectiveness. The report includes an executive summary, introduction, financial analysis, profitability ratios, liquidity ratios, investment ratios, capital structures, historical weighted average cost of capital, discounted cash flow approach, relative valuation, conclusion, references, and an appendix.
Document Page
MANAGING FINANCE 1
MANAGING
FINANCE
tabler-icon-diamond-filled.svg

Paraphrase This Document

Need a fresh take? Get an instant paraphrase of this document with our AI Paraphraser
Document Page
MANAGING FINANCE 2
Executive summary:
This report aims selecting two comapneis that are listed on ASX. The companies chosen are
AusNet Services Limited and AGL Limited. Both of these companies belong to the industry
of “Utilities”. The report contains the financial analysis of these companies. Also, it talks
about the weighted average cost of capital, capital structure, and financial ratios. In the end it
talks about the relative book value per share of these companies. Form the report, it can be
stated that an investment should be done in AGL Limited since it seems to be improving in
terms of its efficiency and effectiveness.
Document Page
MANAGING FINANCE 3
Contents
Introduction:...............................................................................................................................4
Financial analysis:......................................................................................................................4
Profitability ratios:...............................................................................................................11
Liquidity ratios:....................................................................................................................12
Investment ratios:.................................................................................................................13
Capital structures of the companies:........................................................................................14
Historical weighted average cost of capital:............................................................................17
Discounted cash flow approach:..............................................................................................19
Relative valuation which is based on a market to book value ratio:........................................21
Conclusion:..............................................................................................................................22
References:...............................................................................................................................23
References...........................................................................................................................23
Appendix:................................................................................................................................24
Document Page
MANAGING FINANCE 4
Introduction:
The first company chosen for the purposes of this assignment is AusNet Services which is a
company incorporated in Australia and is an energy company. The company is listed on the
Australian Securities Exchange and also on the Singapore Exchange. The shares to the extent
of 31.1% has been owned by Singapore Power and to the extent of 19.9% by the State Grid
Corporation of china and the remaining % has been owned by the public at large. Singapore
Power has been owned by Singapore investment fund Temasek which is owned by the
Singapore government. Sate Grid company is the company which is an electric company
owned by the state and has a monopoly over the country of China and is also the largest
utility company in the world (AusNet Services, 2020).
The second company chosen for review is AGL Energy Limited which is again a listed
company on Australian Stock Exchange. This is the company which is involved in the
activities of generation, retailing of electricity and has for the residential and the commercial
purposes. The company generates energy from various power stations and use the thermal
power, natural gas, wind power along with hydroelectricity, solar energy etc. sources (AGL
Limited, 2020).
Financial analysis:
The following table shows the calculated ratios:
30 June ended
Particulars Formula (Amounts in $ in millions)
tabler-icon-diamond-filled.svg

Paraphrase This Document

Need a fresh take? Get an instant paraphrase of this document with our AI Paraphraser
Document Page
MANAGING FINANCE 5
LIQUIDITY
RATIOS
FORMULA 2018 2017 2016 2015 2014
Current ratio
Current
Assets/Curre
nt liabilities
1.649046
794
1.327352
618
1.327352
618
1.405013
709
1.574792
244
Current
Assets
3,
806.00
3,
625.00
3,
625.00
3,
587.00
3,
411.00
Current
Liabilities
2,
308.00
2,
731.00
2,
731.00
2,
553.00
2,
166.00
Quick Ratio
(Acid test)
(Current
assets
Inventory)/C
urrent
liabilities
1.488734
835
1.198828
268
1.198828
268
1.242851
547
1.486611
265
Current
Assets less
inventory
3,
436.00
3,
274.00
3,
274.00
3,
173.00
3,
220.00
Current
Liabilities
2,
308.00
2,
731.00
2,
731.00
2,
553.00
2,
166.00
-
Document Page
MANAGING FINANCE 6
Cash flow
ratio
0.924610
052
0.326254
119
0.326254
119
0.464551
508
0.322714
681
Cash flow
from
operations
2,
134.00 891.00 891.00
1,
186.00 699.00
Current
Liabilities
2,
308.00
2,
731.00
2,
731.00
2,
553.00
2,
166.00
PROFITABI
LITY
RATIOS
Gross Profit
margin
Gross Profit/
Turnover
(Sales)
23.03% 11.55% 11.55% 1.53% 12.25%
Gross profit
2,
952.00
1,
453.00
1,
453.00 171.00
1280
Sales
12,
816.00
12,
584.00
12,
584.00
11,
150.00
10445
Net profit
margin
Earnings
Before
Interest and
tax/Turnover
(Sales)
19.23% 7.85% 7.85% -2.30% 9.37%
EBIT 2,
Document Page
MANAGING FINANCE 7
464.00 988.00 988.00 -256.00 979.00
Sales
12,
816.00
12,
584.00
12,
584.00
11,
150.00
10,
445.00
Return on
equity
Earnings
After Tax/
Average
Shareholders
’ funds
19.88% 6.95% 6.44% -4.96% 7.64%
EAT
1,
587.00 539.00 539.00 -407.00 570.00
Average
equity
7,
982.00
7,
750.00
8,
370.50
8,
201.50
7,
464.00
Return on
total assets
Earnings
After Tax/
Average
Total Assets
10.91% 3.71% 3.54% 1.45% 4.15%
EAT
1,
587.00 539.00 539.00 218.00 570.00
Average
Assets
14,
548.50
14,
531.00
15,
218.50
14,
983.50
13,
750.00
INVESTME
NT RATIOS
tabler-icon-diamond-filled.svg

Paraphrase This Document

Need a fresh take? Get an instant paraphrase of this document with our AI Paraphraser
Document Page
MANAGING FINANCE 8
Earnings per
share
Earnings
After Tax/
Number of
ordinary
shares in
issue
2.352113
362
28.53764
176
0.798858
918
22.20724
043
1.018366
788
EAT
1,
587.00 539.00 539.00
14,
983.50 570.00
Number of
shares 674.71 18.89 674.71 674.71 559.72
Dividends per
share
Total
ordinary
dividends/
Number of
ordinary
shares in
issue
0.117 0.091 0.068 0.064 0.063
Dividend
78.94 1.72 45.88 43.18 35.26
Number of
shares 674.71 18.89 674.71 674.71 559.72
Dividend
Dividend per
share/
4.97% 0.32% 8.51% 0.29% 6.19%
Document Page
MANAGING FINANCE 9
payout ratio
Earnings per
share
DPS
0.12 0.09 0.07 0.06 0.06
EPS
2.35 28.54 0.80 22.21 1.02
Dividend
Yield (%)
Dividend per
share x 100%
/Market price
per share
0.60% 0.44% 0.40% 0.48% 0.59%
DPS * 100 0.117 0.091 0.068 0.064 0.063
MPS 19.66 20.58 16.95 13.22 10.75
Price
Earnings
Ratio (PE
Ratio)
Market price
per
share/Earnin
gs per share
MPS
19.66 20.58 16.95 13.22 10.75
EPS
2.35 28.54 0.80 22.21 1.02
CAPITAL
STRUCTUR
Document Page
MANAGING FINANCE 10
E RATIOS
Debt Ratio
Long Terms
Debt/
(Shareholder
s Funds +
Long Term
Debt +
Current
Debt)
25.57% 28.19% 27.76% 28.26% 32.08%
(All non-
current
labilities
except
provisions)
Long term
debt
3,
432.00
3,
633.00
3,
638.00
4,
189.00
4,
274.00
Shareholders
’ funds
8,
390.00
7,
574.00
7,
926.00
8,
815.00
7,
588.00
Long term
debt
3,
432.00
3,
633.00
3,
638.00
4,
189.00
4,
274.00
Current
payables+
borrowings
Current debt
1,
598.00
1,
680.00
1,
541.00
1,
820.00
1,
462.00
Debt to
Equity Ratio
Long Term
Debt x
100%/
40.90584
029
47.96672
828
45.89957
103
47.52127
056
56.32577
754
tabler-icon-diamond-filled.svg

Paraphrase This Document

Need a fresh take? Get an instant paraphrase of this document with our AI Paraphraser
Document Page
MANAGING FINANCE 11
Shareholders
’ Funds
Long term
debt * 100
3,43,
200.00
3,63,
300.00
3,63,
800.00
4,18,
900.00
4,27,
400.00
Equity
8,
390.00
7,
574.00
7,
926.00
8,
815.00
7,
588.00
Ausnet Services:
31 March ended
Particulars Formula (Amounts in $ in millions)
LIQUIDITY
RATIOS
FORMULA 2018 2017 2016 2015 2014
Current ratio
Current
Assets/Curre
nt liabilities
1.000760
456
0.833608
956
0.625380
402
0.988115
557
0.640097
841
Current
Assets 921.20 655.30 822.00
1,
563.10 758.90
Current
Liabilities 920.50 786.10
1,
314.40
1,
581.90
1,
185.60
Quick Ratio
(Acid test)
(Current
assets
0.954807 0.778526 0.611305 0.975851 0.604419
Document Page
MANAGING FINANCE 12
Inventory)/C
urrent
liabilities
17 905 539 824 703
Current
Assets less
inventory
878.90 612.00 803.50
1,
543.70 716.60
Current
Liabilities 920.50 786.10
1,
314.40
1,
581.90
1,
185.60
-
Cash flow
ratio
0.962954
916
0.944917
949
0.540170
42
0.485239
269
0.615890
688
Cash flow
from
operations
886.40 742.80 710.00 767.60 730.20
Current
Liabilities 920.50 786.10
1,
314.40
1,
581.90
1,
185.60
PROFITABI
LITY
RATIOS
Gross Profit
margin
Gross Profit/
Turnover
(Sales)
90.78% 90.35% 92.67% 91.44% 36.00%
Sales-external Gross profit 1, 1, 1, 1, 647.7
chevron_up_icon
1 out of 39
circle_padding
hide_on_mobile
zoom_out_icon
[object Object]