Financial Project: Analysis of ASX Listed Healthcare Organizations
VerifiedAdded on  2020/10/22
|21
|4247
|496
Project
AI Summary
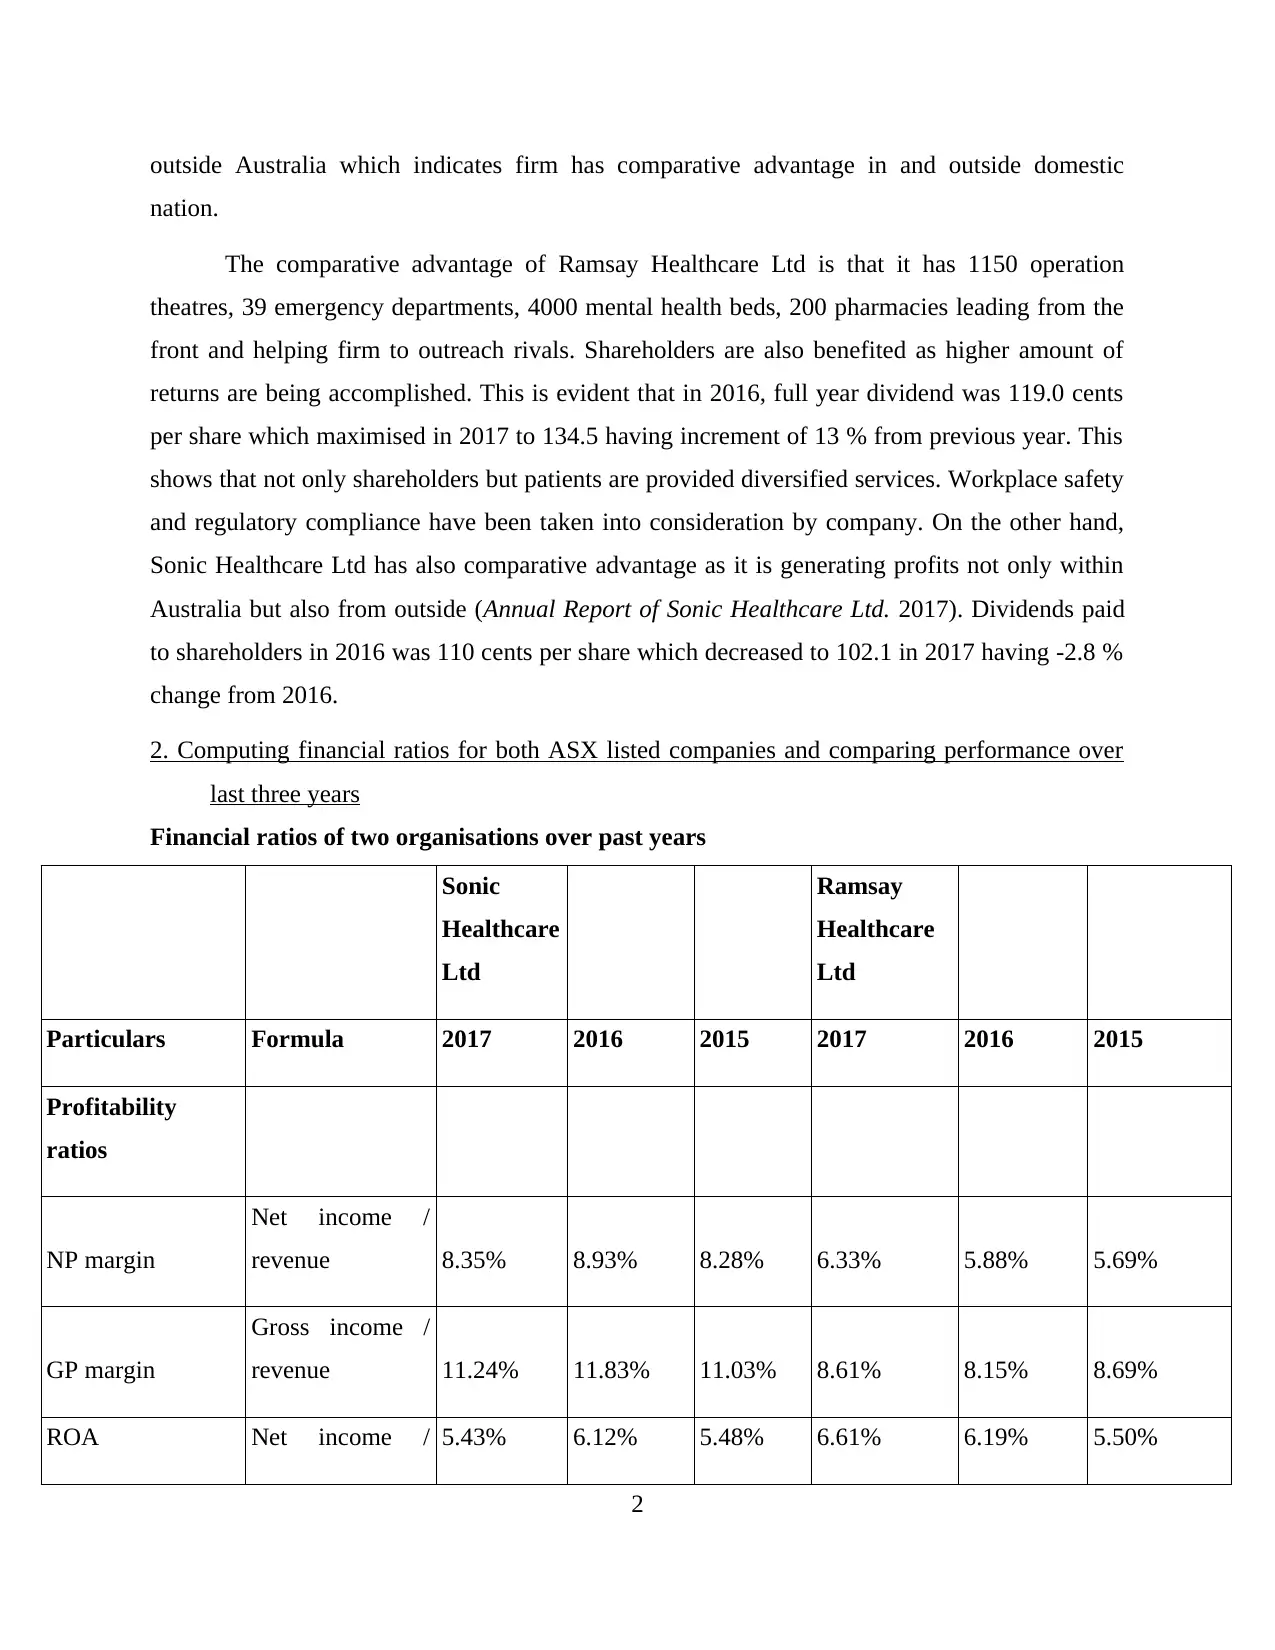
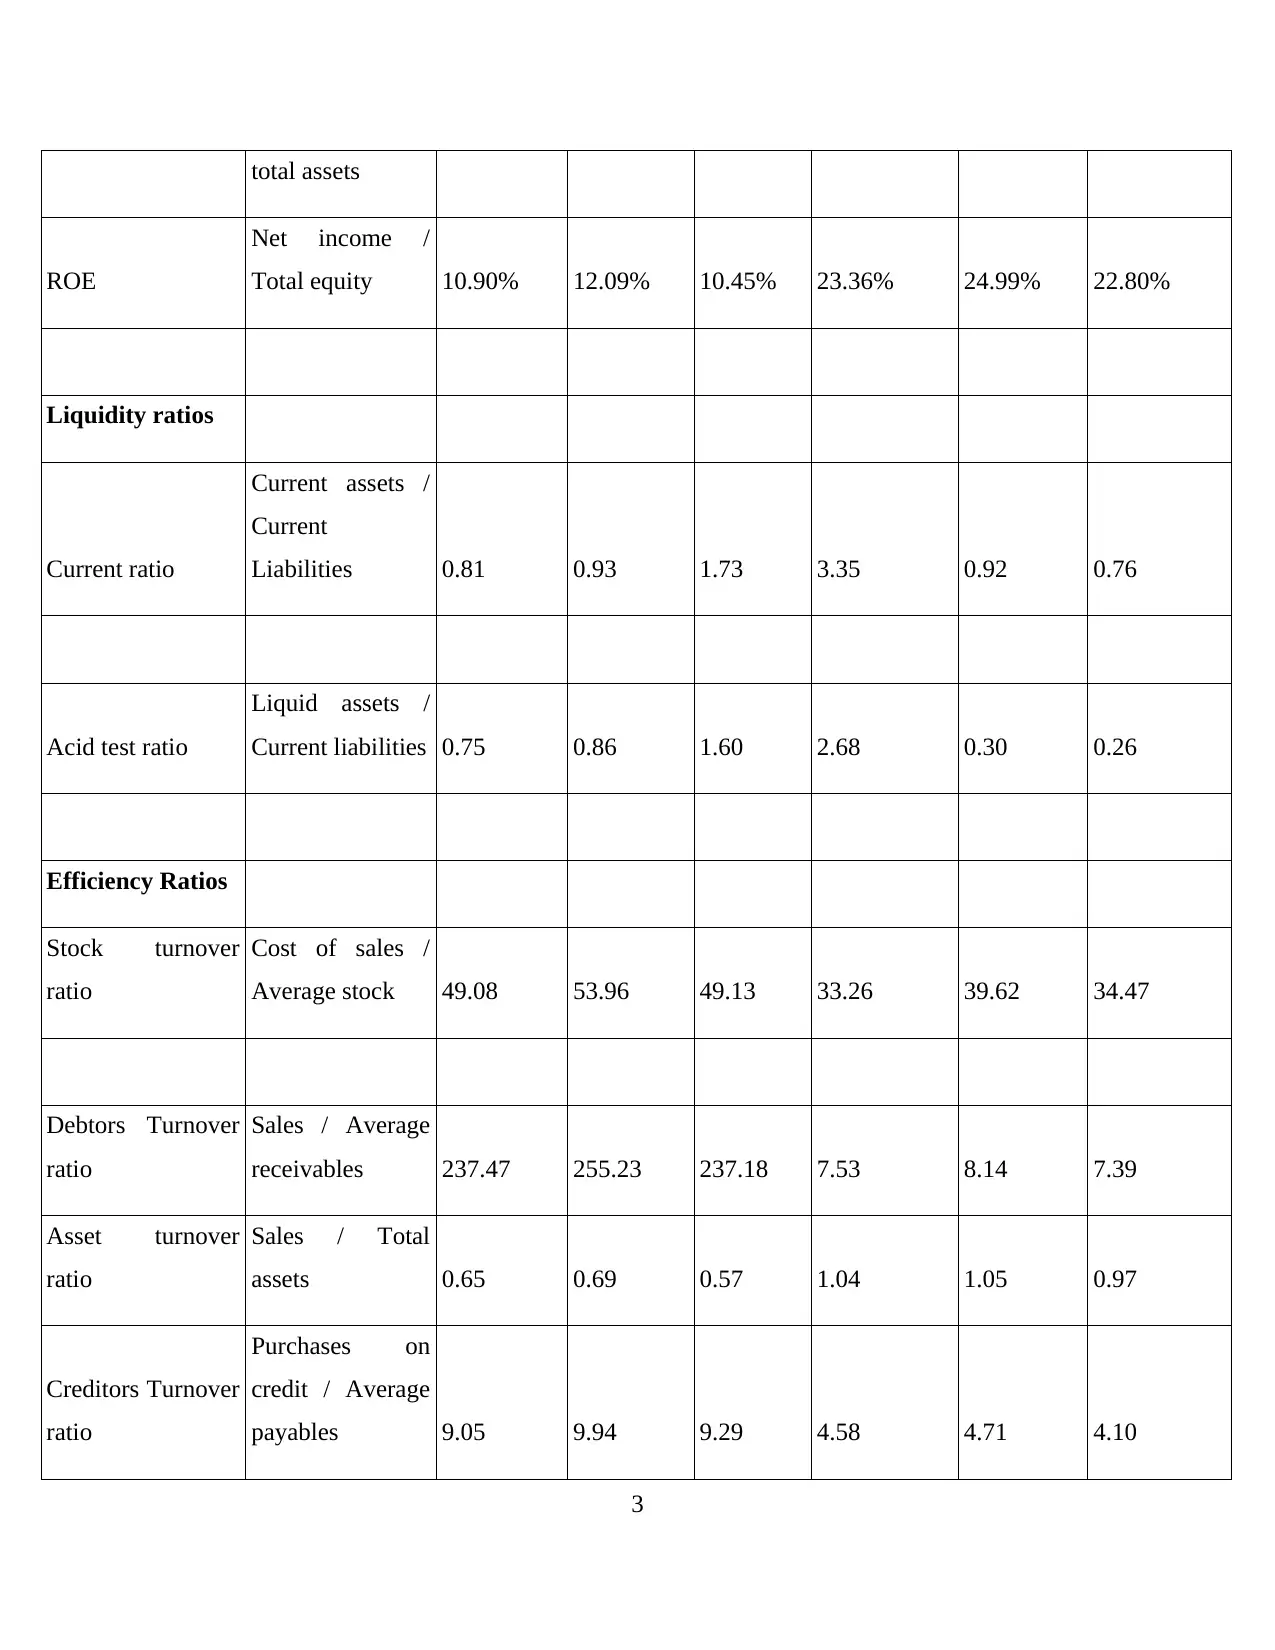
This finance project presents a detailed financial analysis of two ASX-listed healthcare organizations, Ramsay Healthcare Ltd and Sonic Healthcare Ltd. The project begins with an introduction outlining the scope, followed by a description of the companies' operations and comparative advantages. It includes a comprehensive ratio analysis comparing the companies' performance over three years, examining profitability, liquidity, efficiency, and capital structure. The project further delves into the analysis of monthly share price movements, factors influencing share prices, and the calculation of beta values and expected rates of return using the CAPM model. Dividend policies implemented by the companies are also examined, culminating in a recommendation for client investment. The project's conclusion summarizes key findings and recommendations, supported by relevant references. The financial ratios, including NP margin, GP margin, ROA, ROE, current ratio, acid test ratio, stock turnover ratio, debtors turnover ratio, asset turnover ratio, and creditors turnover ratio, are computed and compared to assess the financial health and investment potential of the two companies. The analysis provides insights into the companies' operational efficiency, profitability, and financial stability.

FINANCE PROJECT
Paraphrase This Document
Need a fresh take? Get an instant paraphrase of this document with our AI Paraphraser

TABLE OF CONTENTS
INTRODUCTION...........................................................................................................................1
MAIN BODY...................................................................................................................................1
1. Describing operation and comparative advantages of ASX listed organisations...............1
2. Computing financial ratios for both ASX listed companies and comparing performance
over last three years................................................................................................................2
3. Making analysis of monthly share prices movements of organisations in three years......7
................................................................................................................................................8
4. Outlining factors influencing price of shares of company.................................................8
5. Calculating of beta values and expected rate of return utilising CAPM model.................9
6. Outlining dividend policies implemented by companies.................................................11
7. Making recommendation to client regarding investment in portfolio..............................11
CONCLUSION..............................................................................................................................12
REFERENCES..............................................................................................................................12

INTRODUCTION
Investment decisions are to be made by carrying out analysis of various perspectives.
Present report deals with financial analysis of two ASX listed organisations such as Ramsay
Healthcare Ltd and Sonic Healthcare Ltd operating in healthcare industry. Ratio analysis is made
for both companies and CAPM model is applied for calculating required rate of return for
investors. Operation activities and comparative advantages of firms are enumerated. Along with
it, monthly share prices for three years are explained. Dividend policy implemented by firms and
factors leading to affect share prices are made. Finally, recommendation is made to client in
which he should invest for attaining returns.
MAIN BODY
1. Describing operation and comparative advantages of ASX listed organisations
Ramsay Healthcare Ltd is engaged in healthcare sector providing quality services quite
effectively. It is operating since 1964 in Sydney, Australia and is the largest private healthcare
provider founded by Paul Ramsay. The operational activities are conducted in UK, Australia,
Malaysia, France, Indonesia while, it is headquartered in Sydney. It has branches in nearly 221
locations and has employed more than 60,000 workers dedicated to giving services such as
surgery, rehabilitation, and psychiatric care. Moreover, on May 2018, company has partnered
with Ascension company located in US so as to initiate international supply chain venture. It is
earning higher profits from all its current locations having earned NPAT (Net Profit After Tax)
of AUD $542.7 million in 2017 which is increased or up by 12.7 % from previous year
highlighting clearly that organisation is effectively garnering profits from its operations (Annual
Report of Ramsay Healthcare Ltd. 2017).
Sonic Healthcare Ltd is also engaged in healthcare industry listed on ASX providing
laboratory, pathology and radiology services to customers. It has its presence from roots in
pathology service practice of Douglass Laboratories and thus, become the largest diagnostic
firms. The company comparative advantage is to effectively acquire overseas companies which
helps to maximise its operations in the best possible manner. Moreover, it is also able to earn
higher profits as it is evident from fact that yearly revenue exceeded AUD $5.1 billion in 2017.
Moreover, it can be analysed that operations in Australia is limited for company as country is
dependent on funding through Medicare. In relation to this, nearly 60 % of revenue came from
1
⊘ This is a preview!⊘
Do you want full access?
Subscribe today to unlock all pages.

Trusted by 1+ million students worldwide

outside Australia which indicates firm has comparative advantage in and outside domestic
nation.
The comparative advantage of Ramsay Healthcare Ltd is that it has 1150 operation
theatres, 39 emergency departments, 4000 mental health beds, 200 pharmacies leading from the
front and helping firm to outreach rivals. Shareholders are also benefited as higher amount of
returns are being accomplished. This is evident that in 2016, full year dividend was 119.0 cents
per share which maximised in 2017 to 134.5 having increment of 13 % from previous year. This
shows that not only shareholders but patients are provided diversified services. Workplace safety
and regulatory compliance have been taken into consideration by company. On the other hand,
Sonic Healthcare Ltd has also comparative advantage as it is generating profits not only within
Australia but also from outside (Annual Report of Sonic Healthcare Ltd. 2017). Dividends paid
to shareholders in 2016 was 110 cents per share which decreased to 102.1 in 2017 having -2.8 %
change from 2016.
2. Computing financial ratios for both ASX listed companies and comparing performance over
last three years
Financial ratios of two organisations over past years
Sonic
Healthcare
Ltd
Ramsay
Healthcare
Ltd
Particulars Formula 2017 2016 2015 2017 2016 2015
Profitability
ratios
NP margin
Net income /
revenue 8.35% 8.93% 8.28% 6.33% 5.88% 5.69%
GP margin
Gross income /
revenue 11.24% 11.83% 11.03% 8.61% 8.15% 8.69%
ROA Net income / 5.43% 6.12% 5.48% 6.61% 6.19% 5.50%
2
Paraphrase This Document
Need a fresh take? Get an instant paraphrase of this document with our AI Paraphraser

total assets
ROE
Net income /
Total equity 10.90% 12.09% 10.45% 23.36% 24.99% 22.80%
Liquidity ratios
Current ratio
Current assets /
Current
Liabilities 0.81 0.93 1.73 3.35 0.92 0.76
Acid test ratio
Liquid assets /
Current liabilities 0.75 0.86 1.60 2.68 0.30 0.26
Efficiency Ratios
Stock turnover
ratio
Cost of sales /
Average stock 49.08 53.96 49.13 33.26 39.62 34.47
Debtors Turnover
ratio
Sales / Average
receivables 237.47 255.23 237.18 7.53 8.14 7.39
Asset turnover
ratio
Sales / Total
assets 0.65 0.69 0.57 1.04 1.05 0.97
Creditors Turnover
ratio
Purchases on
credit / Average
payables 9.05 9.94 9.29 4.58 4.71 4.10
3

Capital structure
(leverage) ratio
Debt to Equity Debt / Equity 0.52 0.56 0.67 1.38 1.63 1.48
Profitability ratios
NP margin-
Figure 1NP margin
The NP margin has been calculated for companies highlighting their profitability position
quite effectually (Dougal, Parsons and Titman, 2015). Ramsay Healthcare Ltd had ratio of 5.69
% in 2015, increased to 5.88 % and 6.33 % in consecutive years showing that it has initiated
control over its expenses leading to maximum profits. While, net profit ratio of Sonic Healthcare
Ltd was 8.28 % in 2015, increased to 8.93 % in 2016 and reached to 8.35 % in recent year. The
profit margin of Sonic Healthcare Ltd is decreased but it is more than other company.
GP margin-
4
⊘ This is a preview!⊘
Do you want full access?
Subscribe today to unlock all pages.

Trusted by 1+ million students worldwide

Figure 2GP margin
GP of Sonic Healthcare Ltd was 11.03 % in 2015 which increased to 11.83 % in 2016
which was reduced to 11.24 % in 2017. This shows that firm needs to control over its operational
expenditures in order to increase gross profit. While, Ramsay Healthcare Ltd had 8.69 % ratio in
2015, decreased to 8.15 % in next year and increased to 8.61 % in 2017. Thus, it can be analysed
from the above chart that GP of Sonic Healthcare Ltd is comparatively good.
ROA-
5
Paraphrase This Document
Need a fresh take? Get an instant paraphrase of this document with our AI Paraphraser

Figure 3ROA
ROA abbreviated as Return on Assets is useful measure to analyse how much return has
been generated by assets leading to increment in profits up to a major extent. It can be assessed
from chart that ROA of Sonic Healthcare Ltd was 5.48 % in 2015, increased to 6.12 % in 2016
and decreased to 5.43 % in recent year. On the other hand, ratio of Ramsay Healthcare Ltd was
5.50 % in 2015 which elevated to 6.19 % and further increased to 6.61 % in 2017.
ROE-
Figure 4ROE
6

ROE (Return on Equity) is another measure to judge profitability of the concern quite
easily. It is helpful for shareholders as they come to know whether investment made by them
being judiciously used by organisation or not. Higher the ratio, better for firm. It can be analysed
that ratio of Sonic Healthcare Ltd was 10.45 % in 2015 which elevated to 12.09 % in 2016 and
again decreased to 10.90 % in later year. While, Ramsay Healthcare Ltd had 22.80 % of ROE,
increased in 2015 to 24.99 % and decreased to 23.36 % in 2017. It indicates that Ramsay
Healthcare Ltd is effectively utilising shareholder's equity for operating activities.
Liquidity ratios
Current ratio-
Figure 5Current ratio
Short-term obligations have to be met by company so that liquidity position may be
enhanced in a better way (DeYoung and et.al., 2015. ). It can be interpreted that current ratio of
Sonic Healthcare Ltd was 1.73 in 2015, decreased to 0.93 and further to 0.81 in 2017. This
implies that organisation's liquidity aspect is not good and will face difficult in making payments
within one year. On the other hand, current ratio of Ramsay Healthcare Ltd was 0.76 in 2015,
incremented to 0.92 in next year and maximised to 3.35 in 2017. Thus, it has higher current ratio
and would effectively pay liabilities in an timely manner.
Acid test ratio-
7
⊘ This is a preview!⊘
Do you want full access?
Subscribe today to unlock all pages.

Trusted by 1+ million students worldwide

Figure 6Acid test ratio
Acid test ratio is another useful measure for determining liquidity. It provides clarity
whether from extreme liquid assets, company would be able to pay liabilities or not. Extreme
liquid assets includes inventory and prepayments which are subtracted from current assets to
reach at it. The ratio was 0.26 in 2015 of Ramsay Healthcare Ltd which maximised to 0.30 in
next year. Furthermore, acid test ratio was 2.68 in 2017. While, Sonic Healthcare Ltd had 1.60 of
ratio in 2015, increased to 0.86 and reached to 0.75 in 2017. This means that acid test ratio of
both companies is good.
Efficiency Ratios
Stock turnover ratio-
8
Paraphrase This Document
Need a fresh take? Get an instant paraphrase of this document with our AI Paraphraser

Figure 7Stock turnover ratio
Inventory should be quickly used by company in order to enhance production level in the
best possible manner. It can be analysed that stock turnover ratio of Ramsay Healthcare Ltd was
34.47, 39.62 in 2015 and 2016. Figure reduced to 33.26 in 2017 which means that firm is
effectively attaining production and using stock in quick way. On the other hand, stock turnover
ratio of Sonic Healthcare Ltd was 49.13 in 2015, increased to 53.96 in later year and reduced to
49.08 in 2017. This shows that ratio of Ramsay Healthcare Ltd is good in comparison to other
company in utilising inventory.
Debtors Turnover ratio-
9

Figure 8Debtors Turnover ratio
Debtors are required to be pay amount within stipulated time so that operational activities
of company may not get interrupted (Low, Yao and Faff, 2016). It is used to assess how quickly
outstanding money from debtors are collected by company. Chart shows that ratio of Sonic
Healthcare Ltd was 237.18 in 2015 which increased to 255.23 in later year and again decreased
to 237.47 in 2017. On the other hand, Ramsay Healthcare Ltd had ratio of 7.39 in 2015 which
maximised to 8.14 in 2016 and reached to 7.53 in recent year. Thus, both firms are quickly
attaining money from credit customers.
Asset turnover ratio-
10
⊘ This is a preview!⊘
Do you want full access?
Subscribe today to unlock all pages.

Trusted by 1+ million students worldwide
1 out of 21
Related Documents

Your All-in-One AI-Powered Toolkit for Academic Success.
 +13062052269
info@desklib.com
Available 24*7 on WhatsApp / Email
Unlock your academic potential
Copyright © 2020–2025 A2Z Services. All Rights Reserved. Developed and managed by ZUCOL.