ATHK1001 Analytic Thinking Assignment Solution: Statistical Analysis

Verified

Added on  2022/09/18

|8
|1007
|24
Homework Assignment
AI Summary
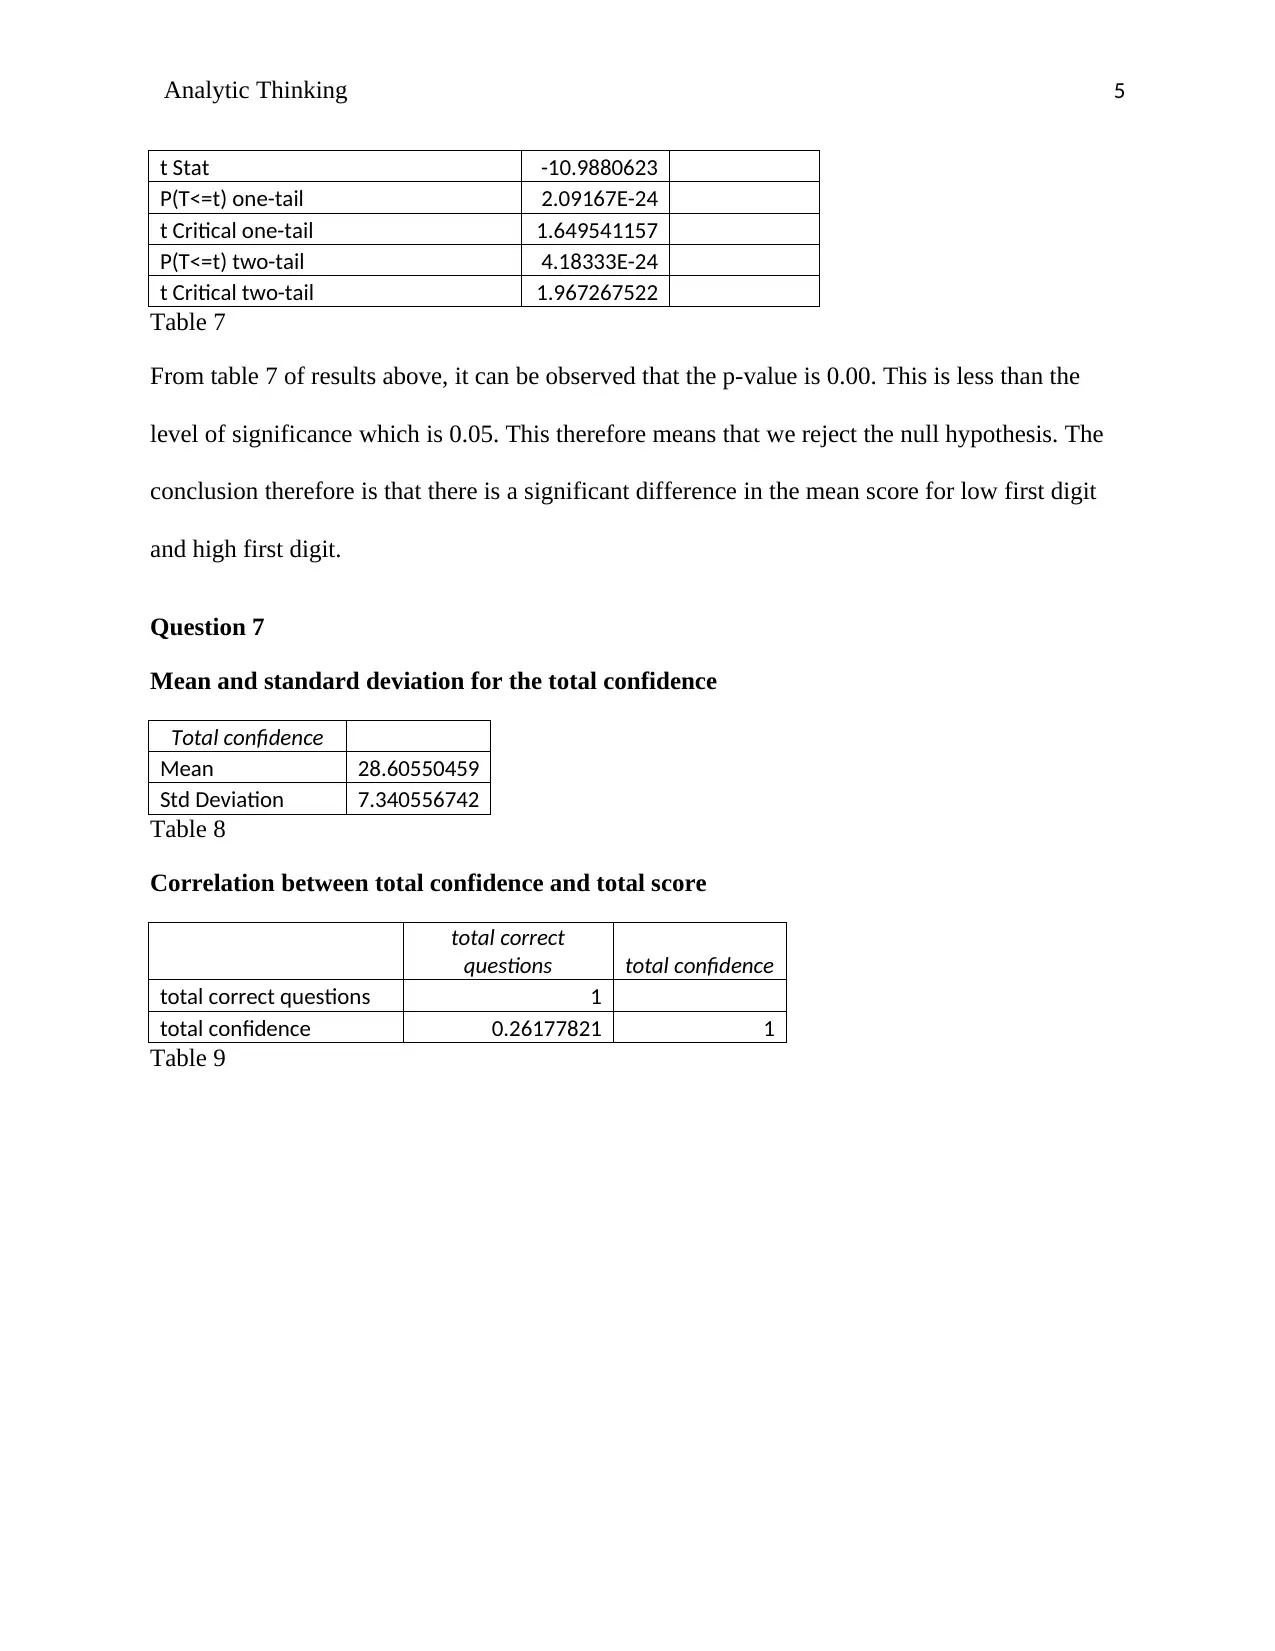
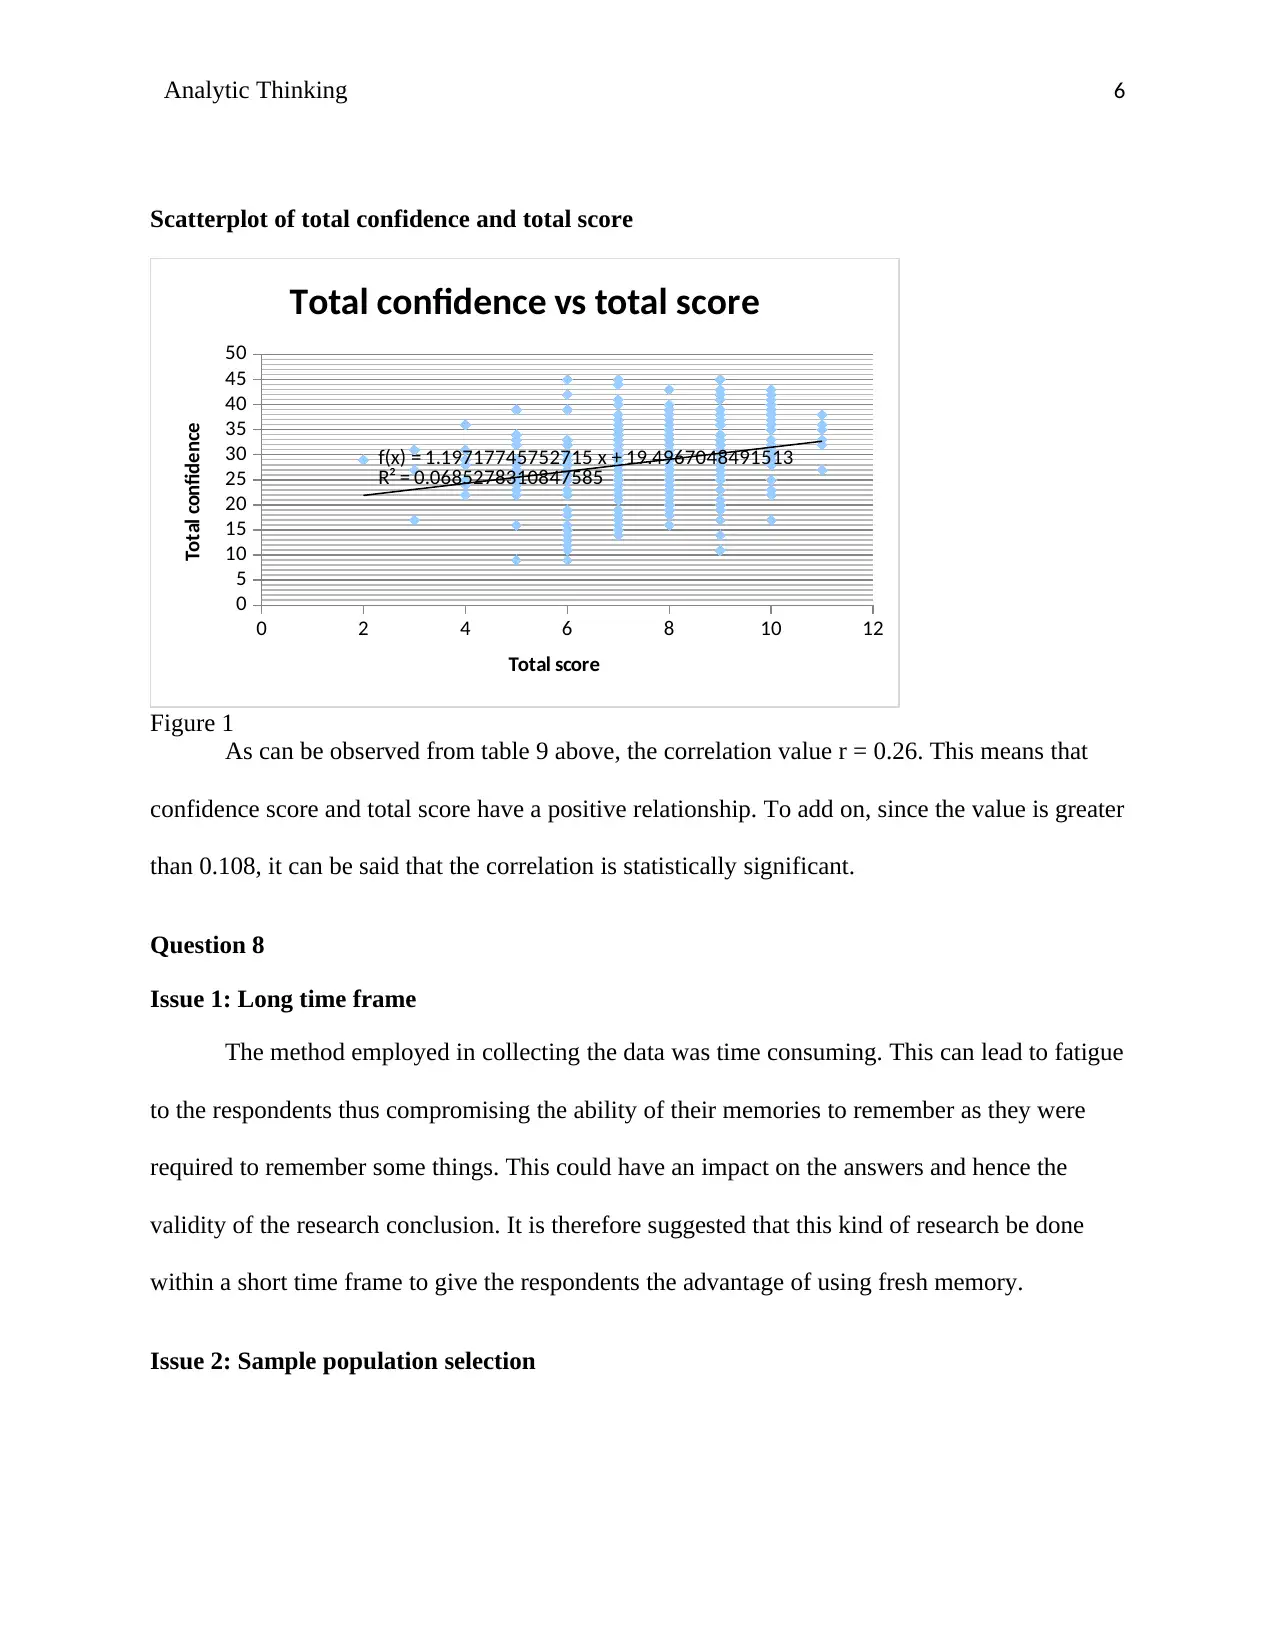
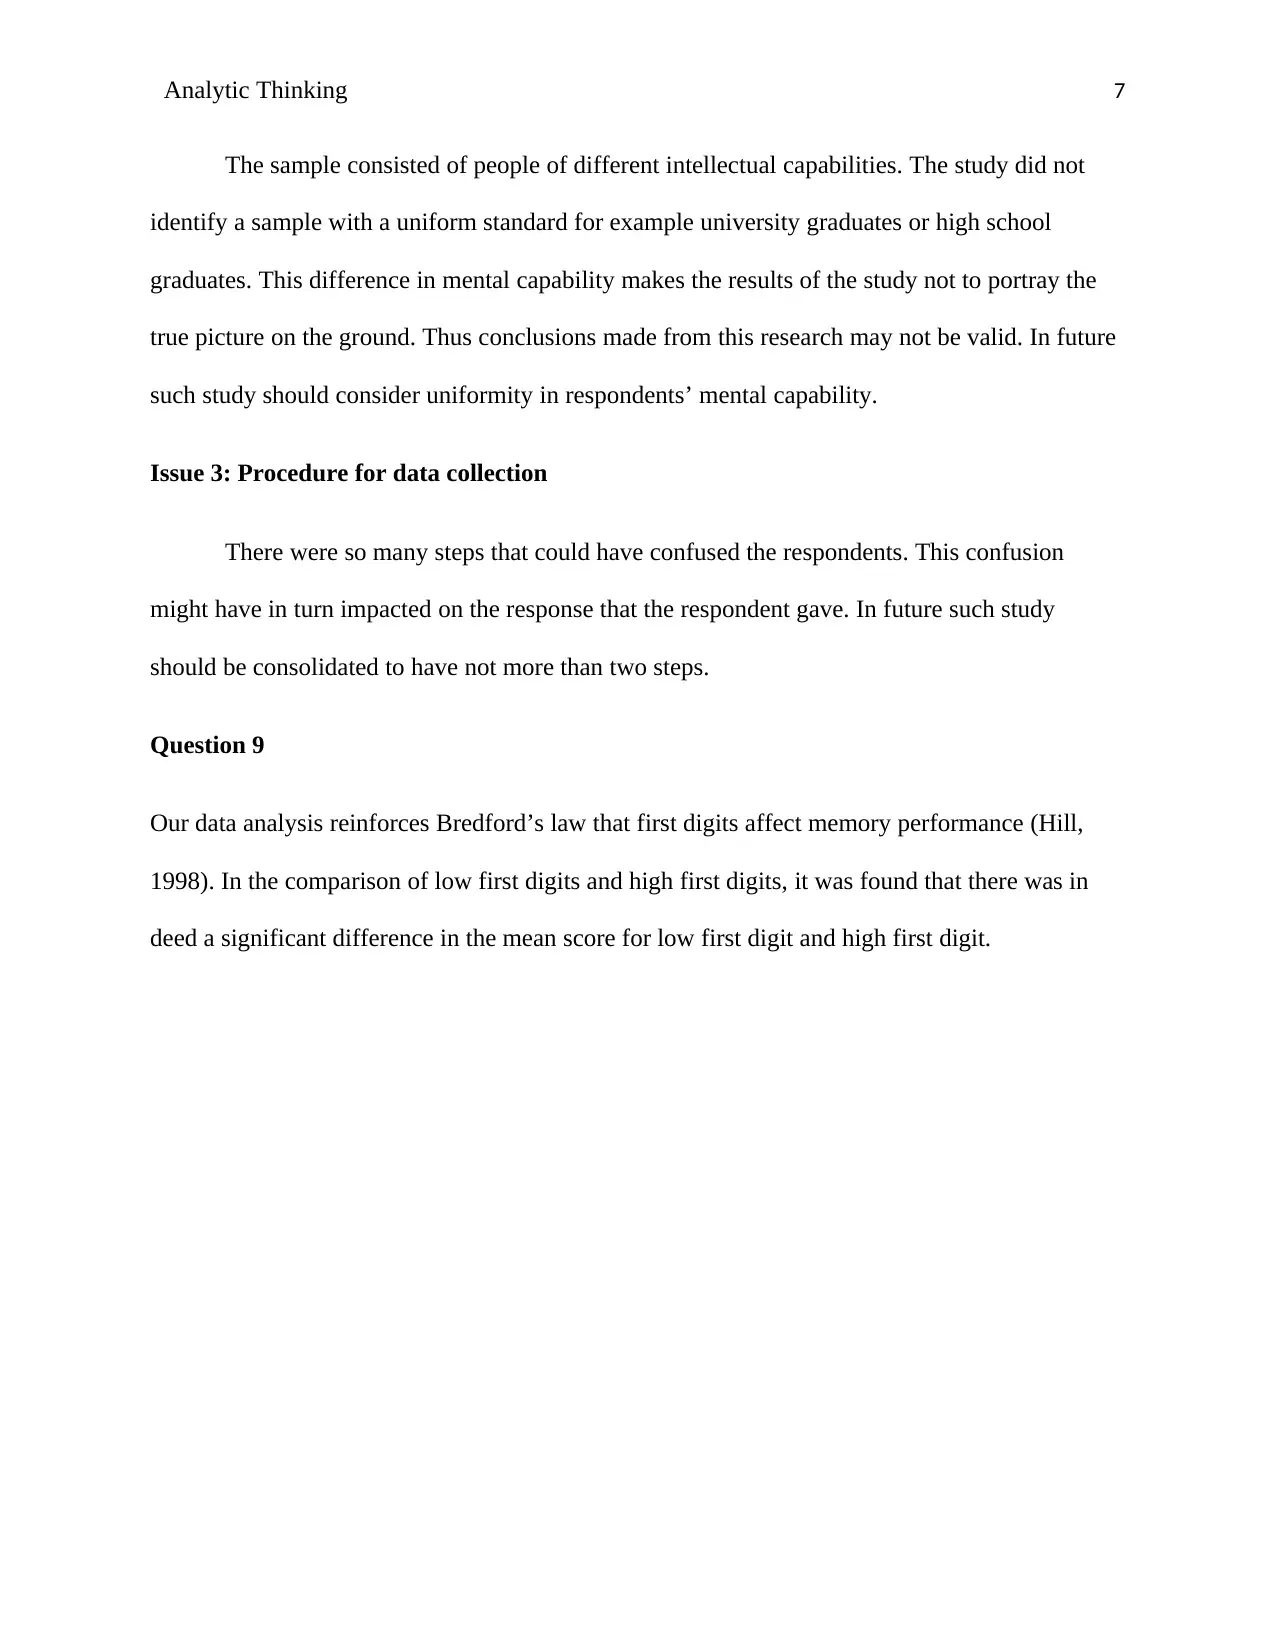
This assignment solution provides a comprehensive analysis of data related to analytic thinking. It begins with descriptive statistics, including mean, median, mode, and standard deviation, followed by hypothesis testing using t-tests to compare means and assess the significance of differences. The analysis explores various factors, such as odd vs. even correct answers and low vs. high first digits, to determine their impact on test scores. Correlation analysis is used to examine the relationship between total confidence and total score. The solution also identifies potential issues with the data collection process, such as the time frame, sample population, and data collection procedure, and suggests improvements. The findings support Bredford’s law and highlight the importance of first digits in memory performance.
Document Page
Running head: Analytic Thinking 1
Analytic Thinking
Course code:
Student:
Tutor:
tabler-icon-diamond-filled.svg

Paraphrase This Document

Need a fresh take? Get an instant paraphrase of this document with our AI Paraphraser
Document Page
Analytic Thinking 2
Question 1
Correctly answered questions
Correct questions summary statistics
Mean 7.608562691
Standard Error 0.088762615
Median 8
Mode 8
Standard Deviation 1.605106904
Sample Variance 2.576368173
Count 327
Table 1
Question 2
Hypothesis
H0: μ = 4.5
H1: μ > 4.5
α.= 0.05
Table of results
t-Test: One Sample for Means
correct
questions
Mean 7.608562691
Variance 2.576368173
Observations 327
Hypothesized Mean Difference 4.5
df 326
t Stat 35.02108072
P(T<=t) one-tail 8.1697E-113
t Critical one-tail 1.649541157
P(T<=t) two-tail 1.6339E-112
t Critical two-tail 1.967267522
Table 2
Document Page
Analytic Thinking 3
From the table of results above, it can be observed that the p-value is 0.00. This is less than the
level of significance which is 0.05. This therefore means that we reject the null hypothesis and
conclude that the mean number of correct scores is greater than 4.5.
Question 3
Mean and standard deviation for odd and even correctly answered questions
Odd correct questions (COND 2) Even correct questions (COND 1)
Mean
7.78651685
4 Mean
7.25581395
3
Standard Deviation
1.64089713
6 Standard Deviation
1.68163818
2
Table 3
Question 4
Difference for the mean test scores between odd and even correct questions
Hypothesis
H0: There is no difference in the mean score between odd and even correct questions
H1: There is a significant difference in the mean score between odd and even correct questions
α.= 0.05
Table of results
t-Test: Two-Sample Assuming Equal Variances
Odd correct questions Even correct questions
Mean 7.456790123 7.776397516
Variance 2.597500192 2.549689441
Observations 89 86
Pooled Variance 2.573669288
Hypothesized Mean Difference 0
df 321
t Stat -1.790233293
P(T<=t) one-tail 0.037179372
t Critical one-tail 1.649614384
P(T<=t) two-tail 0.074358744
t Critical two-tail 1.967381707
Document Page
Analytic Thinking 4
Table 5
From table 5 of results above, it can be observed that the p-value is 0.07. This is greater than the
level of significance which is 0.05. This therefore means that we do not reject the null
hypothesis. The conclusion therefore is that there is no difference in the mean score between odd
and even correct questions.
Question 5
Mean and standard deviation
Low first digit high first digit
Mean
0.52782
9 Mean
0.69357
8
Standard
Deviation
0.20347
3
Standard
Deviation
0.20823
9
Table 6
Question 6
Difference for the mean test scores for low first digit and high first digit
Hypothesis
H0: There is no difference in the mean test scores for low first digit and high first digit
H1: There is a significant difference in the mean score mean test scores for low first digit and
high first digit
α.= 0.05
Table of results
t-Test: Paired Two Sample for Means
Low first
digit
high first
digit
Mean 0.527828746 0.693577982
Variance 0.041401099 0.043363539
Observations 327 327
Pearson Correlation 0.122236197
Hypothesized Mean Difference 0
df 326
tabler-icon-diamond-filled.svg

Paraphrase This Document

Need a fresh take? Get an instant paraphrase of this document with our AI Paraphraser
Document Page
Analytic Thinking 5
t Stat -10.9880623
P(T<=t) one-tail 2.09167E-24
t Critical one-tail 1.649541157
P(T<=t) two-tail 4.18333E-24
t Critical two-tail 1.967267522
Table 7
From table 7 of results above, it can be observed that the p-value is 0.00. This is less than the
level of significance which is 0.05. This therefore means that we reject the null hypothesis. The
conclusion therefore is that there is a significant difference in the mean score for low first digit
and high first digit.
Question 7
Mean and standard deviation for the total confidence
Total confidence
Mean 28.60550459
Std Deviation 7.340556742
Table 8
Correlation between total confidence and total score
total correct
questions total confidence
total correct questions 1
total confidence 0.26177821 1
Table 9
Document Page
Analytic Thinking 6
Scatterplot of total confidence and total score
0 2 4 6 8 10 12
0
5
10
15
20
25
30
35
40
45
50
f(x) = 1.19717745752715 x + 19.4967048491513
R² = 0.0685278310847585
Total confidence vs total score
Total score
Total confidence
Figure 1
As can be observed from table 9 above, the correlation value r = 0.26. This means that
confidence score and total score have a positive relationship. To add on, since the value is greater
than 0.108, it can be said that the correlation is statistically significant.
Question 8
Issue 1: Long time frame
The method employed in collecting the data was time consuming. This can lead to fatigue
to the respondents thus compromising the ability of their memories to remember as they were
required to remember some things. This could have an impact on the answers and hence the
validity of the research conclusion. It is therefore suggested that this kind of research be done
within a short time frame to give the respondents the advantage of using fresh memory.
Issue 2: Sample population selection
Document Page
Analytic Thinking 7
The sample consisted of people of different intellectual capabilities. The study did not
identify a sample with a uniform standard for example university graduates or high school
graduates. This difference in mental capability makes the results of the study not to portray the
true picture on the ground. Thus conclusions made from this research may not be valid. In future
such study should consider uniformity in respondents’ mental capability.
Issue 3: Procedure for data collection
There were so many steps that could have confused the respondents. This confusion
might have in turn impacted on the response that the respondent gave. In future such study
should be consolidated to have not more than two steps.
Question 9
Our data analysis reinforces Bredford’s law that first digits affect memory performance (Hill,
1998). In the comparison of low first digits and high first digits, it was found that there was in
deed a significant difference in the mean score for low first digit and high first digit.
tabler-icon-diamond-filled.svg

Paraphrase This Document

Need a fresh take? Get an instant paraphrase of this document with our AI Paraphraser
Document Page
Analytic Thinking 8
Reference
Hill, T. P. (1998). A century-old observation about an unexpected pattern in many numerical
tables applies to the stock market, census statistics and accounting data. American
Scientist, 86(4), 358-363.
chevron_up_icon
1 out of 8
circle_padding
hide_on_mobile
zoom_out_icon
[object Object]