BUS501 Business Analytics: Athlete Panda Business Research Report
VerifiedAdded on 2023/06/04
|21
|2679
|133
Report
AI Summary
This business research report delves into the financial and customer data of Athlete Panda, a retail store specializing in athletic products. The report addresses key challenges identified by the CEO, focusing on profitability and sustainability in a competitive market. Through statistical analysis, including contingency tables, paired t-tests, independent t-tests, and ANOVA, the research investigates product category costs and profitability, the impact of store location on sales, payment method preferences, and the influence of gender and user groups on customer attitudes (knowledge, satisfaction, preference, purchase intention, loyalty, and recommendation). Key findings reveal that women's clothing incurs the highest costs, while men's shoes and women's clothing generate the most profit. Online stores outperform physical locations in profit, and payment methods show significant correlations. Gender and user group analyses uncover differences in customer attitudes, providing valuable insights for strategic business decisions. The report concludes with recommendations to enhance sales and improve customer engagement based on the data-driven findings.
Business Research Report – Athlete Panda 1
Business Research Report – Athlete Panda
By Student’s Name
Student’s Number
BUS501 - Business Analytics and Statistics
Tutor’s Name
Name of the University
Date
Word Count:
Business Research Report – Athlete Panda
By Student’s Name
Student’s Number
BUS501 - Business Analytics and Statistics
Tutor’s Name
Name of the University
Date
Word Count:
Paraphrase This Document
Need a fresh take? Get an instant paraphrase of this document with our AI Paraphraser
Business Research Report – Athlete Panda 2
Table of Contents
Introduction......................................................................................................................................3
Problem Definition..........................................................................................................................4
Research Questions..........................................................................................................................4
Analytic Methods and Technical Analysis......................................................................................6
Contingency Table Analysis........................................................................................................6
Paired T-Test...............................................................................................................................6
Independent t-test.........................................................................................................................7
ANOVA.......................................................................................................................................7
Results..............................................................................................................................................7
Which Product Category Costs the Most?...................................................................................7
Which Product Categories Are Making Most Profit?..................................................................8
Is There A Difference in Store Location and Sales?...................................................................9
Is There as Difference in Payments Methods?..........................................................................10
Are There Any Differences in Gender on All the Customer Attitudes?....................................10
i. Knowledge......................................................................................................................10
ii. Satisfaction......................................................................................................................10
iii. Preference........................................................................................................................11
iv. Purchase Intentions.........................................................................................................11
v. Loyalty............................................................................................................................11
vi. Recommend....................................................................................................................12
Are There Any Differences in The User Groups on All the Customer Attitudes?....................12
i. Knowledge......................................................................................................................12
ii. Satisfaction......................................................................................................................13
iii. Preference........................................................................................................................13
iv. Purchase Intentions.........................................................................................................13
v. Loyalty............................................................................................................................14
vi. Recommend....................................................................................................................14
Discussion and recommendations..................................................................................................15
References......................................................................................................................................16
Appendix........................................................................................................................................17
Business Research Report – Athlete Panda 3
Table of Figures
Figure 1: Pie Chart Cost of Goods Sold (COGS) by Product Category..........................................8
Figure 2: Bar Chart of Sum of Profit Total by Product Category...................................................9
Figure 3: ANOVA results for Profit Total by Store Location.........................................................9
Figure 4: Paired T-Test for Payment Methods..............................................................................10
Figure 5: Independent t-test on Knowledge by Gender.................................................................10
Figure 6: Independent t-test on Satisfaction by Gender................................................................11
Figure 7: Independent t-test on Preference by Gender..................................................................11
Figure 8: Independent t-test on Purchase Intentions by Gender....................................................11
⊘ This is a preview!⊘
Do you want full access?
Subscribe today to unlock all pages.
Trusted by 1+ million students worldwide
Business Research Report – Athlete Panda 4
Introduction
Athlete Panda is a small retail store that sells athletic products, mainly clothing and
shoes. Nonetheless, the store also sells athletic accessories and sporting equipment. The business
has five major sectors: Men’s, Boys, Women’s, Girls and Customization. The common brands
that can be found at the store are Under Armour, Converse, Puma, ASICS, Nike, New Balance
and Adidas. The company has been operating using the brick and mortar model, with several
retail stores across the region for five years. However, the rise of e-commerce pushed the
business to start trading online one year ago. Hence, the growing customer base. Customization
is popular for online customers from all over the country because it allows them to customise
their sneakers depending on use by a click of a button from the comfort of their home. Sneakers
can be customised depending on lifestyle, running, football, basketball, gym & training, and
skateboarding. Moreover, there are options to customise boys’ and girls’ shoes.
Problem Definition
The Chief Executive Officer of Athlete Panda is concerned with the profitability and
sustainability of the business. The company operates in a very competitive industry and faces
several challenges. The main challenges are cost of goods margins, profit margins and number of
sales. This report will analyse the financial data (shop sales) of the company over the past year,
as well as customer responses to an online survey. Thereafter, the analysis will indicate how the
business can increase sales and how their customers feel about the store.
Paraphrase This Document
Need a fresh take? Get an instant paraphrase of this document with our AI Paraphraser
Business Research Report – Athlete Panda 5
Research Questions
The challenges stated by the company’s management are the basis of the report’s
research questions. Therefore, critically analyse the business of Athlete Panda, the following
research questions were used.
1. Which product category costs the most?
The report uses this question to clarify which product category incurs the most cost.
Hence, the business will be to analyse how the product category affects the profitability of the
store.
2. Which product categories are making most profit?
One of the main challenges for the company’s management is making good profit. This
question will help the research identify which product category brings in more revenue for the
business.
3. Is there a difference in store location and sales?
It is important too understand how the sales of the business are affected by the location of
the store. Generally, a physical store at the front of a busy street is expected to attract more
customers, hence should have higher sales. This question also allows the research to analyse
whether trading online is beneficial to the business.
4. Is there as difference in payments methods?
The company offers its customers two option to pay for their products; cash or credit
card. This question allows the research to analyse which payment method is popular among the
customers. Hence, the business can plan its finances more effectively.
5. Are there any differences in gender on all the customer attitudes?

Business Research Report – Athlete Panda 6
The online customer survey aimed at identifying how customers feel about the business. In
particular, the researched attributes of the customers were knowledge, satisfaction, preference,
purchase intention, loyalty and recommendation. This question will enable the researcher to
identify whether the gender of a customer affects their attitude towards the company’s products
6. Are there any differences in the user groups on all the customer attitudes?
This question is vital in analysing how customer attitudes vary across the different user
groups. In other words, does the frequency of visits to the store influence the customer’s attitude
towards the business and its products.
Analytic Methods and Technical Analysis
Contingency Table Analysis
The use of contingency tables, also known as cross-tabulation, is often used to provide
information about the relationship between two or more variables (Waller, 2010). This analytic
method is simple to use and the results allows the researcher to identify patterns, trends and
probabilities within data sets. When using large datasets, it becomes a daunting task to infer any
insights for business decisions. Hence, cross tabulation creates tables that divided the total
dataset into representative subgroup which become easier to interpret. Analysing contingency
tables reduces confusion and error while providing profound insights effectively (Hinton,
Brownlow and McMurray, 2014).
The report utilised contingency table to analyse research questions one and two. This is
because the variables involved are categorical. The Chi-Square test was used to test the statistical
significance of the relationship between the variables (Simpson, 1951). If there is no relationship,
the variables are independent, and the results of crosstabulation are not dependable for strategic
business decisions.
⊘ This is a preview!⊘
Do you want full access?
Subscribe today to unlock all pages.
Trusted by 1+ million students worldwide
Business Research Report – Athlete Panda 7
Paired T-Test
The paired sample t-test also known as dependent t-test is used to compare two means of
related objects (Newbold, Carlson and Thorne, 2013). The purpose of this analytical method is to
determine whether the mean of two different but related variables are statistically different. The
dependent t-test was used to analyse research question four to determine the difference in
payment methods.
Independent t-test
The independent samples t-test is used to compare the means of two independent
variables so as to determine whether they are significantly different. This analytical method was
used to determine whether there is any statistically significant difference in gender on each of the
six customer attitudes, as stated in research question five.
ANOVA
The one-way analysis of variance (ANOVA) is used to compare the means of more than
two independent groups (Albright, 2017). For this test, the grouping variable is divided into more
than two levels, and is compared to the dependent variable. This test will be used to determine if
there are any significant differences between the variables in research question three and six.
Results
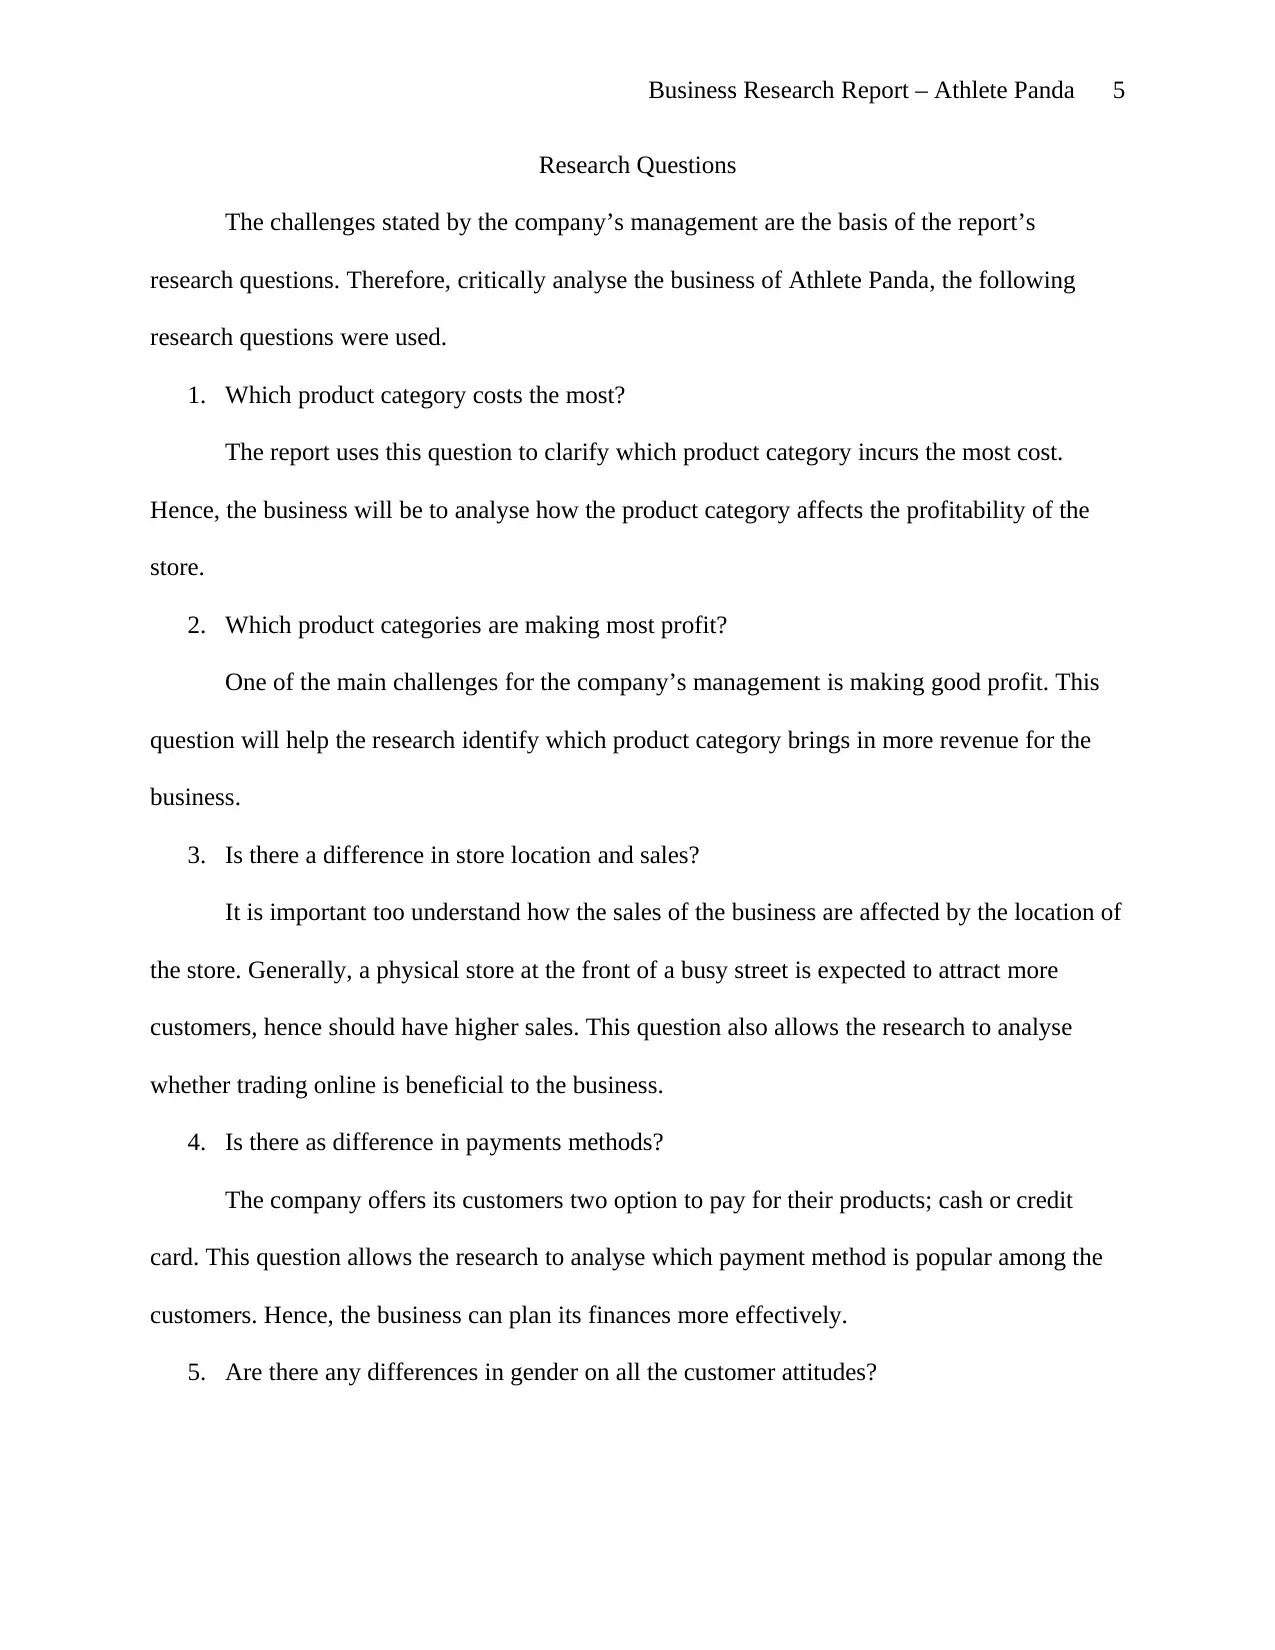
Which Product Category Costs the Most?
The cross- tabulation indicate that women’s clothing incur the greatest proportion of cost
of goods sold (COGS). The chart below indicated how the cost of goods sold is distributed
among the product categories.
Paired T-Test
The paired sample t-test also known as dependent t-test is used to compare two means of
related objects (Newbold, Carlson and Thorne, 2013). The purpose of this analytical method is to
determine whether the mean of two different but related variables are statistically different. The
dependent t-test was used to analyse research question four to determine the difference in
payment methods.
Independent t-test
The independent samples t-test is used to compare the means of two independent
variables so as to determine whether they are significantly different. This analytical method was
used to determine whether there is any statistically significant difference in gender on each of the
six customer attitudes, as stated in research question five.
ANOVA
The one-way analysis of variance (ANOVA) is used to compare the means of more than
two independent groups (Albright, 2017). For this test, the grouping variable is divided into more
than two levels, and is compared to the dependent variable. This test will be used to determine if
there are any significant differences between the variables in research question three and six.
Results
Which Product Category Costs the Most?
The cross- tabulation indicate that women’s clothing incur the greatest proportion of cost
of goods sold (COGS). The chart below indicated how the cost of goods sold is distributed
among the product categories.
Paraphrase This Document
Need a fresh take? Get an instant paraphrase of this document with our AI Paraphraser
Business Research Report – Athlete Panda 8
Figure 1: Pie Chart Cost of Goods Sold (COGS) by Product Category
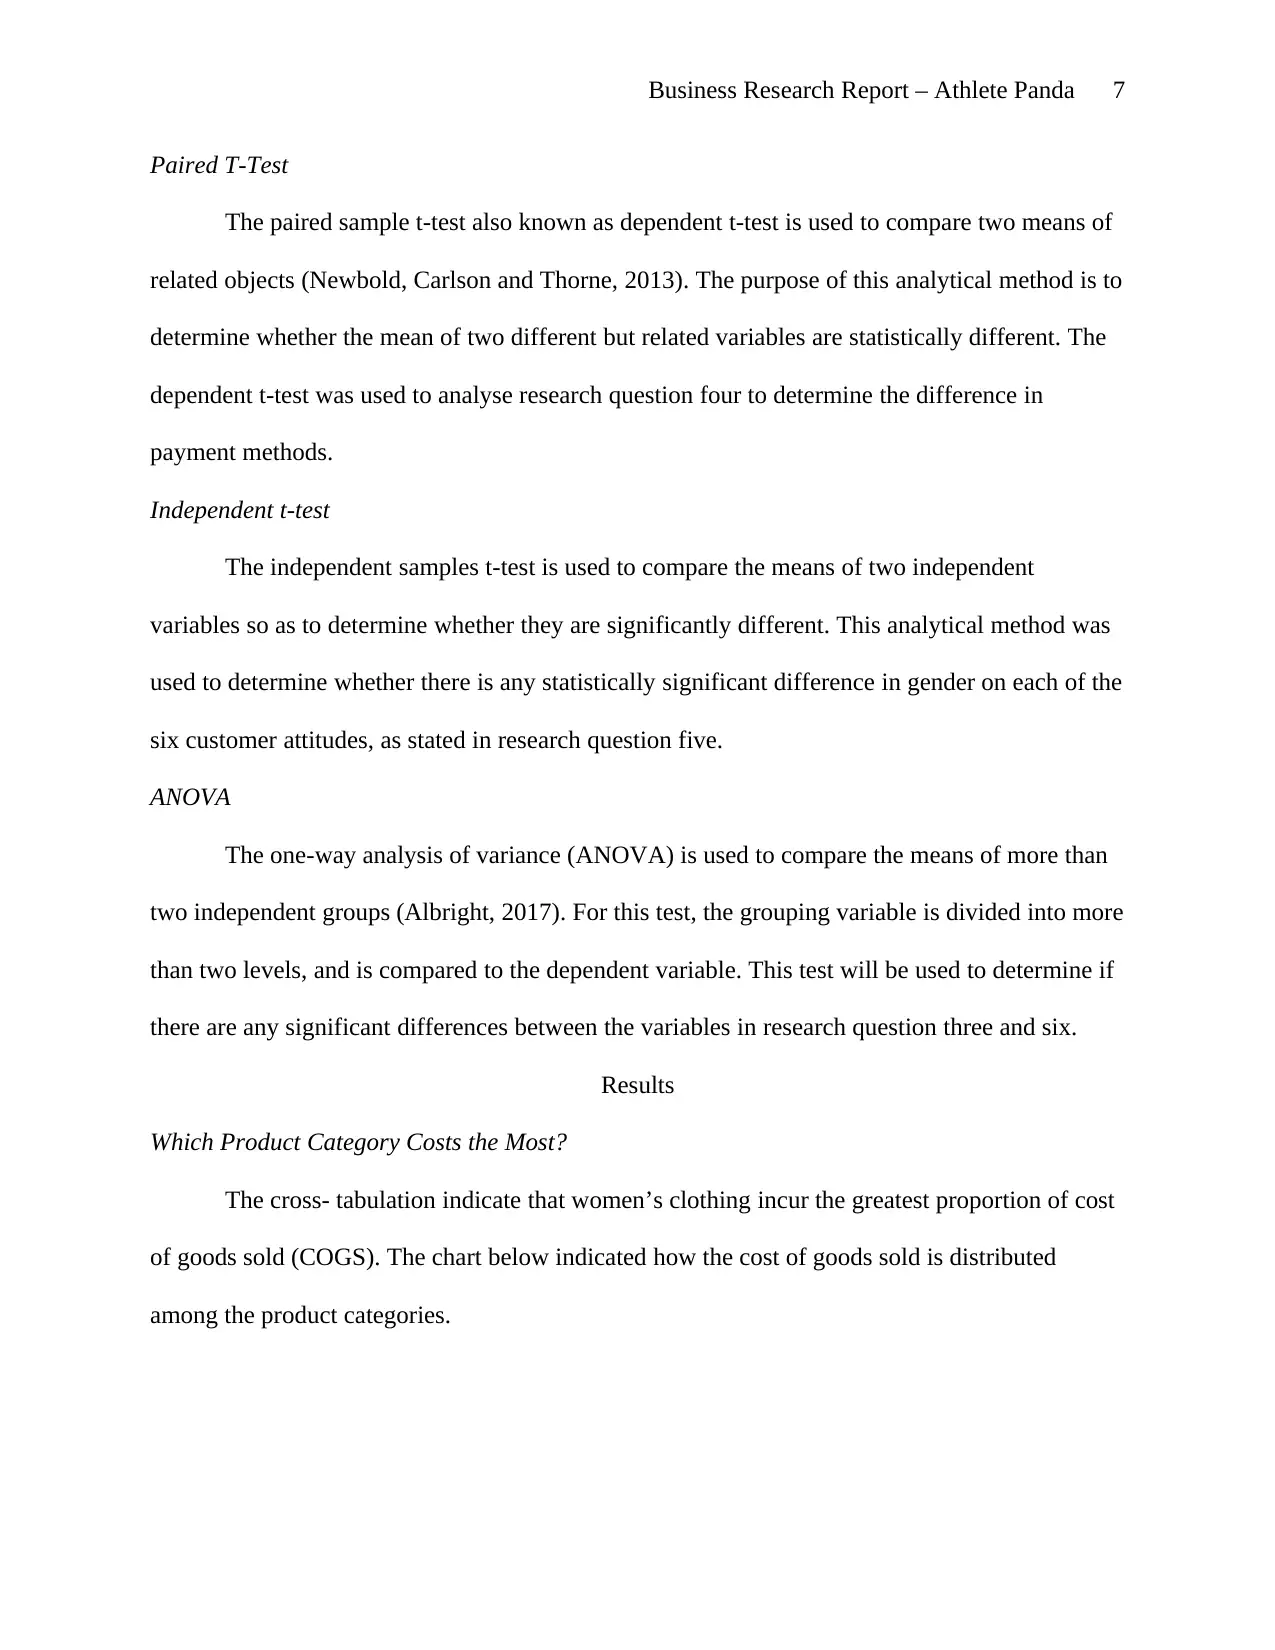
Which Product Categories Are Making Most Profit?
The results indicate that the product categories that are making most profit for the
business are men’s shoes ad women’s clothing. The sum total of these two product categories are
higher than any other product category as indicated in the chart below.
Figure 1: Pie Chart Cost of Goods Sold (COGS) by Product Category
Which Product Categories Are Making Most Profit?
The results indicate that the product categories that are making most profit for the
business are men’s shoes ad women’s clothing. The sum total of these two product categories are
higher than any other product category as indicated in the chart below.
Business Research Report – Athlete Panda 9
Figure 2: Bar Chart of Sum of Profit Total by Product Category
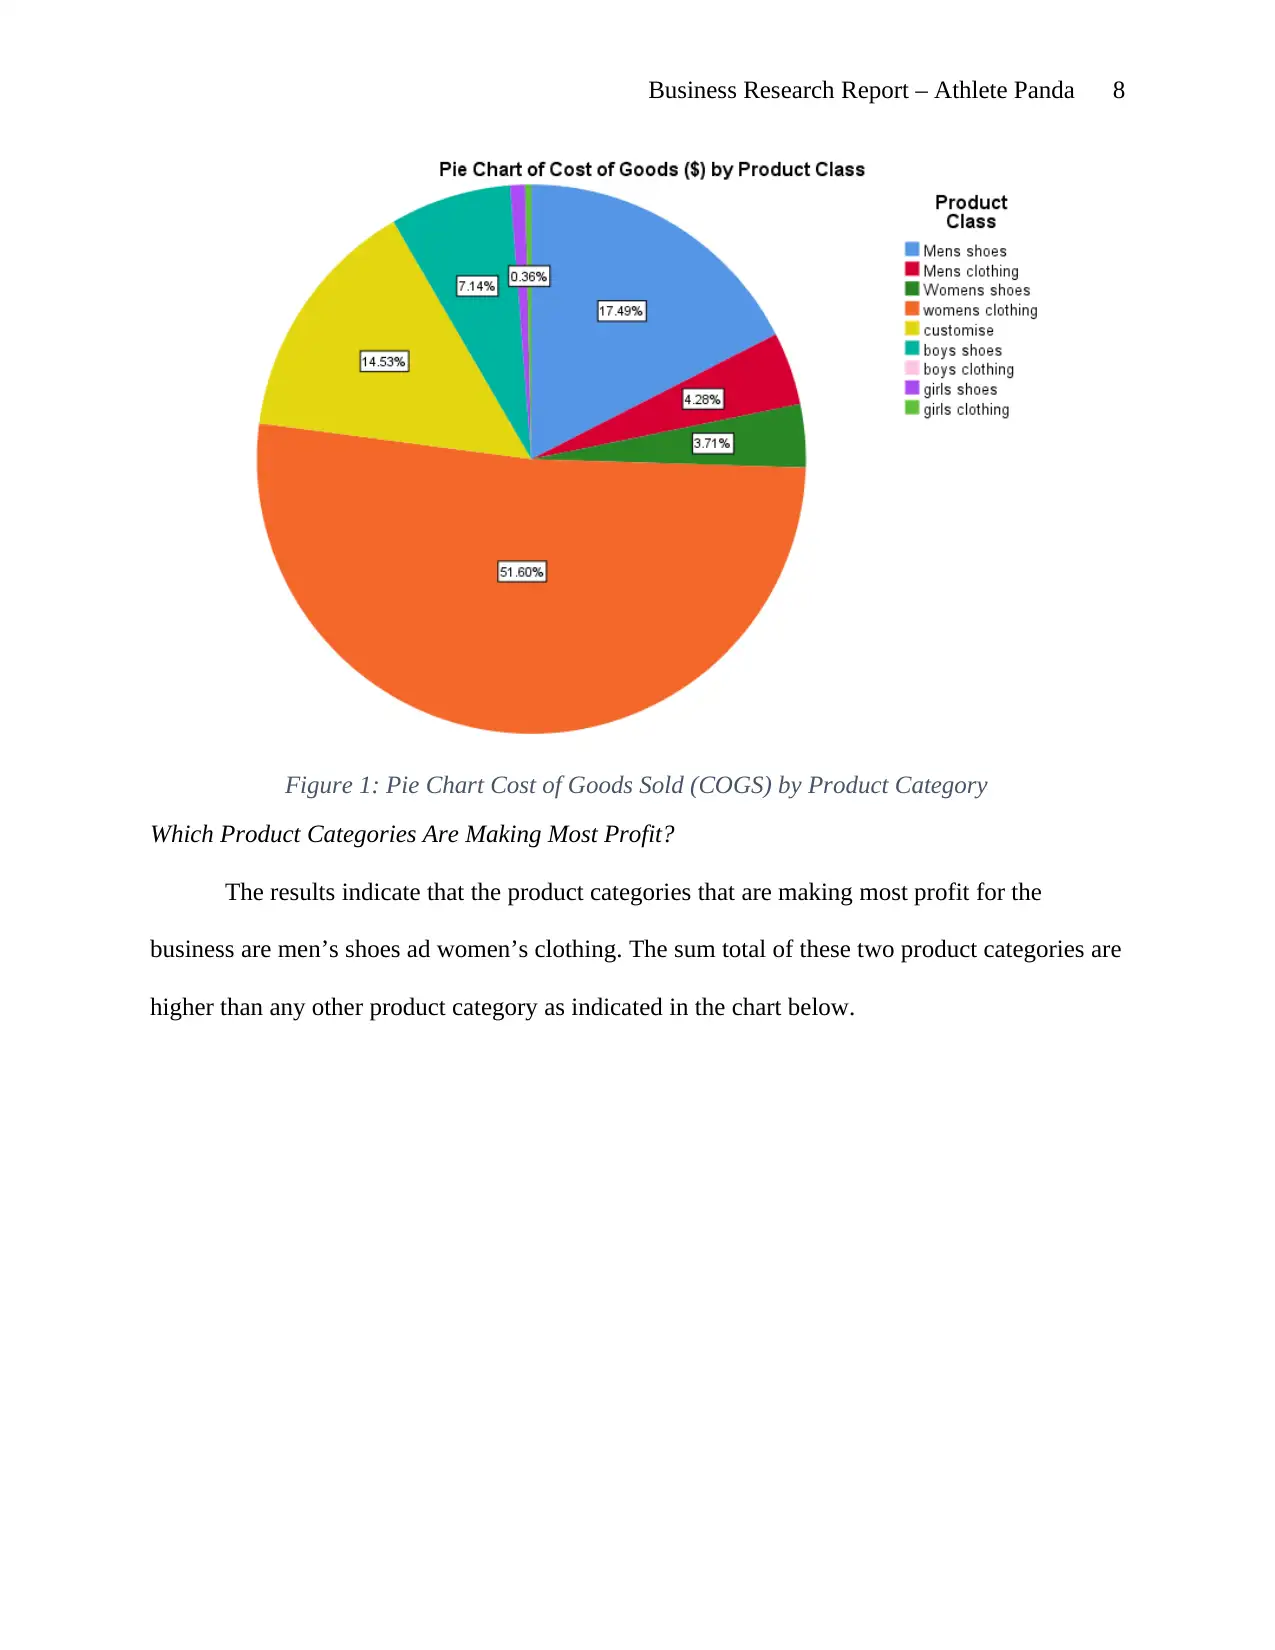
Is There A Difference in Store Location and Sales?
The mean plot results indicate that the mean profit differ among the four store locations.
With online stores having the highest mean profit. The ANOVA results, shown in the table
below indicate that the mean profit total is significantly different for at least one of the store
locations (F3,608 = 733.219, p < 0.001). The Turkey’s HSD post-hoc results show that the mean
profit total is not significantly different between middle and back stores, but is significantly
different between, the other pairs of store locations.
Figure 3: ANOVA results for Profit Total by Store Location
Figure 2: Bar Chart of Sum of Profit Total by Product Category
Is There A Difference in Store Location and Sales?
The mean plot results indicate that the mean profit differ among the four store locations.
With online stores having the highest mean profit. The ANOVA results, shown in the table
below indicate that the mean profit total is significantly different for at least one of the store
locations (F3,608 = 733.219, p < 0.001). The Turkey’s HSD post-hoc results show that the mean
profit total is not significantly different between middle and back stores, but is significantly
different between, the other pairs of store locations.
Figure 3: ANOVA results for Profit Total by Store Location
⊘ This is a preview!⊘
Do you want full access?
Subscribe today to unlock all pages.
Trusted by 1+ million students worldwide
Business Research Report – Athlete Panda 10
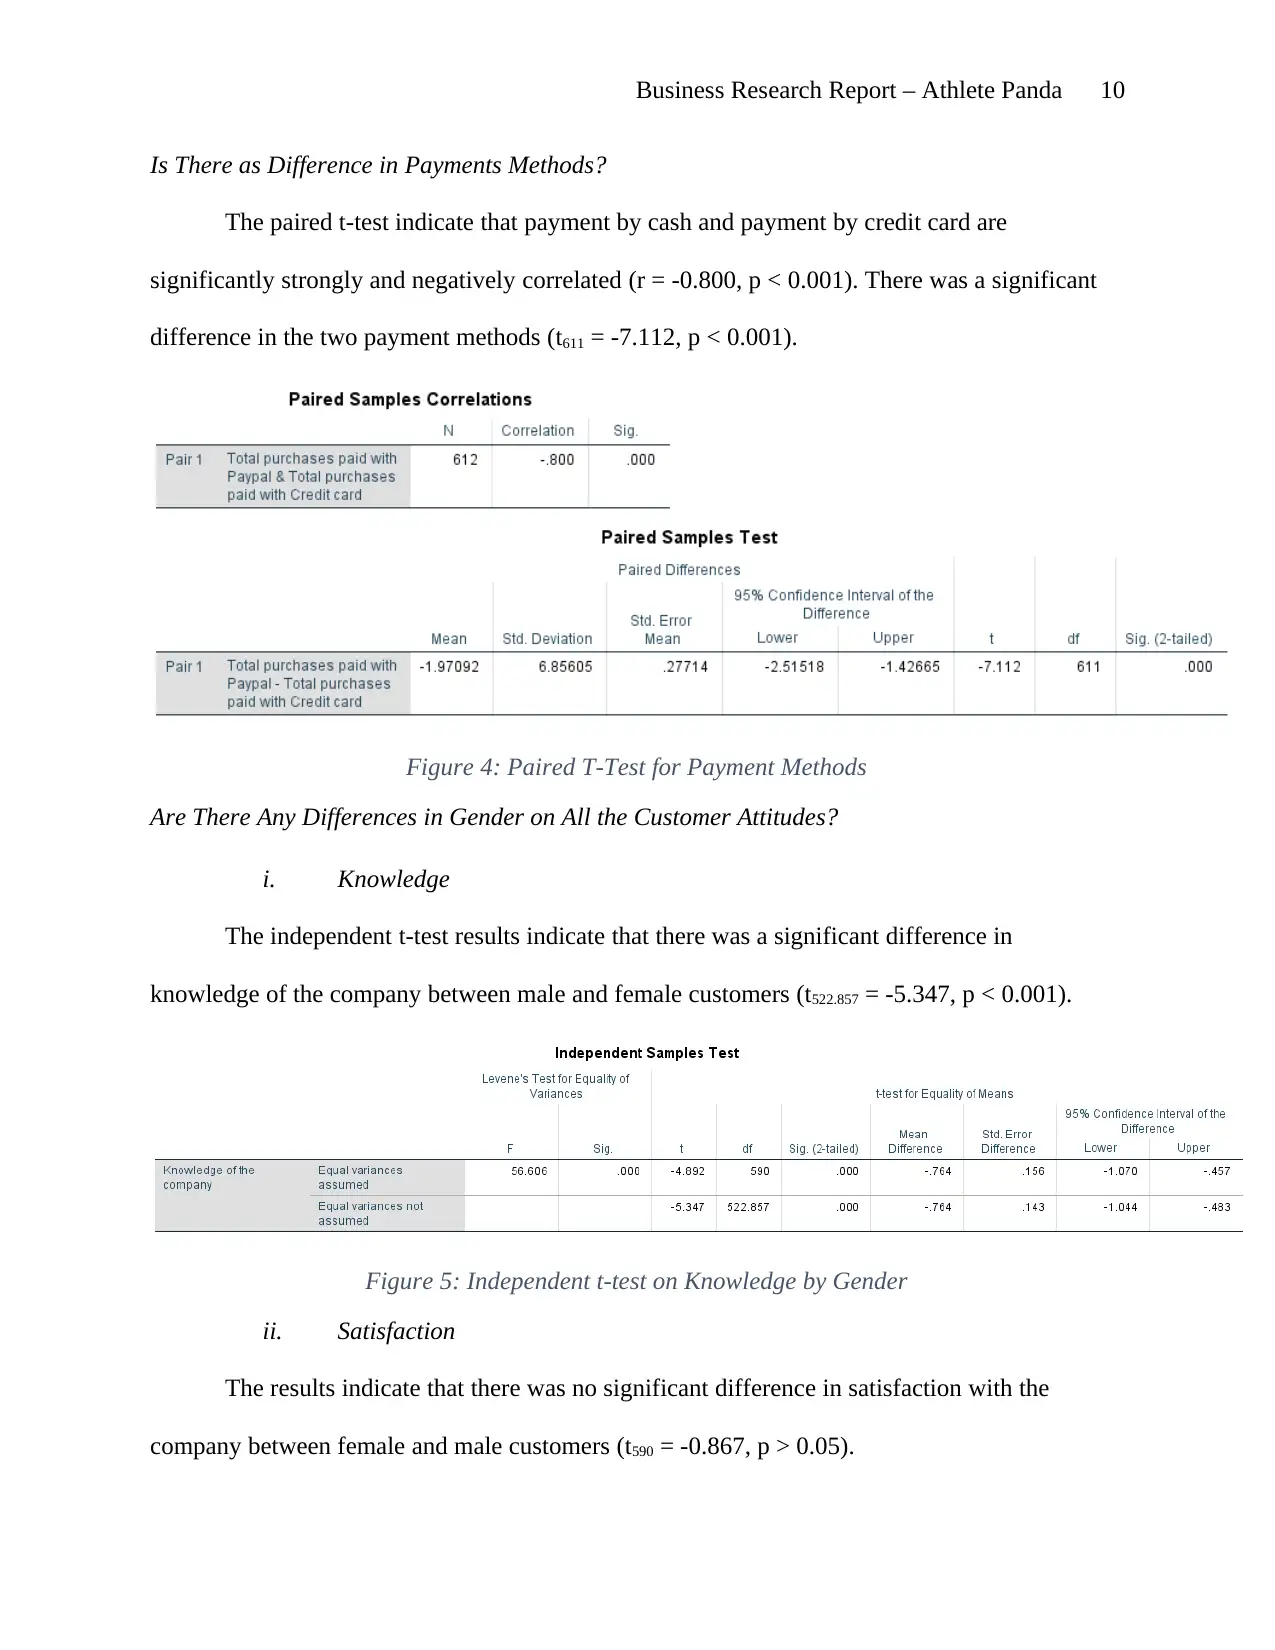
Is There as Difference in Payments Methods?
The paired t-test indicate that payment by cash and payment by credit card are
significantly strongly and negatively correlated (r = -0.800, p < 0.001). There was a significant
difference in the two payment methods (t611 = -7.112, p < 0.001).
Figure 4: Paired T-Test for Payment Methods
Are There Any Differences in Gender on All the Customer Attitudes?
i. Knowledge
The independent t-test results indicate that there was a significant difference in
knowledge of the company between male and female customers (t522.857 = -5.347, p < 0.001).
Figure 5: Independent t-test on Knowledge by Gender
ii. Satisfaction
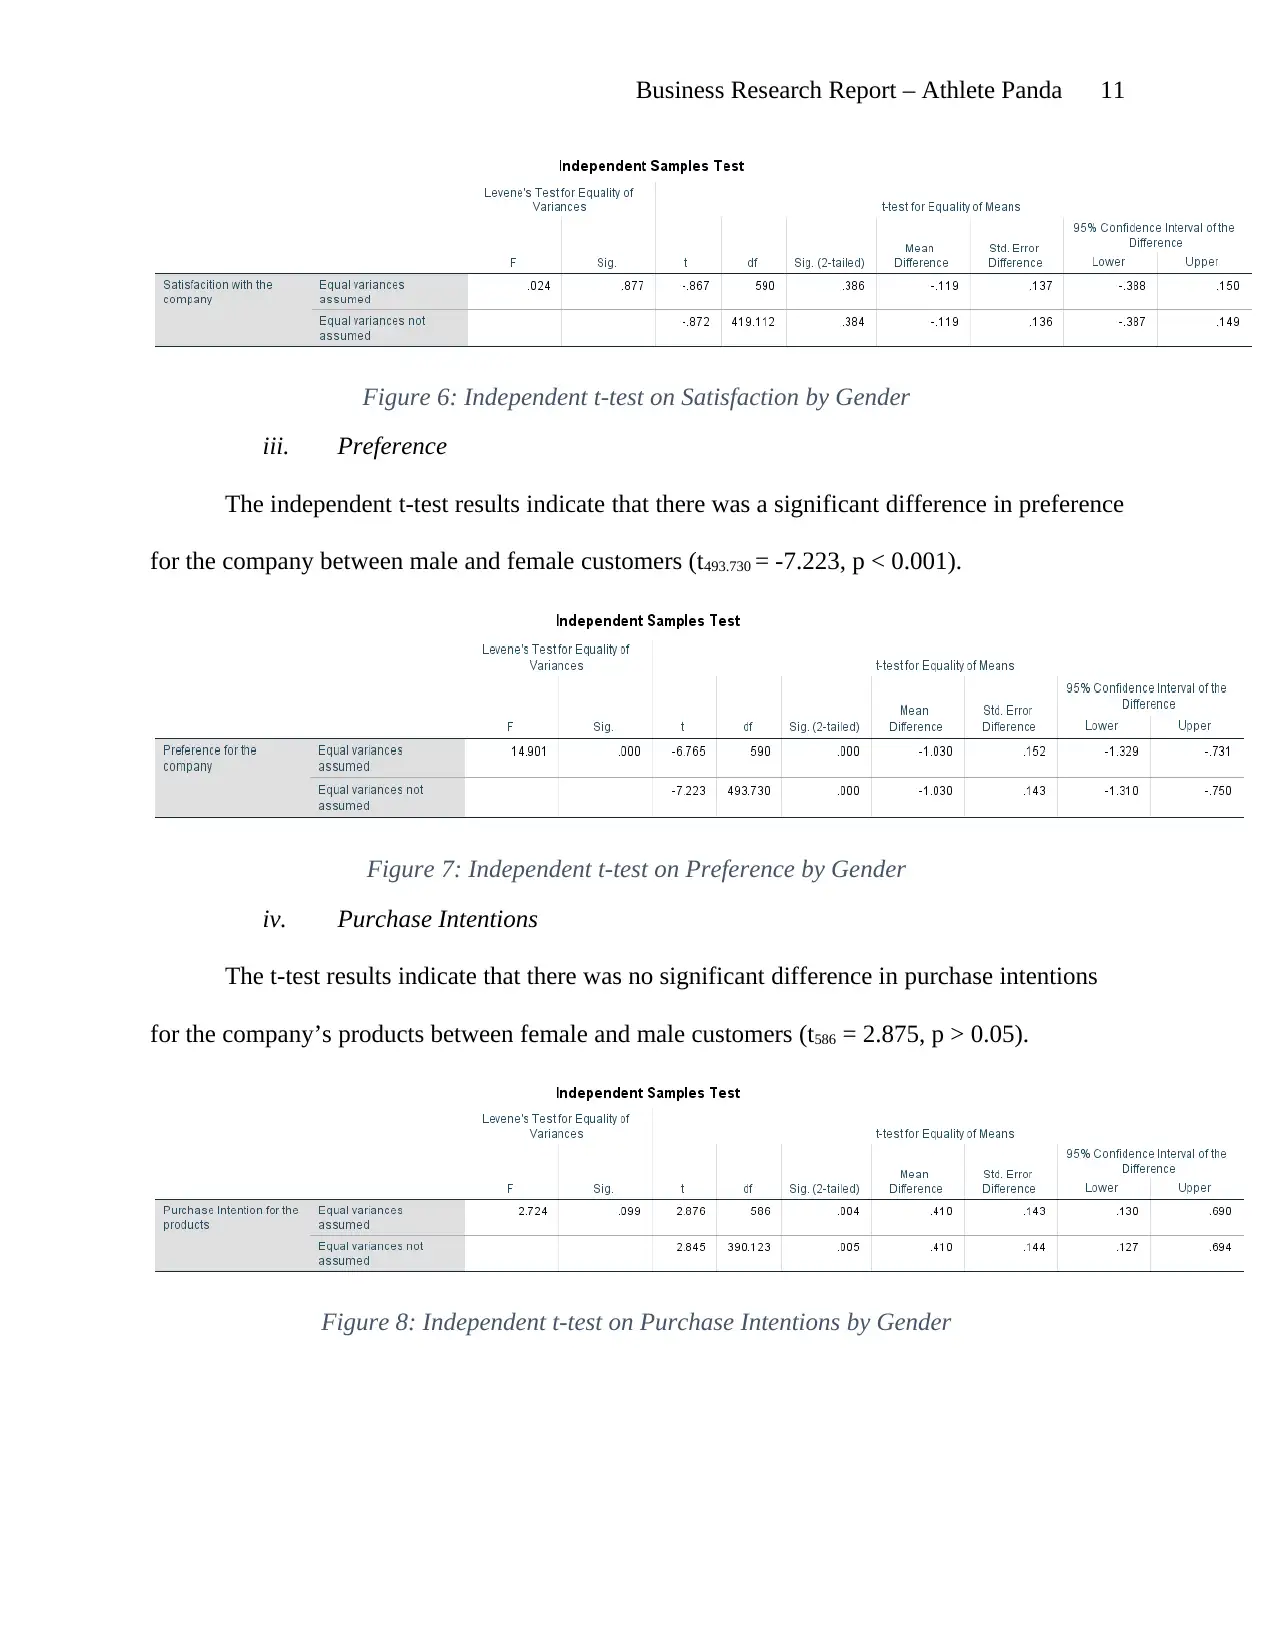
The results indicate that there was no significant difference in satisfaction with the
company between female and male customers (t590 = -0.867, p > 0.05).
Is There as Difference in Payments Methods?
The paired t-test indicate that payment by cash and payment by credit card are
significantly strongly and negatively correlated (r = -0.800, p < 0.001). There was a significant
difference in the two payment methods (t611 = -7.112, p < 0.001).
Figure 4: Paired T-Test for Payment Methods
Are There Any Differences in Gender on All the Customer Attitudes?
i. Knowledge
The independent t-test results indicate that there was a significant difference in
knowledge of the company between male and female customers (t522.857 = -5.347, p < 0.001).
Figure 5: Independent t-test on Knowledge by Gender
ii. Satisfaction
The results indicate that there was no significant difference in satisfaction with the
company between female and male customers (t590 = -0.867, p > 0.05).
Paraphrase This Document
Need a fresh take? Get an instant paraphrase of this document with our AI Paraphraser
Business Research Report – Athlete Panda 11
Figure 6: Independent t-test on Satisfaction by Gender
iii. Preference
The independent t-test results indicate that there was a significant difference in preference
for the company between male and female customers (t493.730 = -7.223, p < 0.001).
Figure 7: Independent t-test on Preference by Gender
iv. Purchase Intentions
The t-test results indicate that there was no significant difference in purchase intentions
for the company’s products between female and male customers (t586 = 2.875, p > 0.05).
Figure 8: Independent t-test on Purchase Intentions by Gender
Business Research Report – Athlete Panda 12
v. Loyalty
The t-test results indicate that there was a significant difference in loyalty for the
company between male and female customers (t586.589 = -16.471, p < 0.001).
vi. Recommend
The t-test results indicate that there was no significant difference in whether the customer
would recommend the company to a friend between female and male customers (t590 = 1.442, p >
0.05).
Are There Any Differences in The User Groups on All the Customer Attitudes?
i. Knowledge
The ANOVA results indicate that the knowledge of the company is significantly different
for at least one user groups (F2,589 = 35.401, p < 0.001). From the mean plots, the user groups
⊘ This is a preview!⊘
Do you want full access?
Subscribe today to unlock all pages.
Trusted by 1+ million students worldwide
1 out of 21
Related Documents


Your All-in-One AI-Powered Toolkit for Academic Success.
+13062052269
info@desklib.com
Available 24*7 on WhatsApp / Email
![[object Object]](/_next/static/media/star-bottom.7253800d.svg)
Unlock your academic potential
Copyright © 2020–2026 A2Z Services. All Rights Reserved. Developed and managed by ZUCOL.